Test 3: airborne survey
import packages
[1]:
%load_ext autoreload
%autoreload 2
import logging
import os
import pathlib
import pickle
import string
import numpy as np
import pandas as pd
import scipy as sp
import verde as vd
import xarray as xr
from invert4geom import inversion, optimization, plotting, regional, uncertainty, utils
from polartoolkit import fetch, maps, profiles
from polartoolkit import utils as polar_utils
import synthetic_bathymetry_inversion.plotting as synth_plotting
from synthetic_bathymetry_inversion import synthetic
os.environ["POLARTOOLKIT_HEMISPHERE"] = "south"
logging.getLogger().setLevel(logging.INFO)
/home/sungw937/miniforge3/envs/synthetic_bathymetry_inversion/lib/python3.12/site-packages/UQpy/__init__.py:6: UserWarning:
pkg_resources is deprecated as an API. See https://setuptools.pypa.io/en/latest/pkg_resources.html. The pkg_resources package is slated for removal as early as 2025-11-30. Refrain from using this package or pin to Setuptools<81.
[2]:
fpath = "../results/Ross_Sea/Ross_Sea_03"
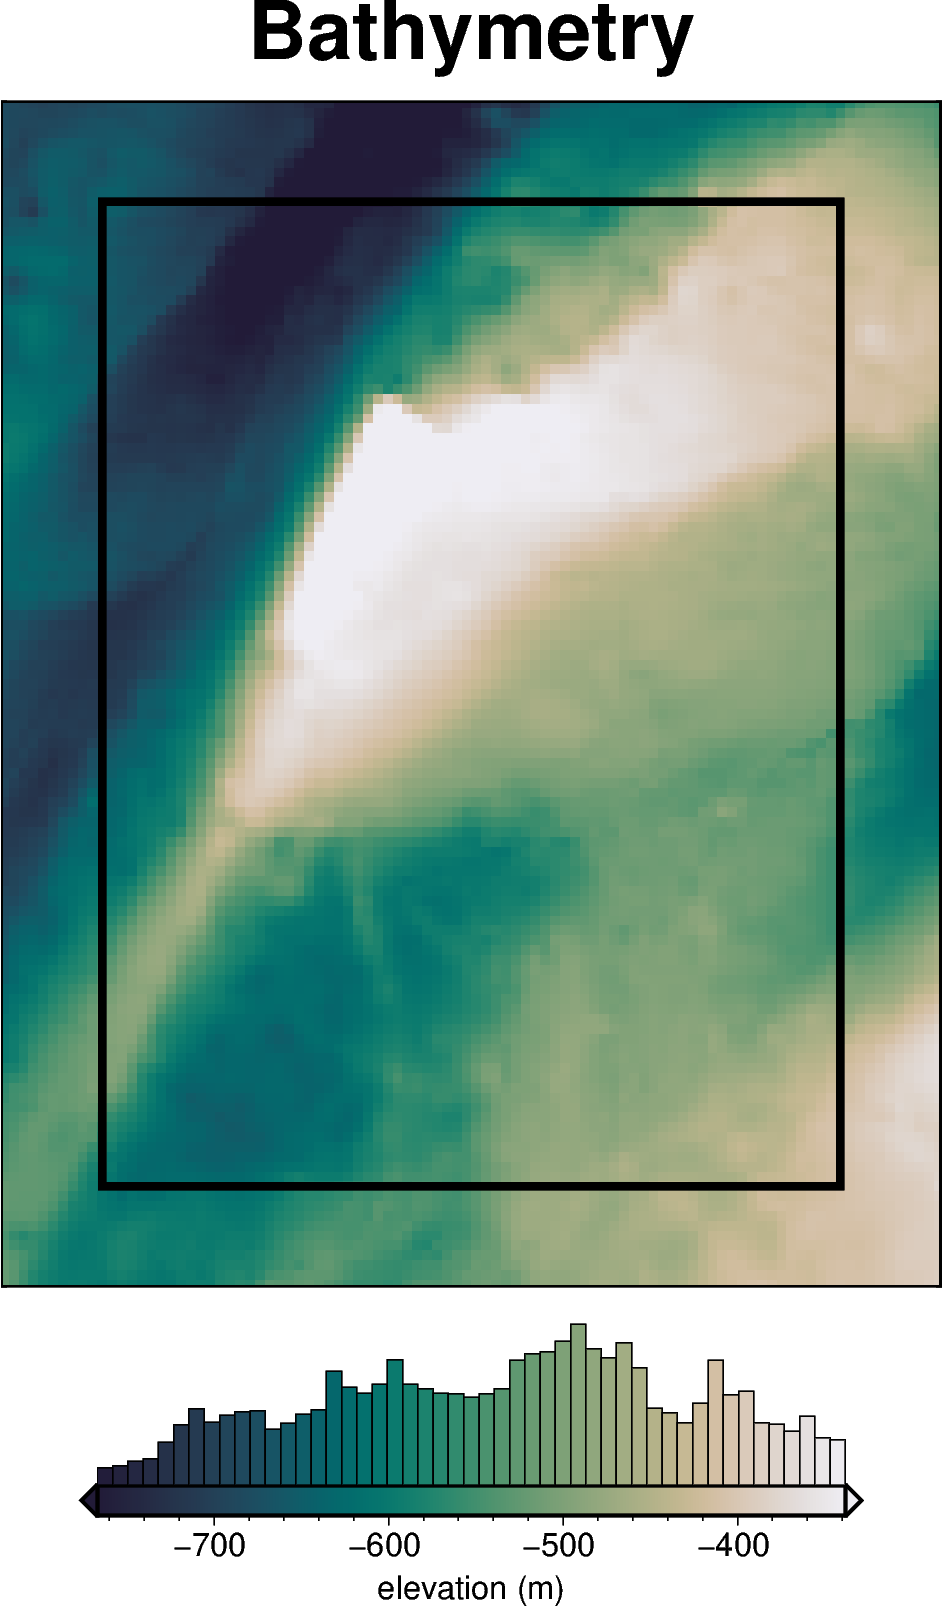
Get synthetic model data
[3]:
# set grid parameters
spacing = 2e3
inversion_region = (-40e3, 110e3, -1600e3, -1400e3)
true_density_contrast = 1476
bathymetry, basement, grav_df = synthetic.load_synthetic_model(
spacing=spacing,
inversion_region=inversion_region,
buffer=spacing * 10,
zref=0,
bathymetry_density_contrast=true_density_contrast,
)
buffer_region = polar_utils.get_grid_info(bathymetry)[1]
# rename the full res gravity column
grav_df = grav_df.rename(columns={"gravity_anomaly": "gravity_anomaly_full_res"})
requested spacing (2000.0) is smaller than the original (5000.0).
[4]:
grav_df.head()
[4]:
| northing | easting | upward | bathymetry_grav | basement_grav | disturbance | gravity_anomaly_full_res | |
|---|---|---|---|---|---|---|---|
| 0 | -1600000.0 | -40000.0 | 1000.0 | -35.551055 | 0 | -35.551055 | -35.551055 |
| 1 | -1600000.0 | -38000.0 | 1000.0 | -36.054657 | 0 | -36.054657 | -36.054657 |
| 2 | -1600000.0 | -36000.0 | 1000.0 | -36.473147 | 0 | -36.473147 | -36.473147 |
| 3 | -1600000.0 | -34000.0 | 1000.0 | -36.755609 | 0 | -36.755609 | -36.755609 |
| 4 | -1600000.0 | -32000.0 | 1000.0 | -36.951029 | 0 | -36.951029 | -36.951029 |
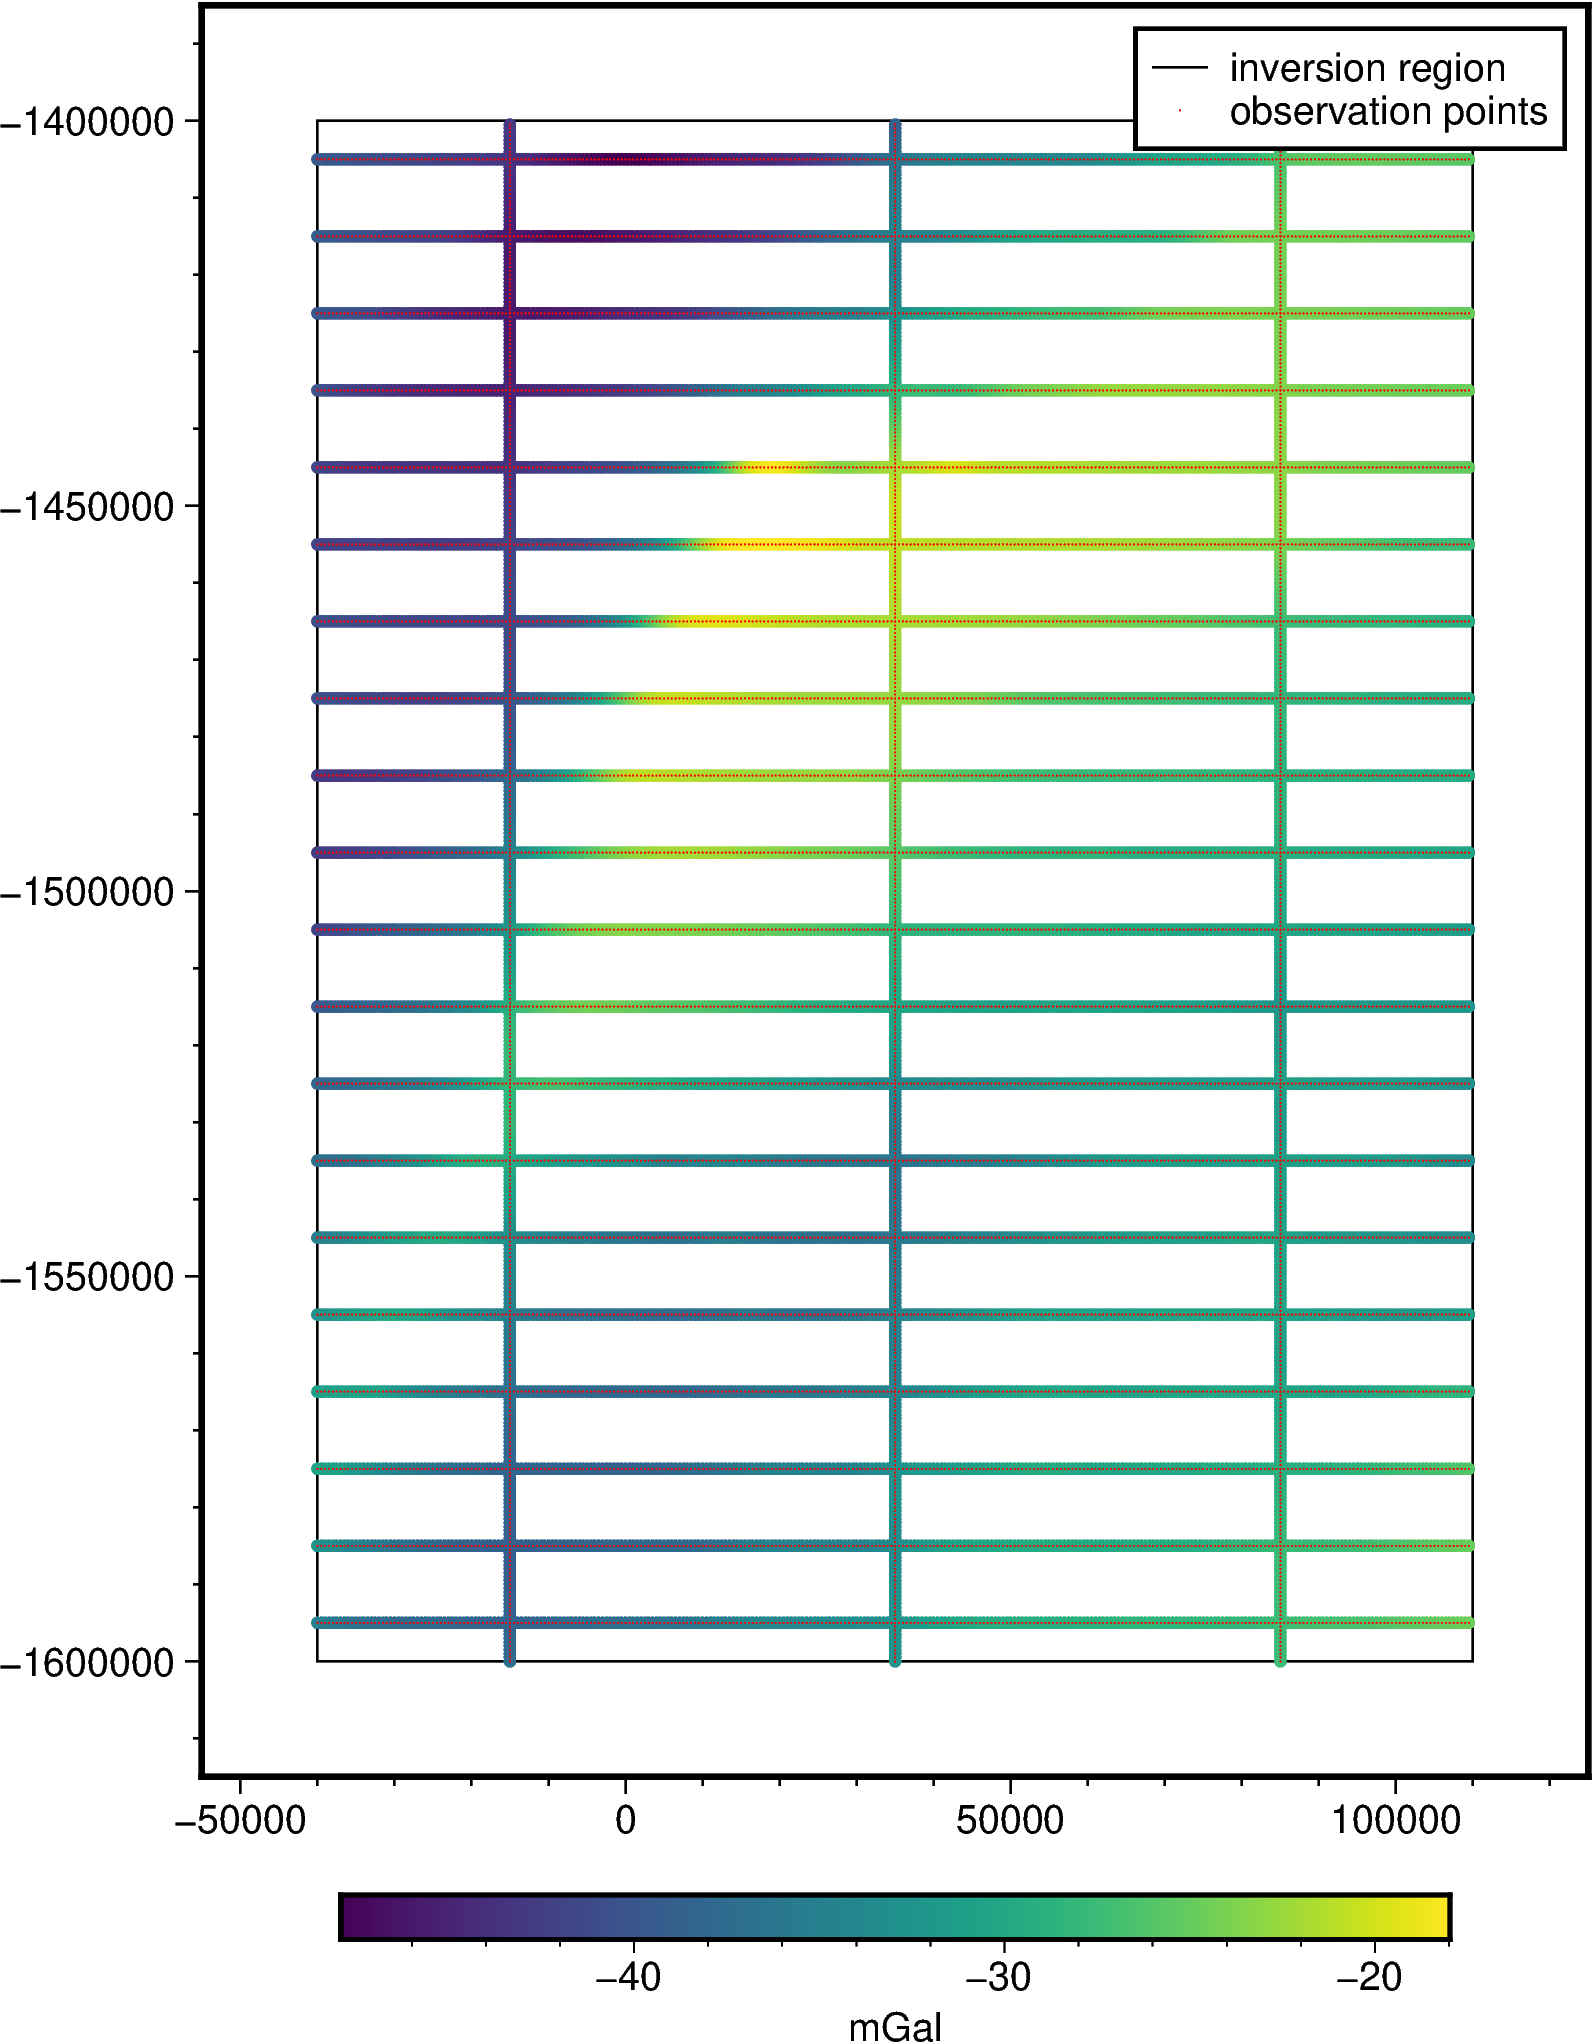
Create synthetic airborne survey
[5]:
grav_survey_df = synthetic.airborne_survey(
along_line_spacing=500,
grav_observation_height=1e3,
ns_line_spacing=50e3,
ew_line_spacing=10e3,
region=inversion_region,
grav_grid=grav_df.set_index(
["northing", "easting"]
).gravity_anomaly_full_res.to_xarray(),
plot=True,
)
grav_survey_df
plotted values not provided via 'grid', so cannot determine if to add colorbar end triangles or not.
[5]:
| northing | easting | upward | line | time | geometry | dist_along_line | gravity_anomaly | |
|---|---|---|---|---|---|---|---|---|
| 0 | -1600000.0 | -15000.0 | 1000.0 | 1000.0 | 0.0 | POINT (-15000 -1600000) | 0.0 | -37.186843 |
| 1 | -1600000.0 | 35000.0 | 1000.0 | 1010.0 | 0.0 | POINT (35000 -1600000) | 0.0 | -32.340147 |
| 2 | -1600000.0 | 85000.0 | 1000.0 | 1020.0 | 0.0 | POINT (85000 -1600000) | 0.0 | -27.510170 |
| 3 | -1599500.0 | -15000.0 | 1000.0 | 1000.0 | 1.0 | POINT (-15000 -1599500) | 500.0 | -37.302458 |
| 4 | -1599500.0 | 35000.0 | 1000.0 | 1010.0 | 1.0 | POINT (35000 -1599500) | 500.0 | -32.358626 |
| ... | ... | ... | ... | ... | ... | ... | ... | ... |
| 5995 | -1405000.0 | 107500.0 | 1000.0 | 29.0 | 295.0 | POINT (107500 -1405000) | 147500.0 | -25.738786 |
| 5996 | -1405000.0 | 108000.0 | 1000.0 | 29.0 | 296.0 | POINT (108000 -1405000) | 148000.0 | -25.748257 |
| 5997 | -1405000.0 | 108500.0 | 1000.0 | 29.0 | 297.0 | POINT (108500 -1405000) | 148500.0 | -25.754398 |
| 5998 | -1405000.0 | 109000.0 | 1000.0 | 29.0 | 298.0 | POINT (109000 -1405000) | 149000.0 | -25.757028 |
| 5999 | -1405000.0 | 109500.0 | 1000.0 | 29.0 | 299.0 | POINT (109500 -1405000) | 149500.0 | -25.758974 |
7200 rows × 8 columns
[6]:
num_ties = len(grav_survey_df[grav_survey_df.line >= 1000].line.unique())
num_flights = len(grav_survey_df[grav_survey_df.line < 1000].line.unique())
(
num_flights,
num_ties,
)
[6]:
(20, 3)
[7]:
x_spacing = (inversion_region[1] - inversion_region[0]) / num_ties
y_spacing = (inversion_region[3] - inversion_region[2]) / num_flights
grav_line_spacing = ((x_spacing + y_spacing) / 2) / 1e3
grav_line_spacing
[7]:
30.0
[8]:
w = np.abs(inversion_region[1] - inversion_region[0]) / 1e3
h = np.abs(inversion_region[3] - inversion_region[2]) / 1e3
w, h
[8]:
(np.float64(150.0), np.float64(200.0))
[9]:
flight_kms = w * num_ties + h * num_flights
flight_kms
[9]:
np.float64(4450.0)
[10]:
inversion_area = (
(inversion_region[1] - inversion_region[0])
/ 1e3
* (inversion_region[3] - inversion_region[2])
/ 1e3
)
inversion_area
[10]:
30000.0
[11]:
flight_kms_per_10000sq_km = (flight_kms / inversion_area) * 10e3
flight_kms_per_10000sq_km
[11]:
np.float64(1483.3333333333335)
[12]:
# calculate gravity data median distance
grd = bathymetry.sel(
easting=slice(*inversion_region[:2]), northing=slice(*inversion_region[2:])
)
grd = fetch.resample_grid(grd, spacing=100, verbose="q").rename(
{"x": "easting", "y": "northing"}
)
min_dist = utils.dist_nearest_points(
grav_survey_df,
grd,
).min_dist
fig = maps.plot_grd(
min_dist,
title="Median distance to gravity survey points",
cbar_label="distance (m)",
cbar_font="18p,Helvetica,black",
cmap="dense",
frame=["nSWe", "xaf10000", "yaf10000"],
hist=True,
hist_bin_num=50,
cpt_lims=[
0,
polar_utils.get_min_max(
min_dist,
robust=True,
)[1],
],
points=grav_survey_df,
points_style="p1p",
points_fill="black",
)
fig.show()
print(f"mean minimum distance: {int(min_dist.mean().to_numpy())} m")
print(f"median minimum distance: {int(min_dist.median().to_numpy())} m")
requested spacing (100) is smaller than the original (2000.0).
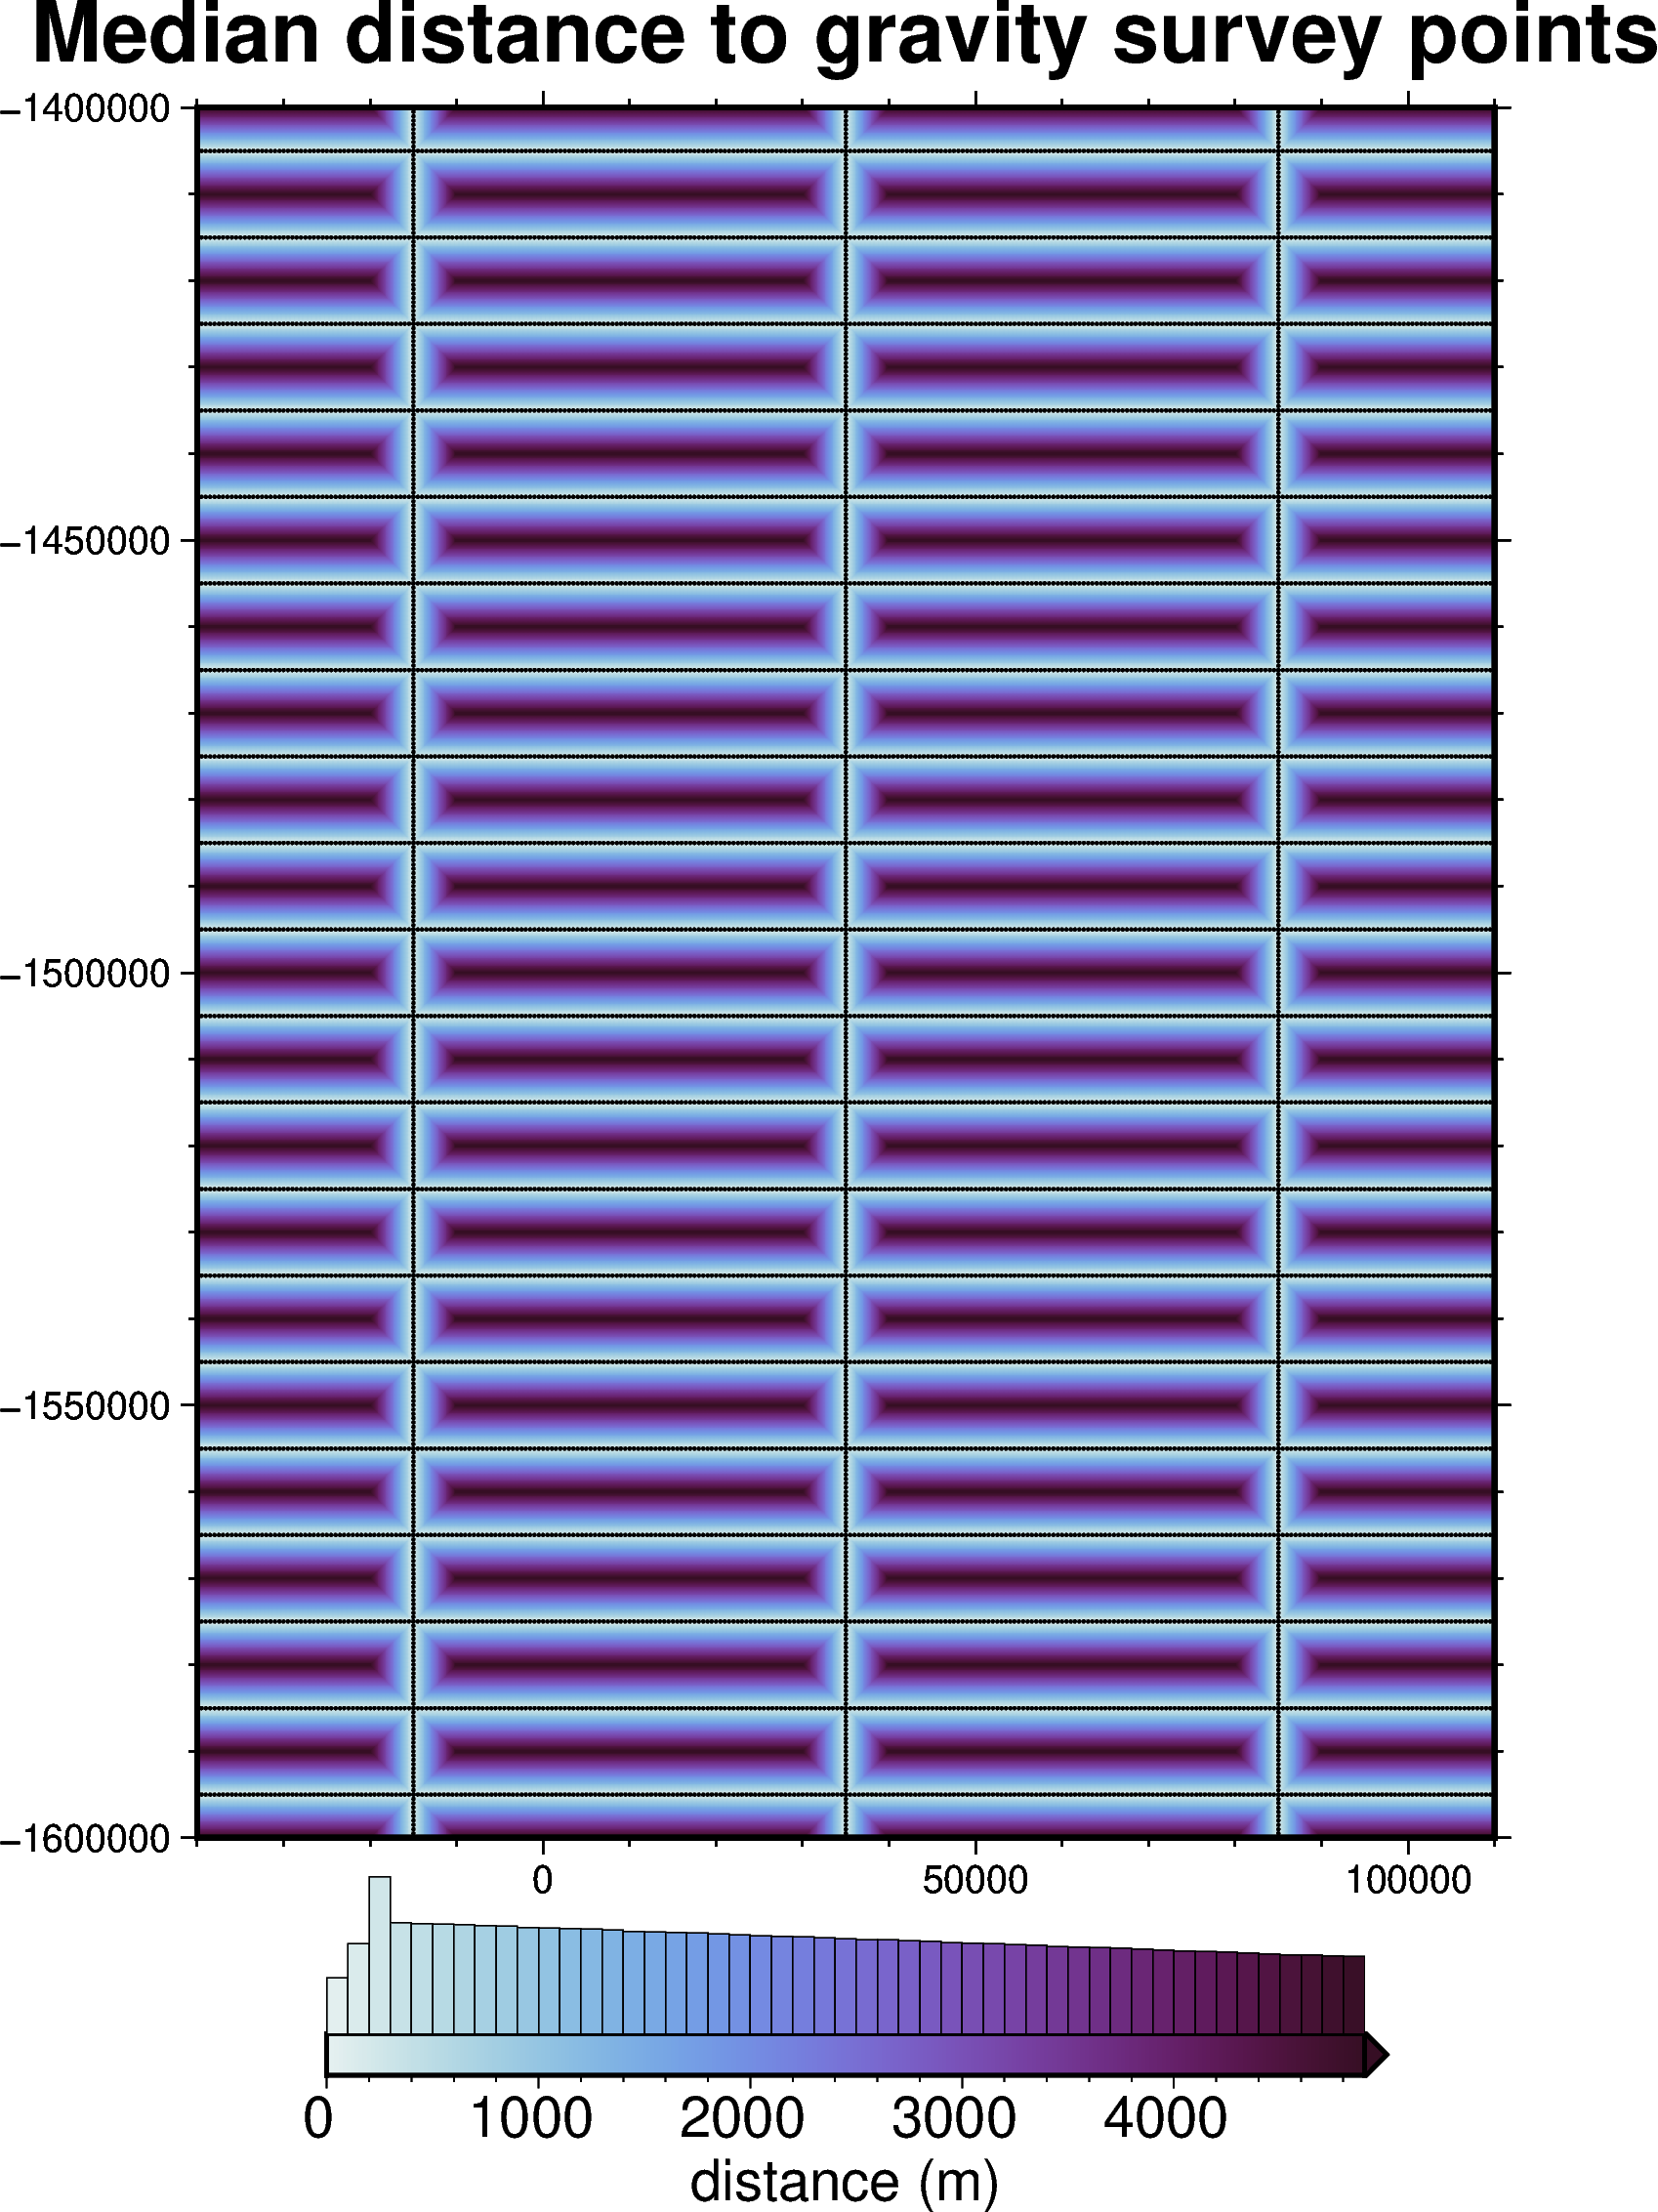
mean minimum distance: 2344 m
median minimum distance: 2300 m
[13]:
# save to csv
grav_survey_df.to_csv(f"{fpath}_grav_survey_df.csv", index=False)
[14]:
# grid the airborne survey data over the whole grid
coords = (grav_survey_df.easting, grav_survey_df.northing, grav_survey_df.upward)
data = grav_survey_df.gravity_anomaly
eq_study, eqs = optimization.optimize_eq_source_params(
coords,
data,
n_trials=12,
damping_limits=(1e-3, 10),
depth_limits=(100, 100e3),
block_size=spacing,
plot=True,
fname=f"{fpath}_eq_sources",
)
plotting failed with error: Mime type rendering requires nbformat>=4.2.0 but it is not installed
[15]:
study_df = eq_study.trials_dataframe()
study_df
[15]:
| number | value | datetime_start | datetime_complete | duration | params_damping | params_depth | system_attrs_fixed_params | state | |
|---|---|---|---|---|---|---|---|---|---|
| 0 | 0 | -0.895877 | 2025-10-14 14:29:40.442497 | 2025-10-14 14:29:49.499828 | 0 days 00:00:09.057331 | 0.001000 | 100.000000 | {'damping': 0.001, 'depth': 100} | COMPLETE |
| 1 | 1 | 0.919447 | 2025-10-14 14:29:49.502569 | 2025-10-14 14:29:56.768672 | 0 days 00:00:07.266103 | 10.000000 | 100000.000000 | {'damping': 10, 'depth': 100000.0} | COMPLETE |
| 2 | 2 | 0.999986 | 2025-10-14 14:29:56.771327 | 2025-10-14 14:30:01.375794 | 0 days 00:00:04.604467 | 0.001643 | 10002.265810 | NaN | COMPLETE |
| 3 | 3 | 0.976299 | 2025-10-14 14:30:01.380711 | 2025-10-14 14:30:06.333186 | 0 days 00:00:04.952475 | 0.762644 | 59952.265810 | NaN | COMPLETE |
| 4 | 4 | 0.994434 | 2025-10-14 14:30:06.340498 | 2025-10-14 14:30:12.401418 | 0 days 00:00:06.060920 | 0.035399 | 34977.265810 | NaN | COMPLETE |
| 5 | 5 | 0.976426 | 2025-10-14 14:30:12.405263 | 2025-10-14 14:30:21.988305 | 0 days 00:00:09.583042 | 0.004572 | 84927.265810 | NaN | COMPLETE |
| 6 | 6 | 0.995391 | 2025-10-14 14:30:22.019279 | 2025-10-14 14:30:30.658220 | 0 days 00:00:08.638941 | 2.122102 | 22489.765810 | NaN | COMPLETE |
| 7 | 7 | 0.975067 | 2025-10-14 14:30:30.659713 | 2025-10-14 14:30:33.377640 | 0 days 00:00:02.717927 | 0.098499 | 72439.765810 | NaN | COMPLETE |
| 8 | 8 | 0.999677 | 2025-10-14 14:30:33.405174 | 2025-10-14 14:30:40.256842 | 0 days 00:00:06.851668 | 0.001000 | 19115.478929 | NaN | COMPLETE |
| 9 | 9 | 0.999350 | 2025-10-14 14:30:40.258524 | 2025-10-14 14:30:48.611805 | 0 days 00:00:08.353281 | 0.411685 | 14173.067440 | NaN | COMPLETE |
| 10 | 10 | 0.977453 | 2025-10-14 14:30:48.613812 | 2025-10-14 14:30:58.976850 | 0 days 00:00:10.363038 | 10.000000 | 45394.055476 | NaN | COMPLETE |
| 11 | 11 | 0.999952 | 2025-10-14 14:30:58.998486 | 2025-10-14 14:31:05.847557 | 0 days 00:00:06.849071 | 0.001000 | 13499.630288 | NaN | COMPLETE |
[16]:
q1 = study_df.value.quantile(0.25)
q3 = study_df.value.quantile(0.75)
iqr = q3 - q1
upper_bound = q3 + 1.5 * iqr
lower_bound = q1 - 1.5 * iqr
study_df2 = study_df[(study_df.value < upper_bound) & (study_df.value > lower_bound)]
study_df2
[16]:
| number | value | datetime_start | datetime_complete | duration | params_damping | params_depth | system_attrs_fixed_params | state | |
|---|---|---|---|---|---|---|---|---|---|
| 2 | 2 | 0.999986 | 2025-10-14 14:29:56.771327 | 2025-10-14 14:30:01.375794 | 0 days 00:00:04.604467 | 0.001643 | 10002.265810 | NaN | COMPLETE |
| 3 | 3 | 0.976299 | 2025-10-14 14:30:01.380711 | 2025-10-14 14:30:06.333186 | 0 days 00:00:04.952475 | 0.762644 | 59952.265810 | NaN | COMPLETE |
| 4 | 4 | 0.994434 | 2025-10-14 14:30:06.340498 | 2025-10-14 14:30:12.401418 | 0 days 00:00:06.060920 | 0.035399 | 34977.265810 | NaN | COMPLETE |
| 5 | 5 | 0.976426 | 2025-10-14 14:30:12.405263 | 2025-10-14 14:30:21.988305 | 0 days 00:00:09.583042 | 0.004572 | 84927.265810 | NaN | COMPLETE |
| 6 | 6 | 0.995391 | 2025-10-14 14:30:22.019279 | 2025-10-14 14:30:30.658220 | 0 days 00:00:08.638941 | 2.122102 | 22489.765810 | NaN | COMPLETE |
| 7 | 7 | 0.975067 | 2025-10-14 14:30:30.659713 | 2025-10-14 14:30:33.377640 | 0 days 00:00:02.717927 | 0.098499 | 72439.765810 | NaN | COMPLETE |
| 8 | 8 | 0.999677 | 2025-10-14 14:30:33.405174 | 2025-10-14 14:30:40.256842 | 0 days 00:00:06.851668 | 0.001000 | 19115.478929 | NaN | COMPLETE |
| 9 | 9 | 0.999350 | 2025-10-14 14:30:40.258524 | 2025-10-14 14:30:48.611805 | 0 days 00:00:08.353281 | 0.411685 | 14173.067440 | NaN | COMPLETE |
| 10 | 10 | 0.977453 | 2025-10-14 14:30:48.613812 | 2025-10-14 14:30:58.976850 | 0 days 00:00:10.363038 | 10.000000 | 45394.055476 | NaN | COMPLETE |
| 11 | 11 | 0.999952 | 2025-10-14 14:30:58.998486 | 2025-10-14 14:31:05.847557 | 0 days 00:00:06.849071 | 0.001000 | 13499.630288 | NaN | COMPLETE |
[17]:
stdev = np.log10(study_df2.params_damping).std()
stdev = stdev / 4
stdev
[17]:
np.float64(0.3664621982405064)
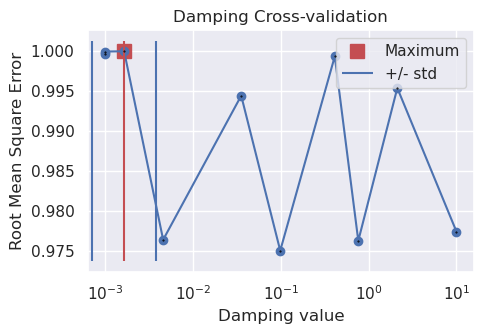
[18]:
df = study_df2.sort_values(by="value")
fig = plotting.plot_cv_scores(
df.value,
df.params_damping,
param_name="Damping",
logx=True,
best="max",
)
ax = fig.axes[0]
best = float(study_df2.params_damping.iloc[0])
upper = float(10 ** (np.log10(best) + stdev))
lower = float(10 ** (np.log10(best) - stdev))
y_lims = ax.get_ylim()
ax.vlines(best, ymin=y_lims[0], ymax=y_lims[1], color="r")
ax.vlines(upper, ymin=y_lims[0], ymax=y_lims[1], label="+/- std")
ax.vlines(lower, ymin=y_lims[0], ymax=y_lims[1])
x_lims = ax.get_xlim()
ax.set_xlim(
min(x_lims[0], lower),
max(x_lims[1], upper),
)
ax.legend()
print("best:", best, "\nstd:", stdev, "\n+1std:", upper, "\n-1std:", lower)
best: 0.0016430661458014173
std: 0.3664621982405064
+1std: 0.003820473975280557
-1std: 0.0007066312653734211
[19]:
stdev = study_df2.params_depth.std()
stdev = stdev / 4
stdev
[19]:
np.float64(6709.298875064652)
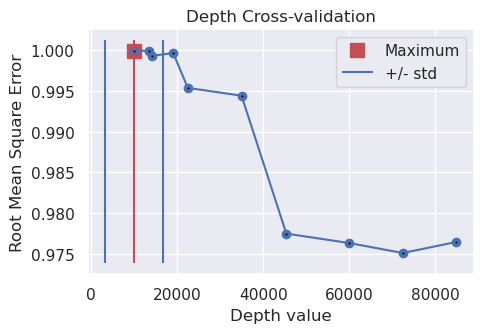
[20]:
df = study_df2.sort_values(by="value")
fig = plotting.plot_cv_scores(
df.value,
df.params_depth,
param_name="Depth",
best="max",
)
ax = fig.axes[0]
best = float(study_df2.params_depth.iloc[0])
upper = best + stdev
lower = best - stdev
y_lims = ax.get_ylim()
ax.vlines(best, ymin=y_lims[0], ymax=y_lims[1], color="r")
ax.vlines(upper, ymin=y_lims[0], ymax=y_lims[1], label="+/- std")
ax.vlines(lower, ymin=y_lims[0], ymax=y_lims[1])
x_lims = ax.get_xlim()
ax.set_xlim(
min(x_lims[0], lower),
max(x_lims[1], upper),
)
ax.legend()
print("best:", best, "\nstd:", stdev, "\n+1std:", upper, "\n-1std:", lower)
best: 10002.265810449084
std: 6709.298875064652
+1std: 16711.564685513735
-1std: 3292.966935384432
[21]:
# predict sources onto grid
grav_df["eqs_gravity_anomaly"] = eqs.predict(
(
grav_df.easting,
grav_df.northing,
grav_df.upward, # either grav_df.upward or user-set constant value
),
)
grav_df["gravity_anomaly"] = grav_df.eqs_gravity_anomaly
grav_df
[21]:
| northing | easting | upward | bathymetry_grav | basement_grav | disturbance | gravity_anomaly_full_res | eqs_gravity_anomaly | gravity_anomaly | |
|---|---|---|---|---|---|---|---|---|---|
| 0 | -1600000.0 | -40000.0 | 1000.0 | -35.551055 | 0 | -35.551055 | -35.551055 | -33.273917 | -33.273917 |
| 1 | -1600000.0 | -38000.0 | 1000.0 | -36.054657 | 0 | -36.054657 | -36.054657 | -33.983594 | -33.983594 |
| 2 | -1600000.0 | -36000.0 | 1000.0 | -36.473147 | 0 | -36.473147 | -36.473147 | -34.554225 | -34.554225 |
| 3 | -1600000.0 | -34000.0 | 1000.0 | -36.755609 | 0 | -36.755609 | -36.755609 | -35.014135 | -35.014135 |
| 4 | -1600000.0 | -32000.0 | 1000.0 | -36.951029 | 0 | -36.951029 | -36.951029 | -35.365702 | -35.365702 |
| ... | ... | ... | ... | ... | ... | ... | ... | ... | ... |
| 7671 | -1400000.0 | 102000.0 | 1000.0 | -25.760090 | 0 | -25.760090 | -25.760090 | -24.851786 | -24.851786 |
| 7672 | -1400000.0 | 104000.0 | 1000.0 | -25.911429 | 0 | -25.911429 | -25.911429 | -24.853220 | -24.853220 |
| 7673 | -1400000.0 | 106000.0 | 1000.0 | -26.032814 | 0 | -26.032814 | -26.032814 | -24.843369 | -24.843369 |
| 7674 | -1400000.0 | 108000.0 | 1000.0 | -26.121903 | 0 | -26.121903 | -26.121903 | -24.781222 | -24.781222 |
| 7675 | -1400000.0 | 110000.0 | 1000.0 | -26.206160 | 0 | -26.206160 | -26.206160 | -24.608107 | -24.608107 |
7676 rows × 9 columns
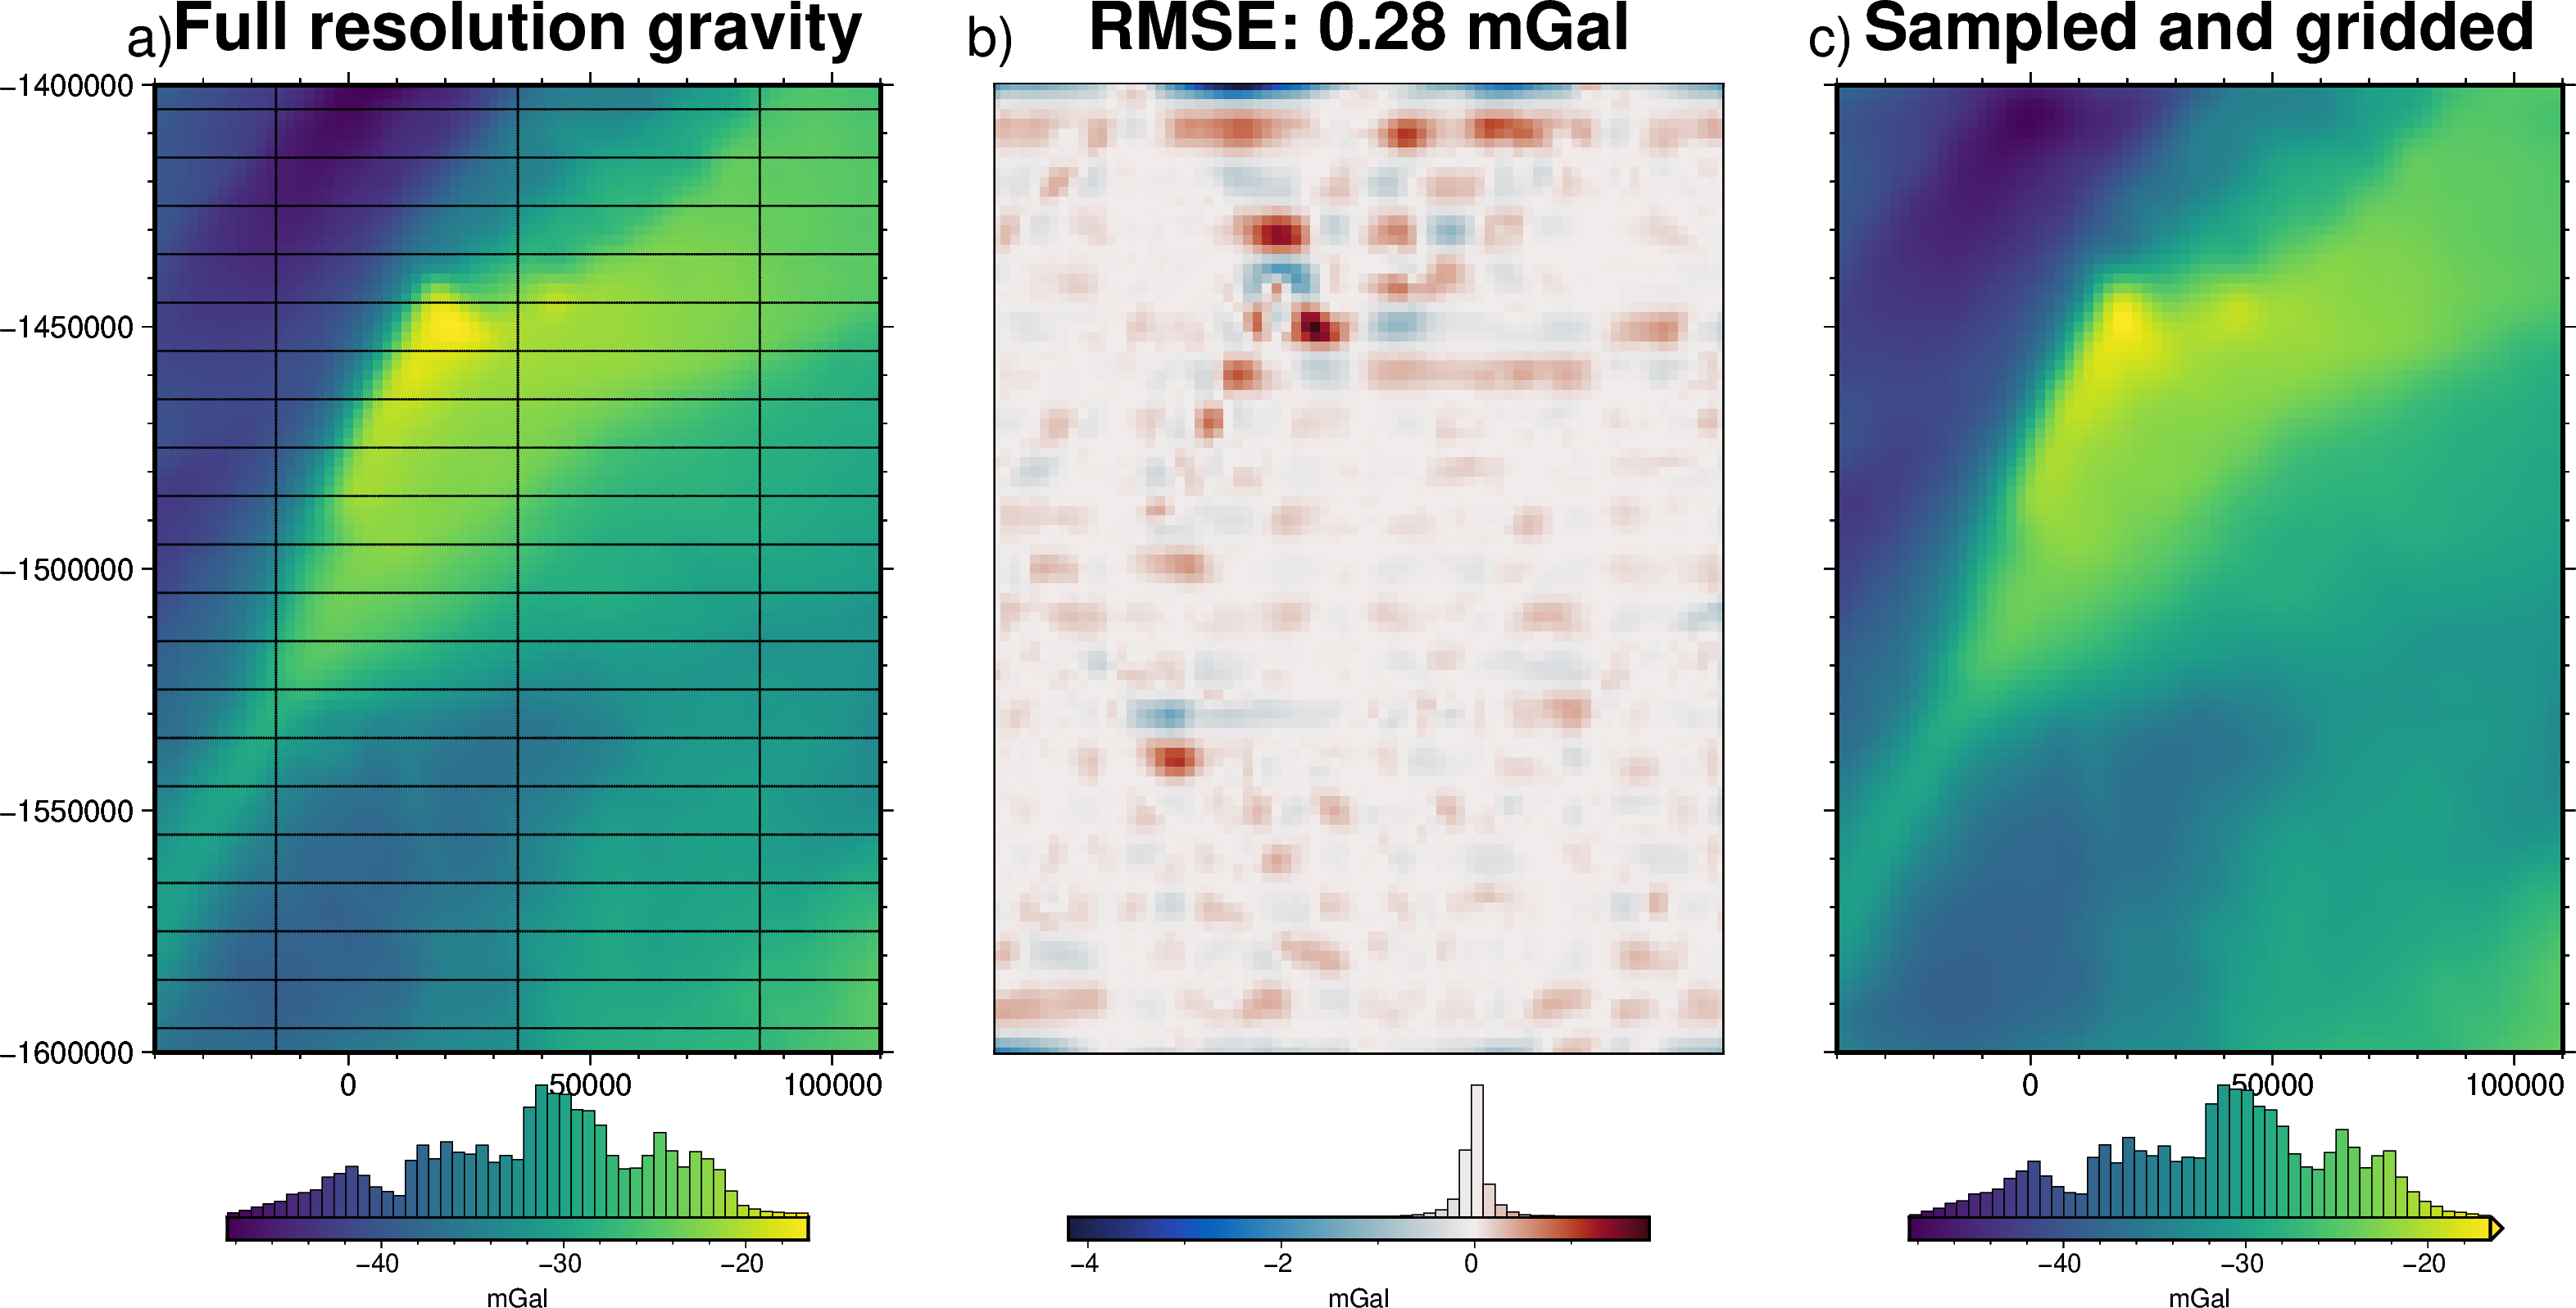
[22]:
grav_grid = grav_df.set_index(["northing", "easting"]).to_xarray()
# plot the synthetic gravity anomaly grid
lims = polar_utils.get_min_max(grav_grid.gravity_anomaly_full_res)
fig = maps.plot_grd(
grav_grid.gravity_anomaly_full_res,
fig_height=10,
cmap="viridis",
cpt_lims=lims,
title="Full resolution gravity",
cbar_label="mGal",
frame=["nSWe", "xaf10000", "yaf10000"],
hist=True,
)
# plot observation points
fig.plot(
grav_survey_df[["easting", "northing"]],
style="c.02c",
fill="black",
)
fig.text(
position="TL",
justify="BL",
text="a)",
font="16p,Helvetica,black",
offset="j-.3/.3",
no_clip=True,
)
dif = grav_grid.gravity_anomaly_full_res - grav_grid.gravity_anomaly
fig = maps.plot_grd(
dif,
fig_height=10,
cmap="balance+h0",
title=f"RMSE: {round(utils.rmse(dif), 2)} mGal",
cbar_label="mGal",
hist=True,
grd2_cpt=True,
fig=fig,
origin_shift="xshift",
xshift_amount=1.1,
)
fig.text(
position="TL",
justify="BL",
text="b)",
font="16p,Helvetica,black",
offset="j-.3/.3",
no_clip=True,
)
# plot the synthetic observed gravity grid
fig = maps.plot_grd(
grav_grid.gravity_anomaly,
fig_height=10,
cmap="viridis",
cpt_lims=lims,
title="Sampled and gridded",
cbar_label="mGal",
frame=["nSwe", "xaf10000", "yaf10000"],
hist=True,
fig=fig,
origin_shift="xshift",
xshift_amount=1.1,
)
fig.text(
position="TL",
justify="BL",
text="c)",
font="16p,Helvetica,black",
offset="j-.3/.3",
no_clip=True,
)
fig.show()
Make starting bathymetry model
[23]:
# semi-regularly spaced
constraint_points = synthetic.constraint_layout_number(
shape=(6, 7),
region=inversion_region,
padding=-spacing,
shapefile="../results/Ross_Sea/Ross_Sea_outline.shp",
add_outside_points=True,
grid_spacing=spacing,
)
# sample true topography at these points
constraint_points = utils.sample_grids(
constraint_points,
bathymetry,
"true_upward",
coord_names=("easting", "northing"),
)
constraint_points["upward"] = constraint_points.true_upward
constraint_points.head()
[23]:
| northing | easting | inside | true_upward | upward | |
|---|---|---|---|---|---|
| 0 | -1600000.0 | -40000.0 | False | -601.093994 | -601.093994 |
| 1 | -1600000.0 | -38000.0 | False | -609.216919 | -609.216919 |
| 2 | -1600000.0 | -36000.0 | False | -616.355957 | -616.355957 |
| 3 | -1600000.0 | -34000.0 | False | -621.262268 | -621.262268 |
| 4 | -1600000.0 | -32000.0 | False | -625.510925 | -625.510925 |
[24]:
# grid the sampled values using verde
starting_topography_kwargs = dict(
method="splines",
region=buffer_region,
spacing=spacing,
constraints_df=constraint_points,
dampings=None,
)
starting_bathymetry = utils.create_topography(**starting_topography_kwargs)
starting_bathymetry
[24]:
<xarray.DataArray 'scalars' (northing: 121, easting: 96)> Size: 93kB
array([[-541.24413869, -544.57181187, -547.92293689, ..., -360.00006254,
-357.06767408, -354.19957766],
[-543.34402688, -546.81675803, -550.35256333, ..., -362.90253226,
-359.96874158, -357.11431886],
[-545.05533622, -548.66036838, -552.37518163, ..., -365.66137905,
-362.73269531, -359.90052824],
...,
[-591.95335283, -595.518822 , -599.06869705, ..., -440.89315875,
-440.6944619 , -440.40553782],
[-590.53134833, -594.09076637, -597.64079288, ..., -440.69158328,
-440.42525249, -440.07197234],
[-589.16632671, -592.73504777, -596.30209679, ..., -440.51760947,
-440.1713932 , -439.74434037]], shape=(121, 96))
Coordinates:
* northing (northing) float64 968B -1.62e+06 -1.618e+06 ... -1.38e+06
* easting (easting) float64 768B -6e+04 -5.8e+04 ... 1.28e+05 1.3e+05
Attributes:
metadata: Generated by SplineCV(cv=KFold(n_splits=5, random_state=0, shu...
damping: None[25]:
# sample the inverted topography at the constraint points
constraint_points = utils.sample_grids(
constraint_points,
starting_bathymetry,
"starting_bathymetry",
coord_names=("easting", "northing"),
)
rmse = utils.rmse(constraint_points.upward - constraint_points.starting_bathymetry)
print(f"RMSE: {rmse:.2f} m")
RMSE: 0.03 m
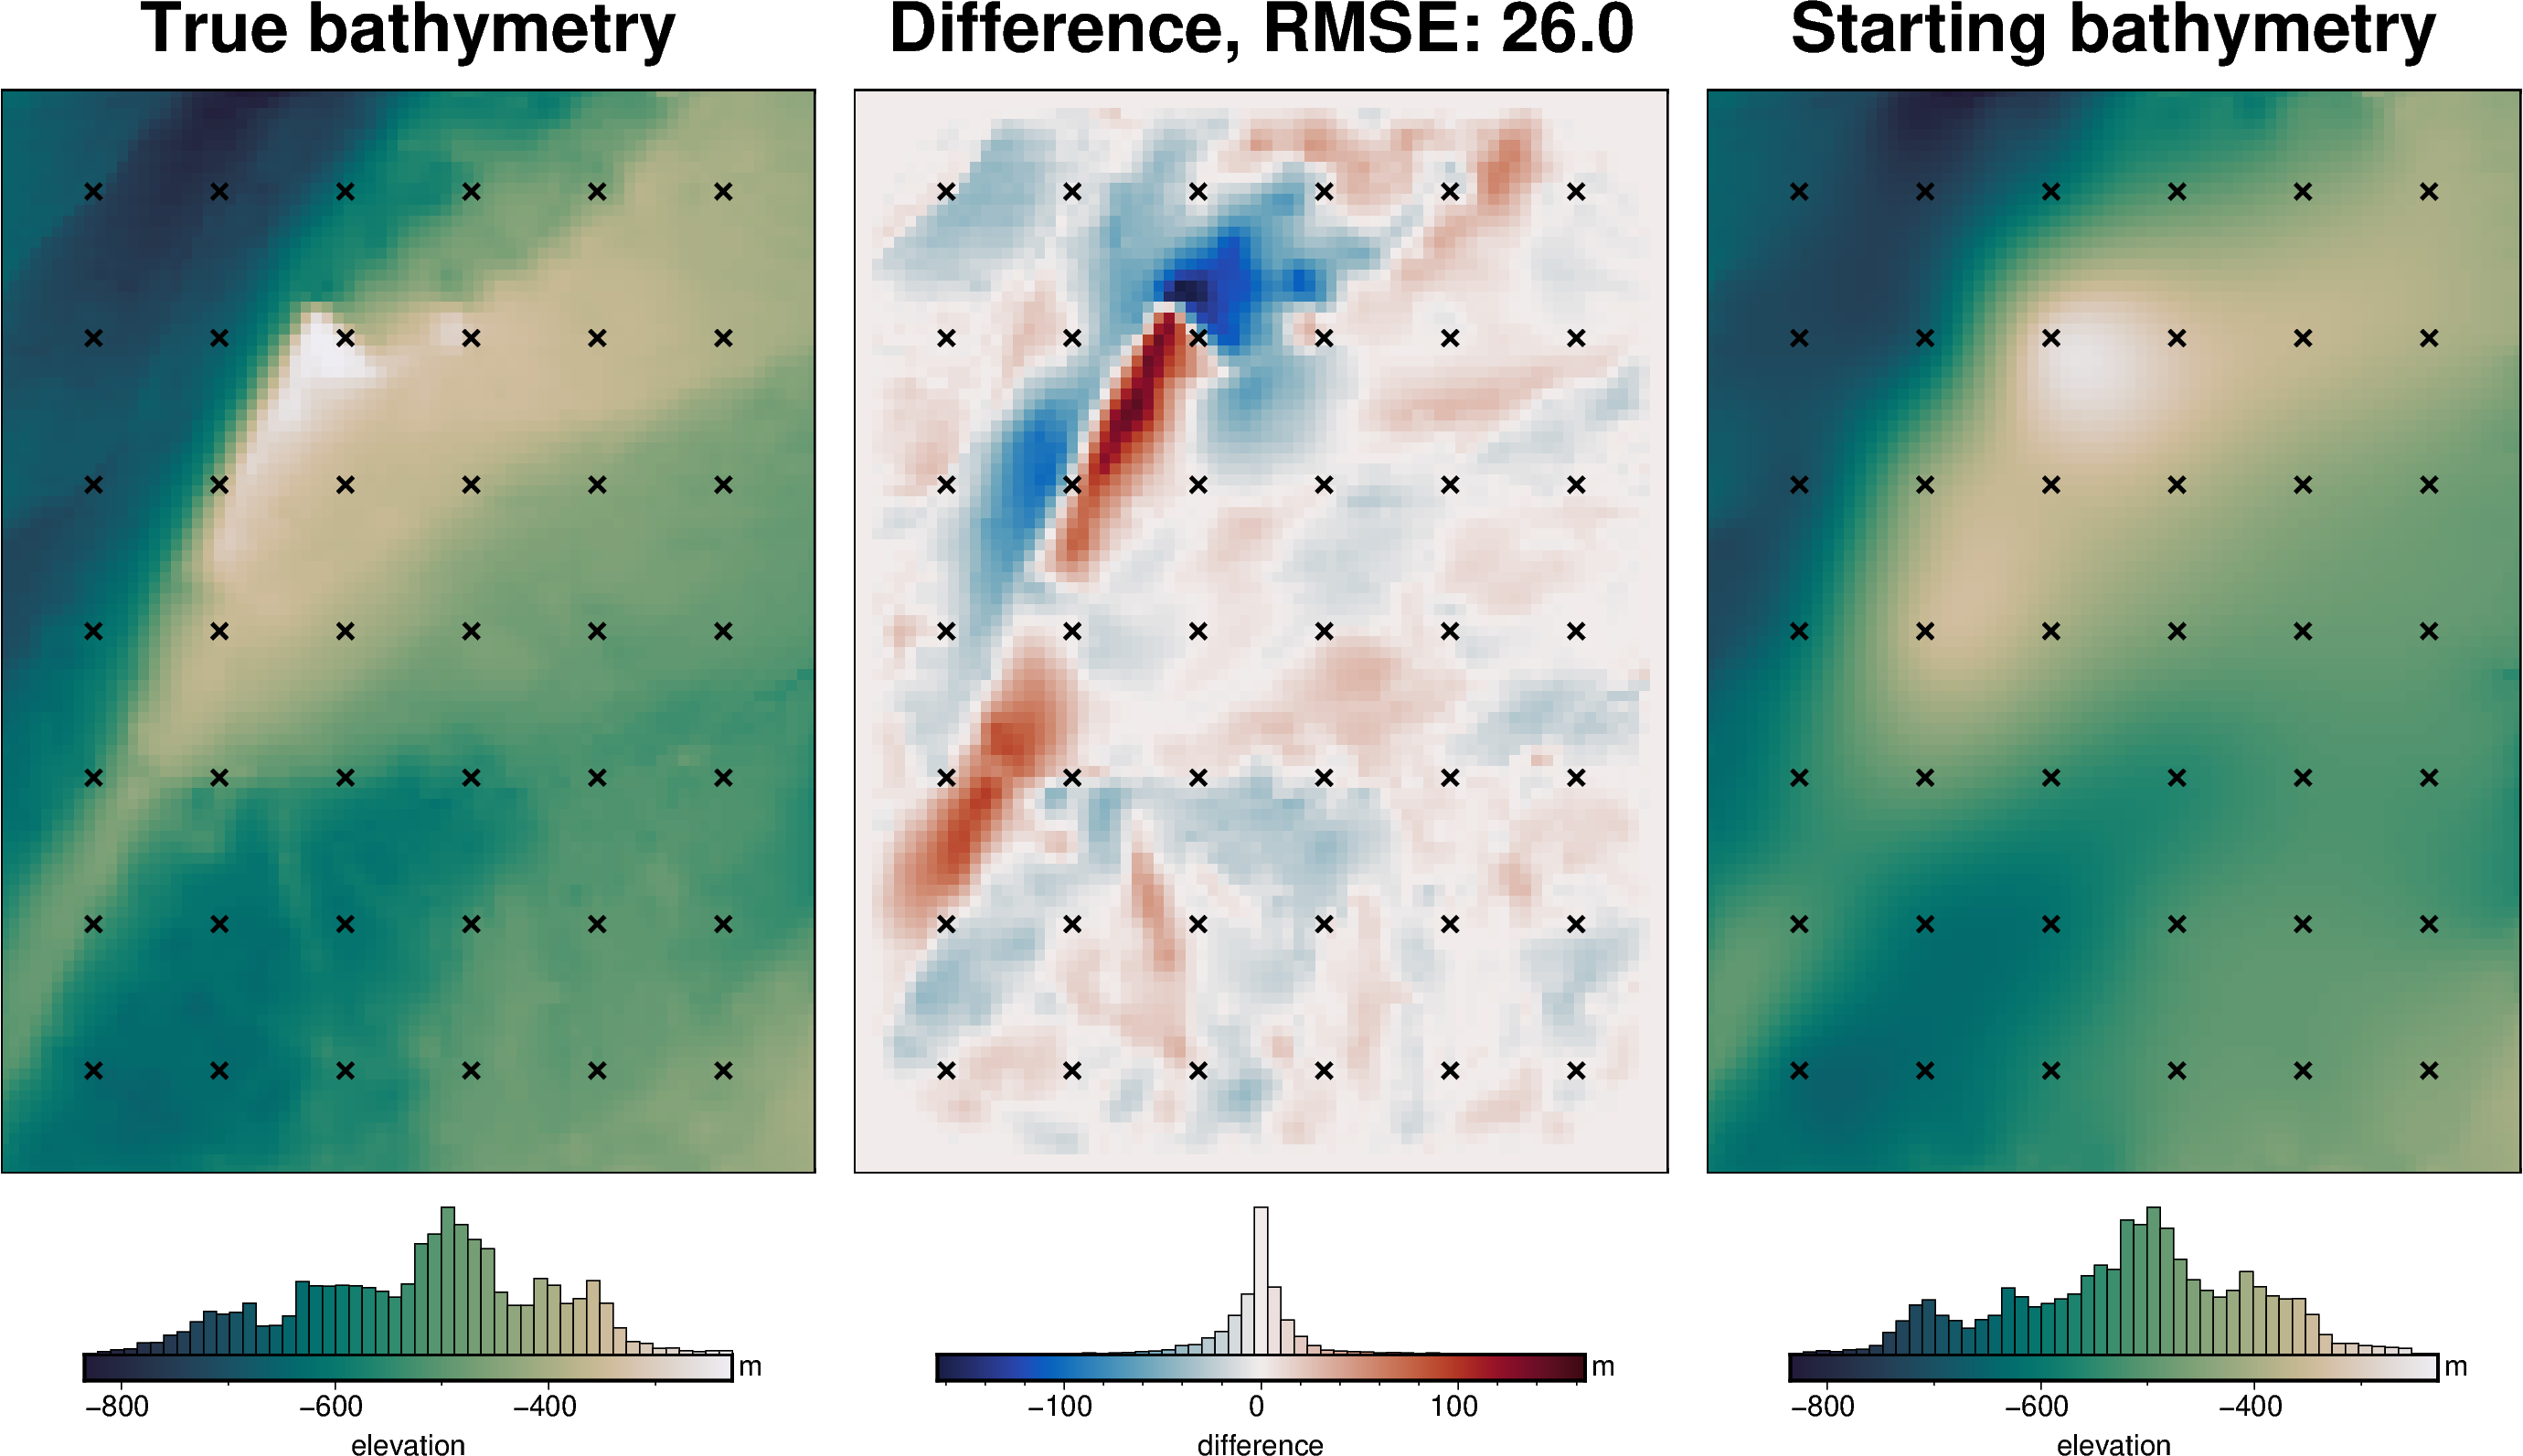
[26]:
# compare starting and actual bathymetry grids
grids = polar_utils.grd_compare(
bathymetry,
starting_bathymetry,
fig_height=10,
plot=True,
cmap="rain",
reverse_cpt=True,
diff_cmap="balance+h0",
grid1_name="True bathymetry",
grid2_name="Starting bathymetry",
title="Difference",
title_font="18p,Helvetica-Bold,black",
cbar_unit="m",
cbar_label="elevation",
RMSE_decimals=0,
region=inversion_region,
inset=False,
hist=True,
label_font="16p,Helvetica,black",
points=constraint_points[constraint_points.inside],
points_style="x.2c",
)
[27]:
# the true density contrast is 1476 kg/m3
density_contrast = 1350
# set the reference level from the prisms to 0
zref = 0
density_grid = xr.where(
starting_bathymetry >= zref,
density_contrast,
-density_contrast,
)
# create layer of prisms
starting_prisms = utils.grids_to_prisms(
starting_bathymetry,
zref,
density=density_grid,
)
grav_df["starting_gravity"] = starting_prisms.prism_layer.gravity(
coordinates=(
grav_df.easting,
grav_df.northing,
grav_df.upward,
),
field="g_z",
progressbar=True,
)
grav_df
[27]:
| northing | easting | upward | bathymetry_grav | basement_grav | disturbance | gravity_anomaly_full_res | eqs_gravity_anomaly | gravity_anomaly | starting_gravity | |
|---|---|---|---|---|---|---|---|---|---|---|
| 0 | -1600000.0 | -40000.0 | 1000.0 | -35.551055 | 0 | -35.551055 | -35.551055 | -33.273917 | -33.273917 | -32.541367 |
| 1 | -1600000.0 | -38000.0 | 1000.0 | -36.054657 | 0 | -36.054657 | -36.054657 | -33.983594 | -33.983594 | -32.965831 |
| 2 | -1600000.0 | -36000.0 | 1000.0 | -36.473147 | 0 | -36.473147 | -36.473147 | -34.554225 | -34.554225 | -33.347648 |
| 3 | -1600000.0 | -34000.0 | 1000.0 | -36.755609 | 0 | -36.755609 | -36.755609 | -35.014135 | -35.014135 | -33.644496 |
| 4 | -1600000.0 | -32000.0 | 1000.0 | -36.951029 | 0 | -36.951029 | -36.951029 | -35.365702 | -35.365702 | -33.840063 |
| ... | ... | ... | ... | ... | ... | ... | ... | ... | ... | ... |
| 7671 | -1400000.0 | 102000.0 | 1000.0 | -25.760090 | 0 | -25.760090 | -25.760090 | -24.851786 | -24.851786 | -23.321506 |
| 7672 | -1400000.0 | 104000.0 | 1000.0 | -25.911429 | 0 | -25.911429 | -25.911429 | -24.853220 | -24.853220 | -23.482116 |
| 7673 | -1400000.0 | 106000.0 | 1000.0 | -26.032814 | 0 | -26.032814 | -26.032814 | -24.843369 | -24.843369 | -23.605602 |
| 7674 | -1400000.0 | 108000.0 | 1000.0 | -26.121903 | 0 | -26.121903 | -26.121903 | -24.781222 | -24.781222 | -23.693171 |
| 7675 | -1400000.0 | 110000.0 | 1000.0 | -26.206160 | 0 | -26.206160 | -26.206160 | -24.608107 | -24.608107 | -23.763780 |
7676 rows × 10 columns
[28]:
regional_grav_kwargs = dict(
method="constant",
constraints_df=constraint_points,
)
[29]:
grav_df = regional.regional_separation(
grav_df=grav_df,
**regional_grav_kwargs,
)
grav_df
[29]:
| northing | easting | upward | bathymetry_grav | basement_grav | disturbance | gravity_anomaly_full_res | eqs_gravity_anomaly | gravity_anomaly | starting_gravity | misfit | reg | res | |
|---|---|---|---|---|---|---|---|---|---|---|---|---|---|
| 0 | -1600000.0 | -40000.0 | 1000.0 | -35.551055 | 0 | -35.551055 | -35.551055 | -33.273917 | -33.273917 | -32.541367 | -0.732550 | -2.646595 | 1.914045 |
| 1 | -1600000.0 | -38000.0 | 1000.0 | -36.054657 | 0 | -36.054657 | -36.054657 | -33.983594 | -33.983594 | -32.965831 | -1.017764 | -2.646595 | 1.628831 |
| 2 | -1600000.0 | -36000.0 | 1000.0 | -36.473147 | 0 | -36.473147 | -36.473147 | -34.554225 | -34.554225 | -33.347648 | -1.206577 | -2.646595 | 1.440018 |
| 3 | -1600000.0 | -34000.0 | 1000.0 | -36.755609 | 0 | -36.755609 | -36.755609 | -35.014135 | -35.014135 | -33.644496 | -1.369640 | -2.646595 | 1.276955 |
| 4 | -1600000.0 | -32000.0 | 1000.0 | -36.951029 | 0 | -36.951029 | -36.951029 | -35.365702 | -35.365702 | -33.840063 | -1.525639 | -2.646595 | 1.120956 |
| ... | ... | ... | ... | ... | ... | ... | ... | ... | ... | ... | ... | ... | ... |
| 7671 | -1400000.0 | 102000.0 | 1000.0 | -25.760090 | 0 | -25.760090 | -25.760090 | -24.851786 | -24.851786 | -23.321506 | -1.530281 | -2.646595 | 1.116314 |
| 7672 | -1400000.0 | 104000.0 | 1000.0 | -25.911429 | 0 | -25.911429 | -25.911429 | -24.853220 | -24.853220 | -23.482116 | -1.371105 | -2.646595 | 1.275490 |
| 7673 | -1400000.0 | 106000.0 | 1000.0 | -26.032814 | 0 | -26.032814 | -26.032814 | -24.843369 | -24.843369 | -23.605602 | -1.237767 | -2.646595 | 1.408828 |
| 7674 | -1400000.0 | 108000.0 | 1000.0 | -26.121903 | 0 | -26.121903 | -26.121903 | -24.781222 | -24.781222 | -23.693171 | -1.088052 | -2.646595 | 1.558543 |
| 7675 | -1400000.0 | 110000.0 | 1000.0 | -26.206160 | 0 | -26.206160 | -26.206160 | -24.608107 | -24.608107 | -23.763780 | -0.844328 | -2.646595 | 1.802267 |
7676 rows × 13 columns
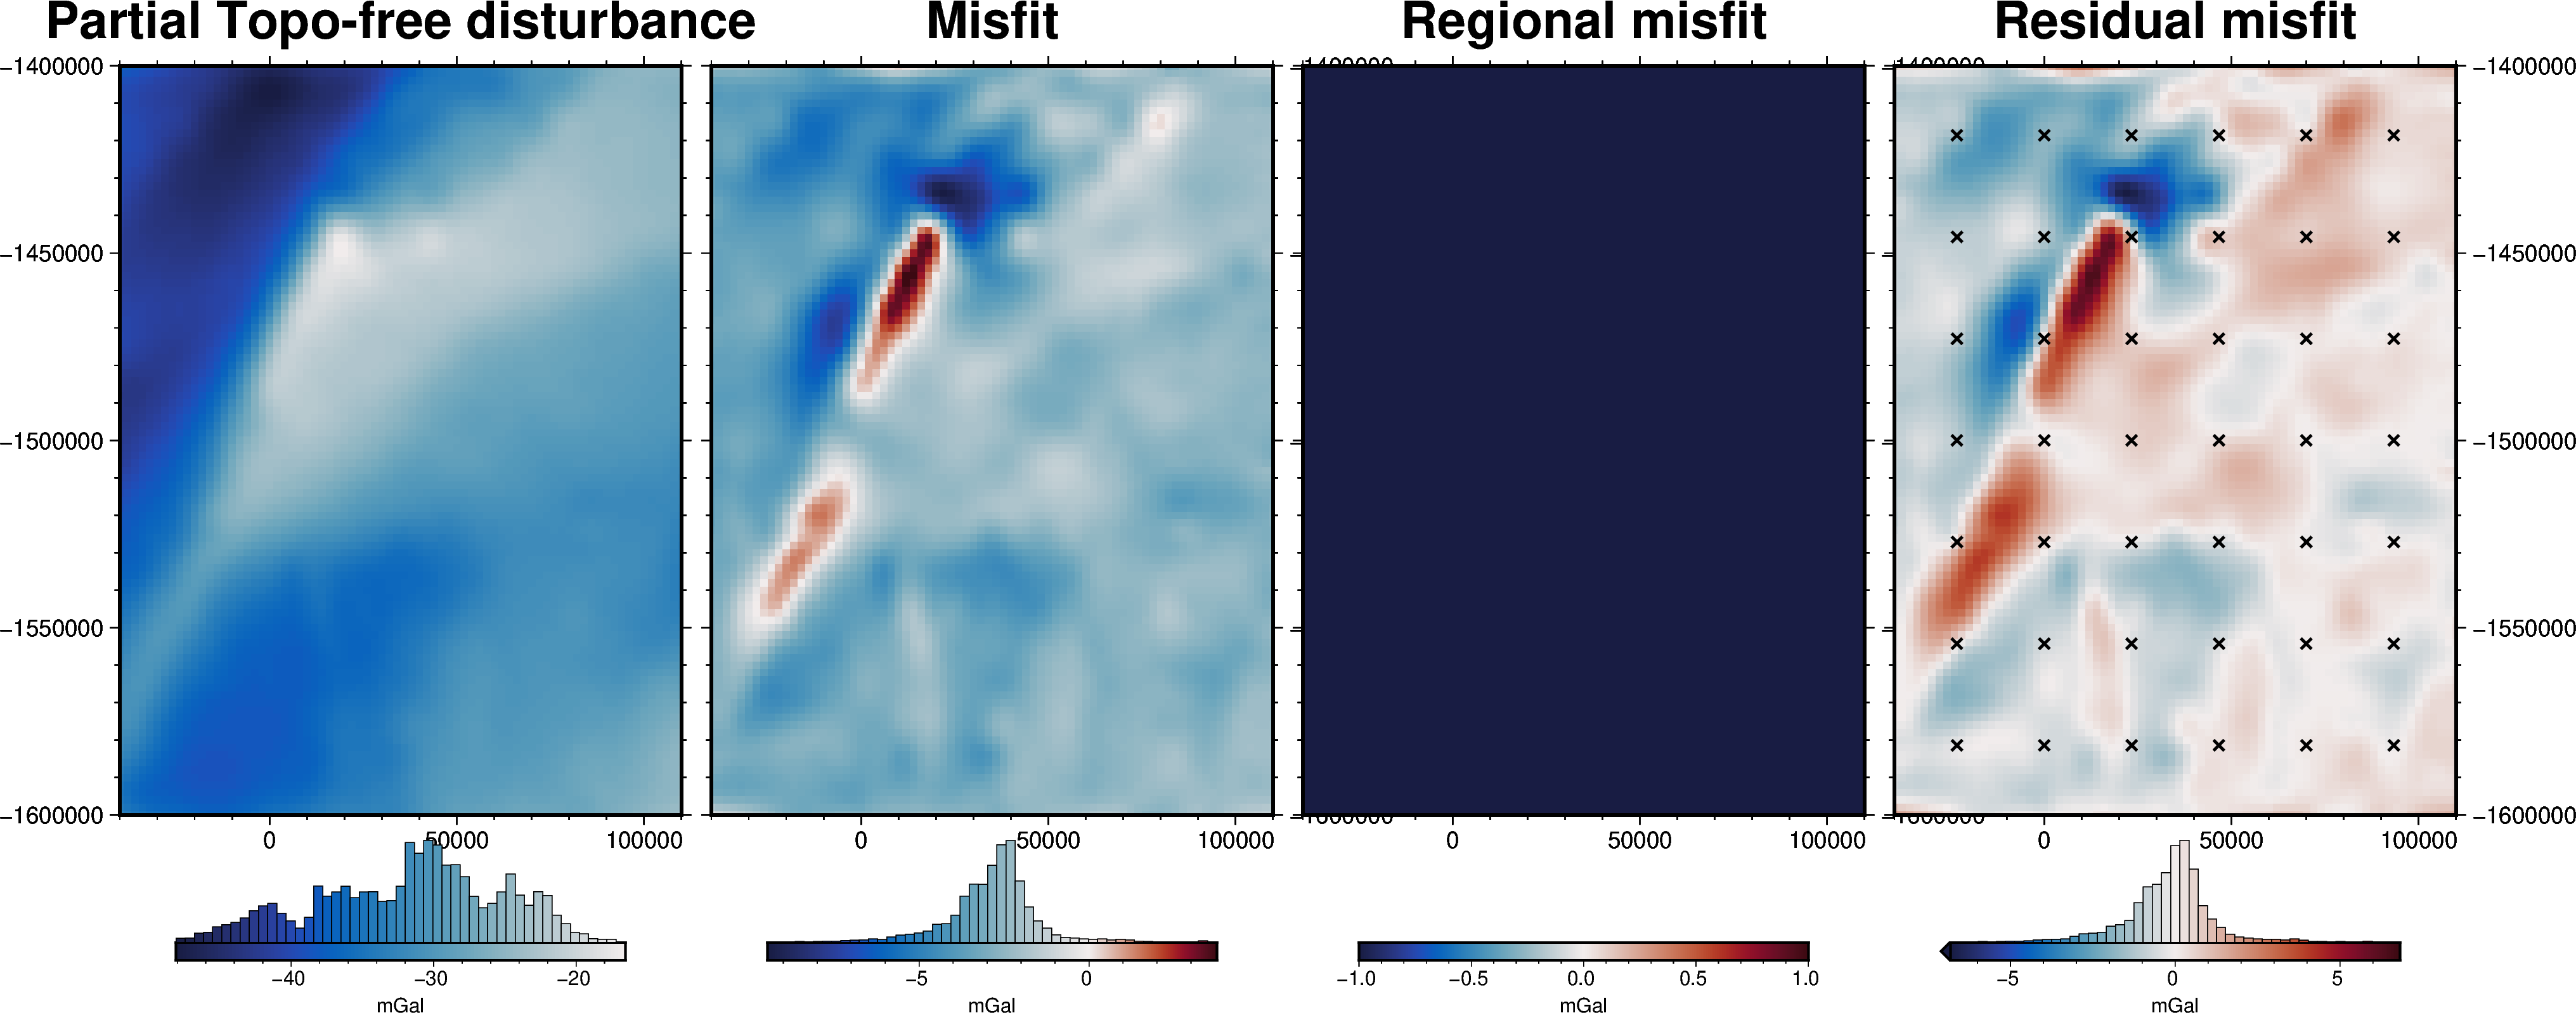
[30]:
grav_grid = grav_df.set_index(["northing", "easting"]).to_xarray()
fig = maps.plot_grd(
grav_grid.gravity_anomaly,
region=inversion_region,
fig_height=10,
title="Partial Topo-free disturbance",
cmap="balance+h0",
hist=True,
cbar_label="mGal",
frame=["nSWe", "xaf10000", "yaf10000"],
)
fig = maps.plot_grd(
grav_grid.misfit,
region=inversion_region,
fig=fig,
origin_shift="xshift",
fig_height=10,
title="Misfit",
cmap="balance+h0",
hist=True,
cbar_label="mGal",
frame=["nSwE", "xaf10000", "yaf10000"],
)
fig = maps.plot_grd(
grav_grid.reg,
region=inversion_region,
fig=fig,
origin_shift="xshift",
fig_height=10,
title="Regional misfit",
cmap="balance+h0",
hist=True,
cbar_label="mGal",
frame=["nSwE", "xaf10000", "yaf10000"],
)
fig = maps.plot_grd(
grav_grid.res,
region=inversion_region,
fig=fig,
origin_shift="xshift",
fig_height=10,
title="Residual misfit",
cmap="balance+h0",
cpt_lims=[-vd.maxabs(grav_grid.res), vd.maxabs(grav_grid.res)],
hist=True,
cbar_label="mGal",
frame=["nSwE", "xaf10000", "yaf10000"],
points=constraint_points[constraint_points.inside],
points_style="x.2c",
)
fig.show()
makecpt [ERROR]: Option T: min >= max
supplied min value is greater or equal to max value
Grid/points are a constant value, can't make a colorbar histogram!
[31]:
# set kwargs to pass to the inversion
kwargs = {
# set stopping criteria
"max_iterations": 200,
"l2_norm_tolerance": 0.2**0.5, # square root of the gravity noise
"delta_l2_norm_tolerance": 1.008,
}
Damping Cross Validation
[32]:
logging.getLogger().setLevel(logging.INFO)
# run the inversion workflow, including a cross validation for the damping parameter
results = inversion.run_inversion_workflow(
grav_df=grav_df,
starting_prisms=starting_prisms,
# for creating test/train splits
grav_spacing=spacing,
inversion_region=inversion_region,
run_damping_cv=True,
damping_limits=(0.001, 0.1),
damping_cv_trials=8,
fname=f"{fpath}_damping_cv",
**kwargs,
)
[33]:
# load saved inversion results
with pathlib.Path(f"{fpath}_damping_cv_results.pickle").open("rb") as f:
results = pickle.load(f)
# load study
with pathlib.Path(f"{fpath}_damping_cv_damping_cv_study.pickle").open("rb") as f:
study = pickle.load(f)
# collect the results
topo_results, grav_results, parameters, elapsed_time = results
[34]:
best_damping = parameters.get("Solver damping")
kwargs["solver_damping"] = best_damping
best_damping
[34]:
0.014177009401440639
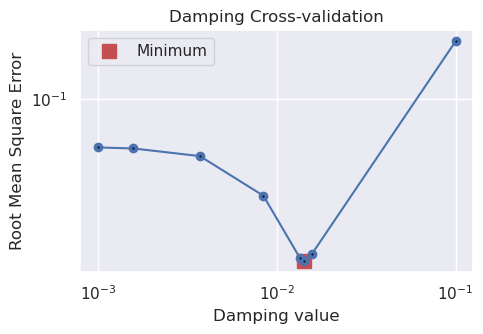
[35]:
study_df = study.trials_dataframe()
plotting.plot_cv_scores(
study_df.value,
study_df.params_damping,
param_name="Damping",
logx=True,
logy=True,
)
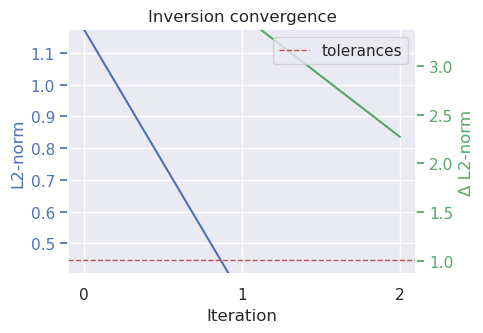
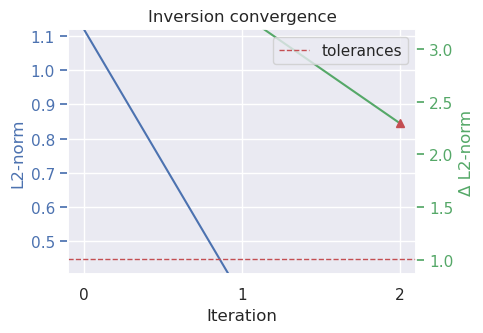
plotting.plot_convergence(
grav_results,
params=parameters,
)
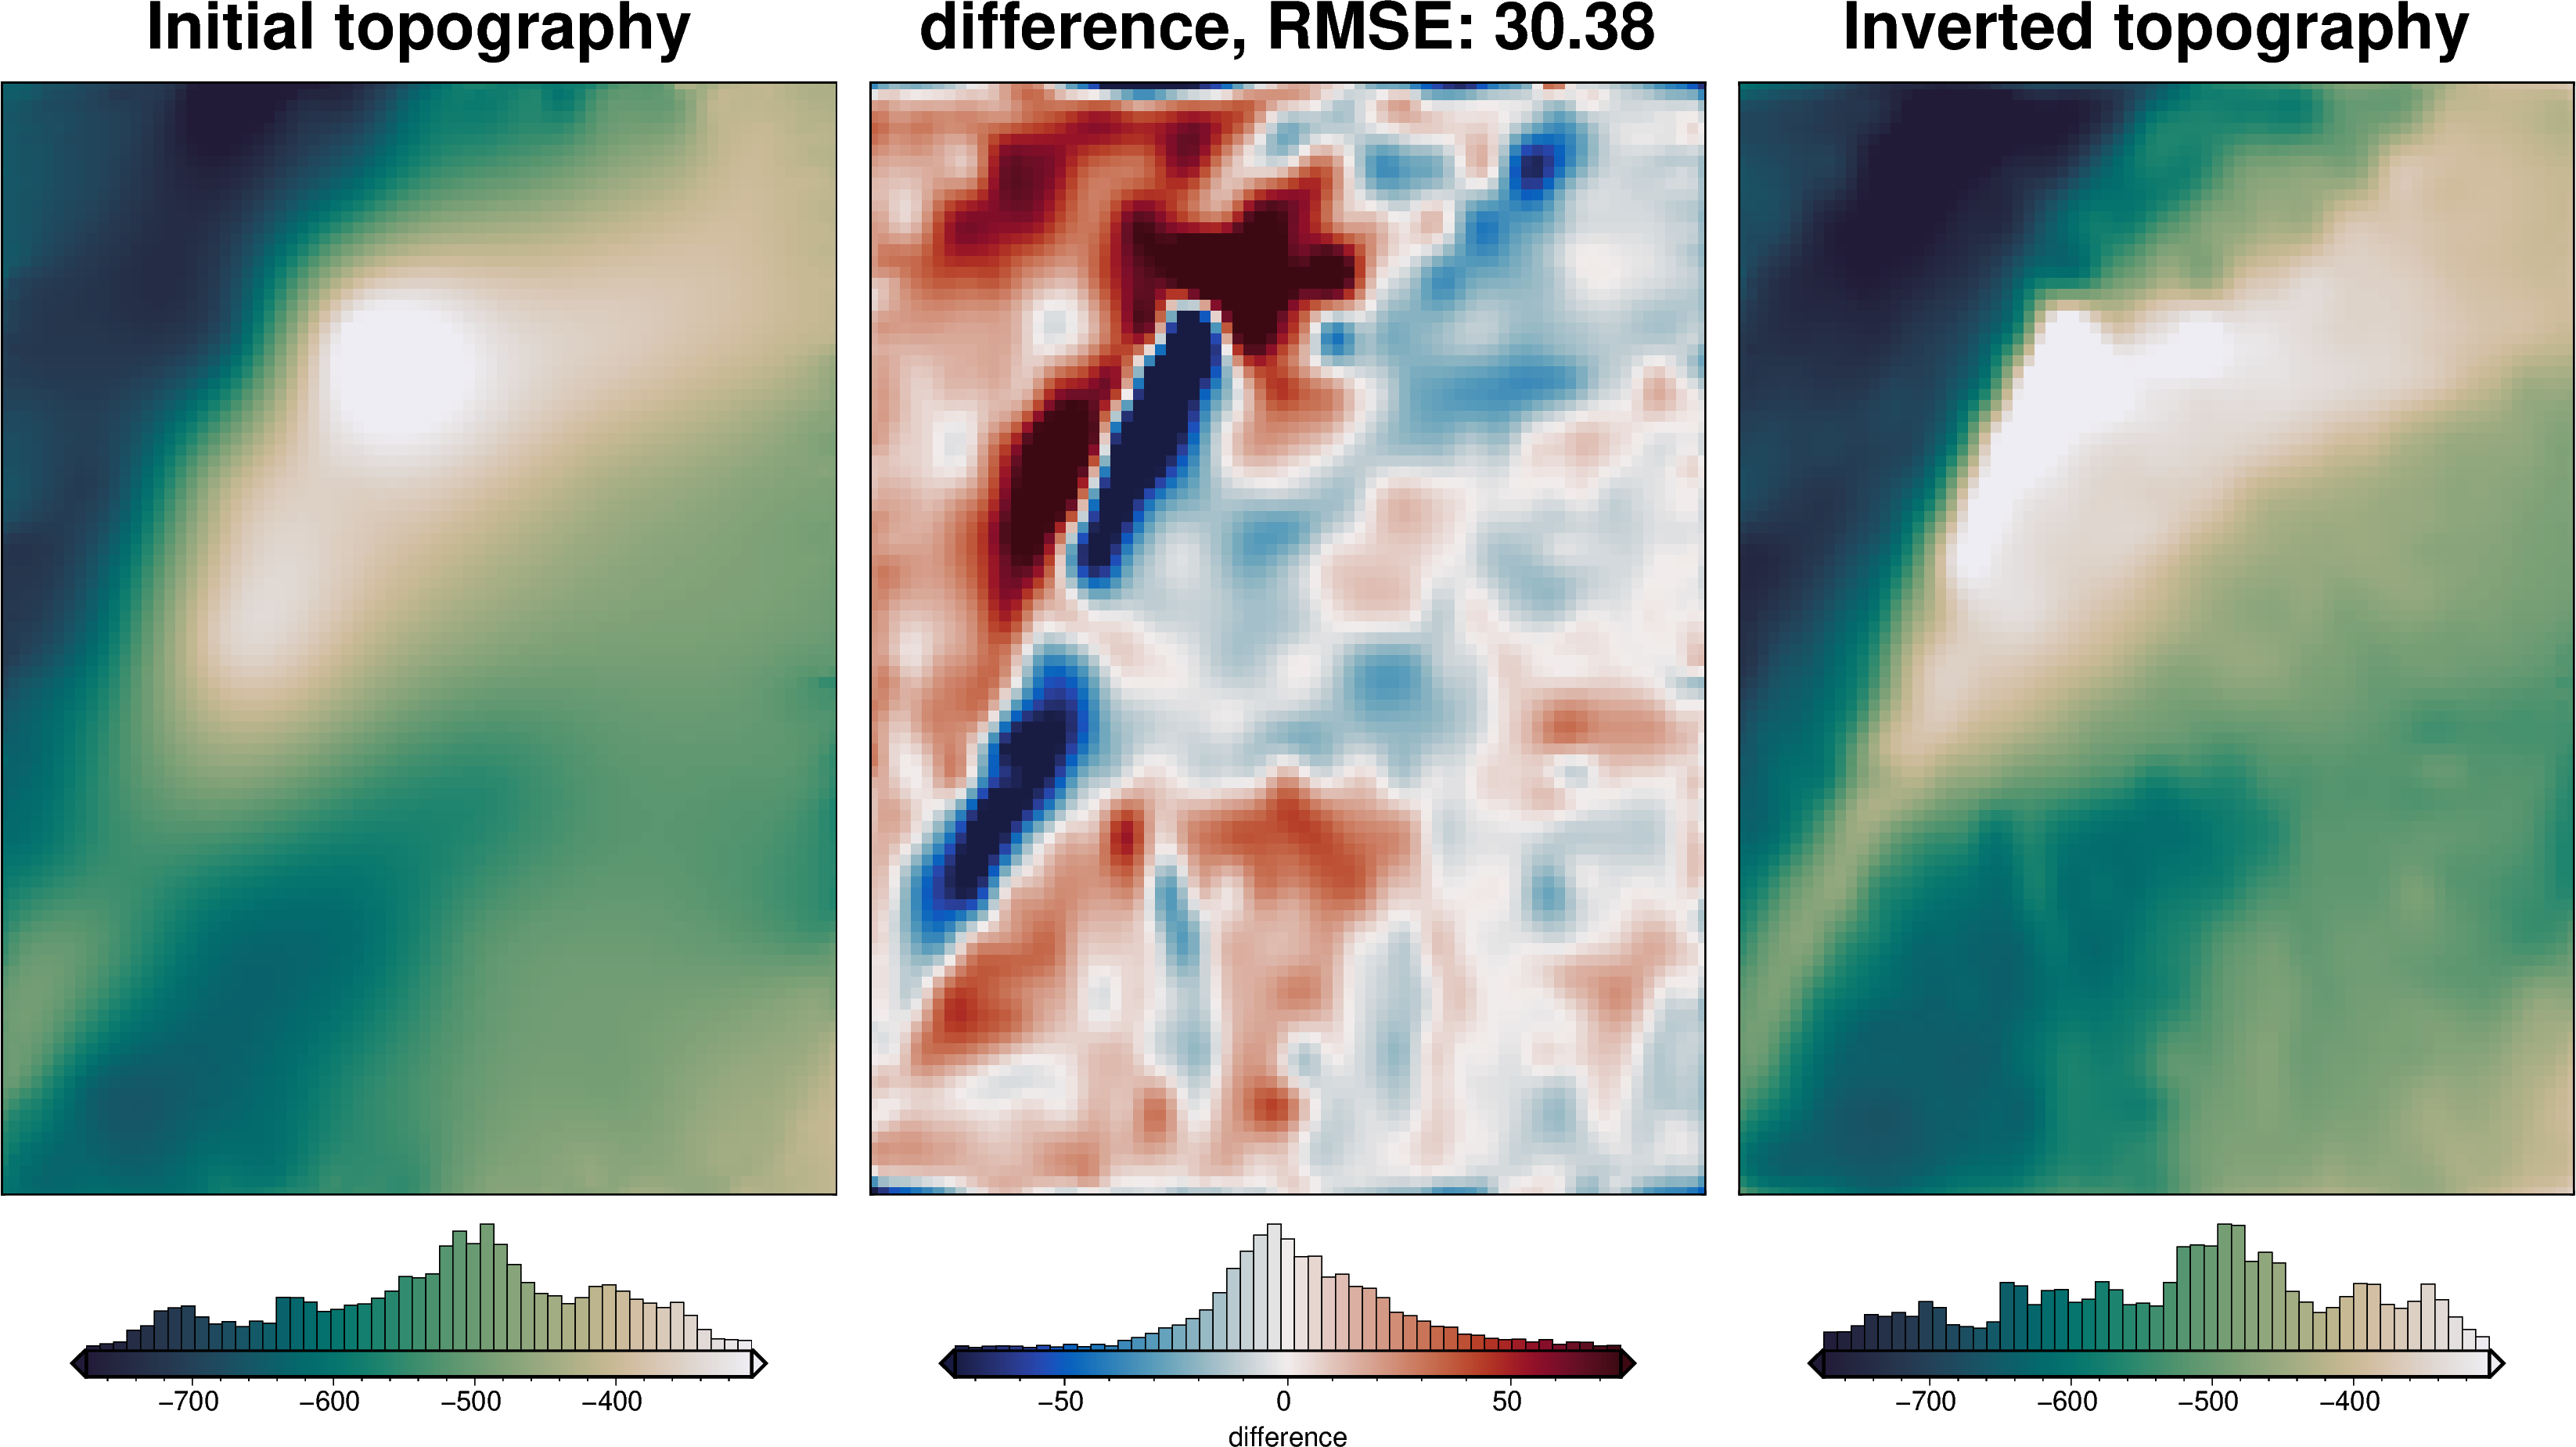
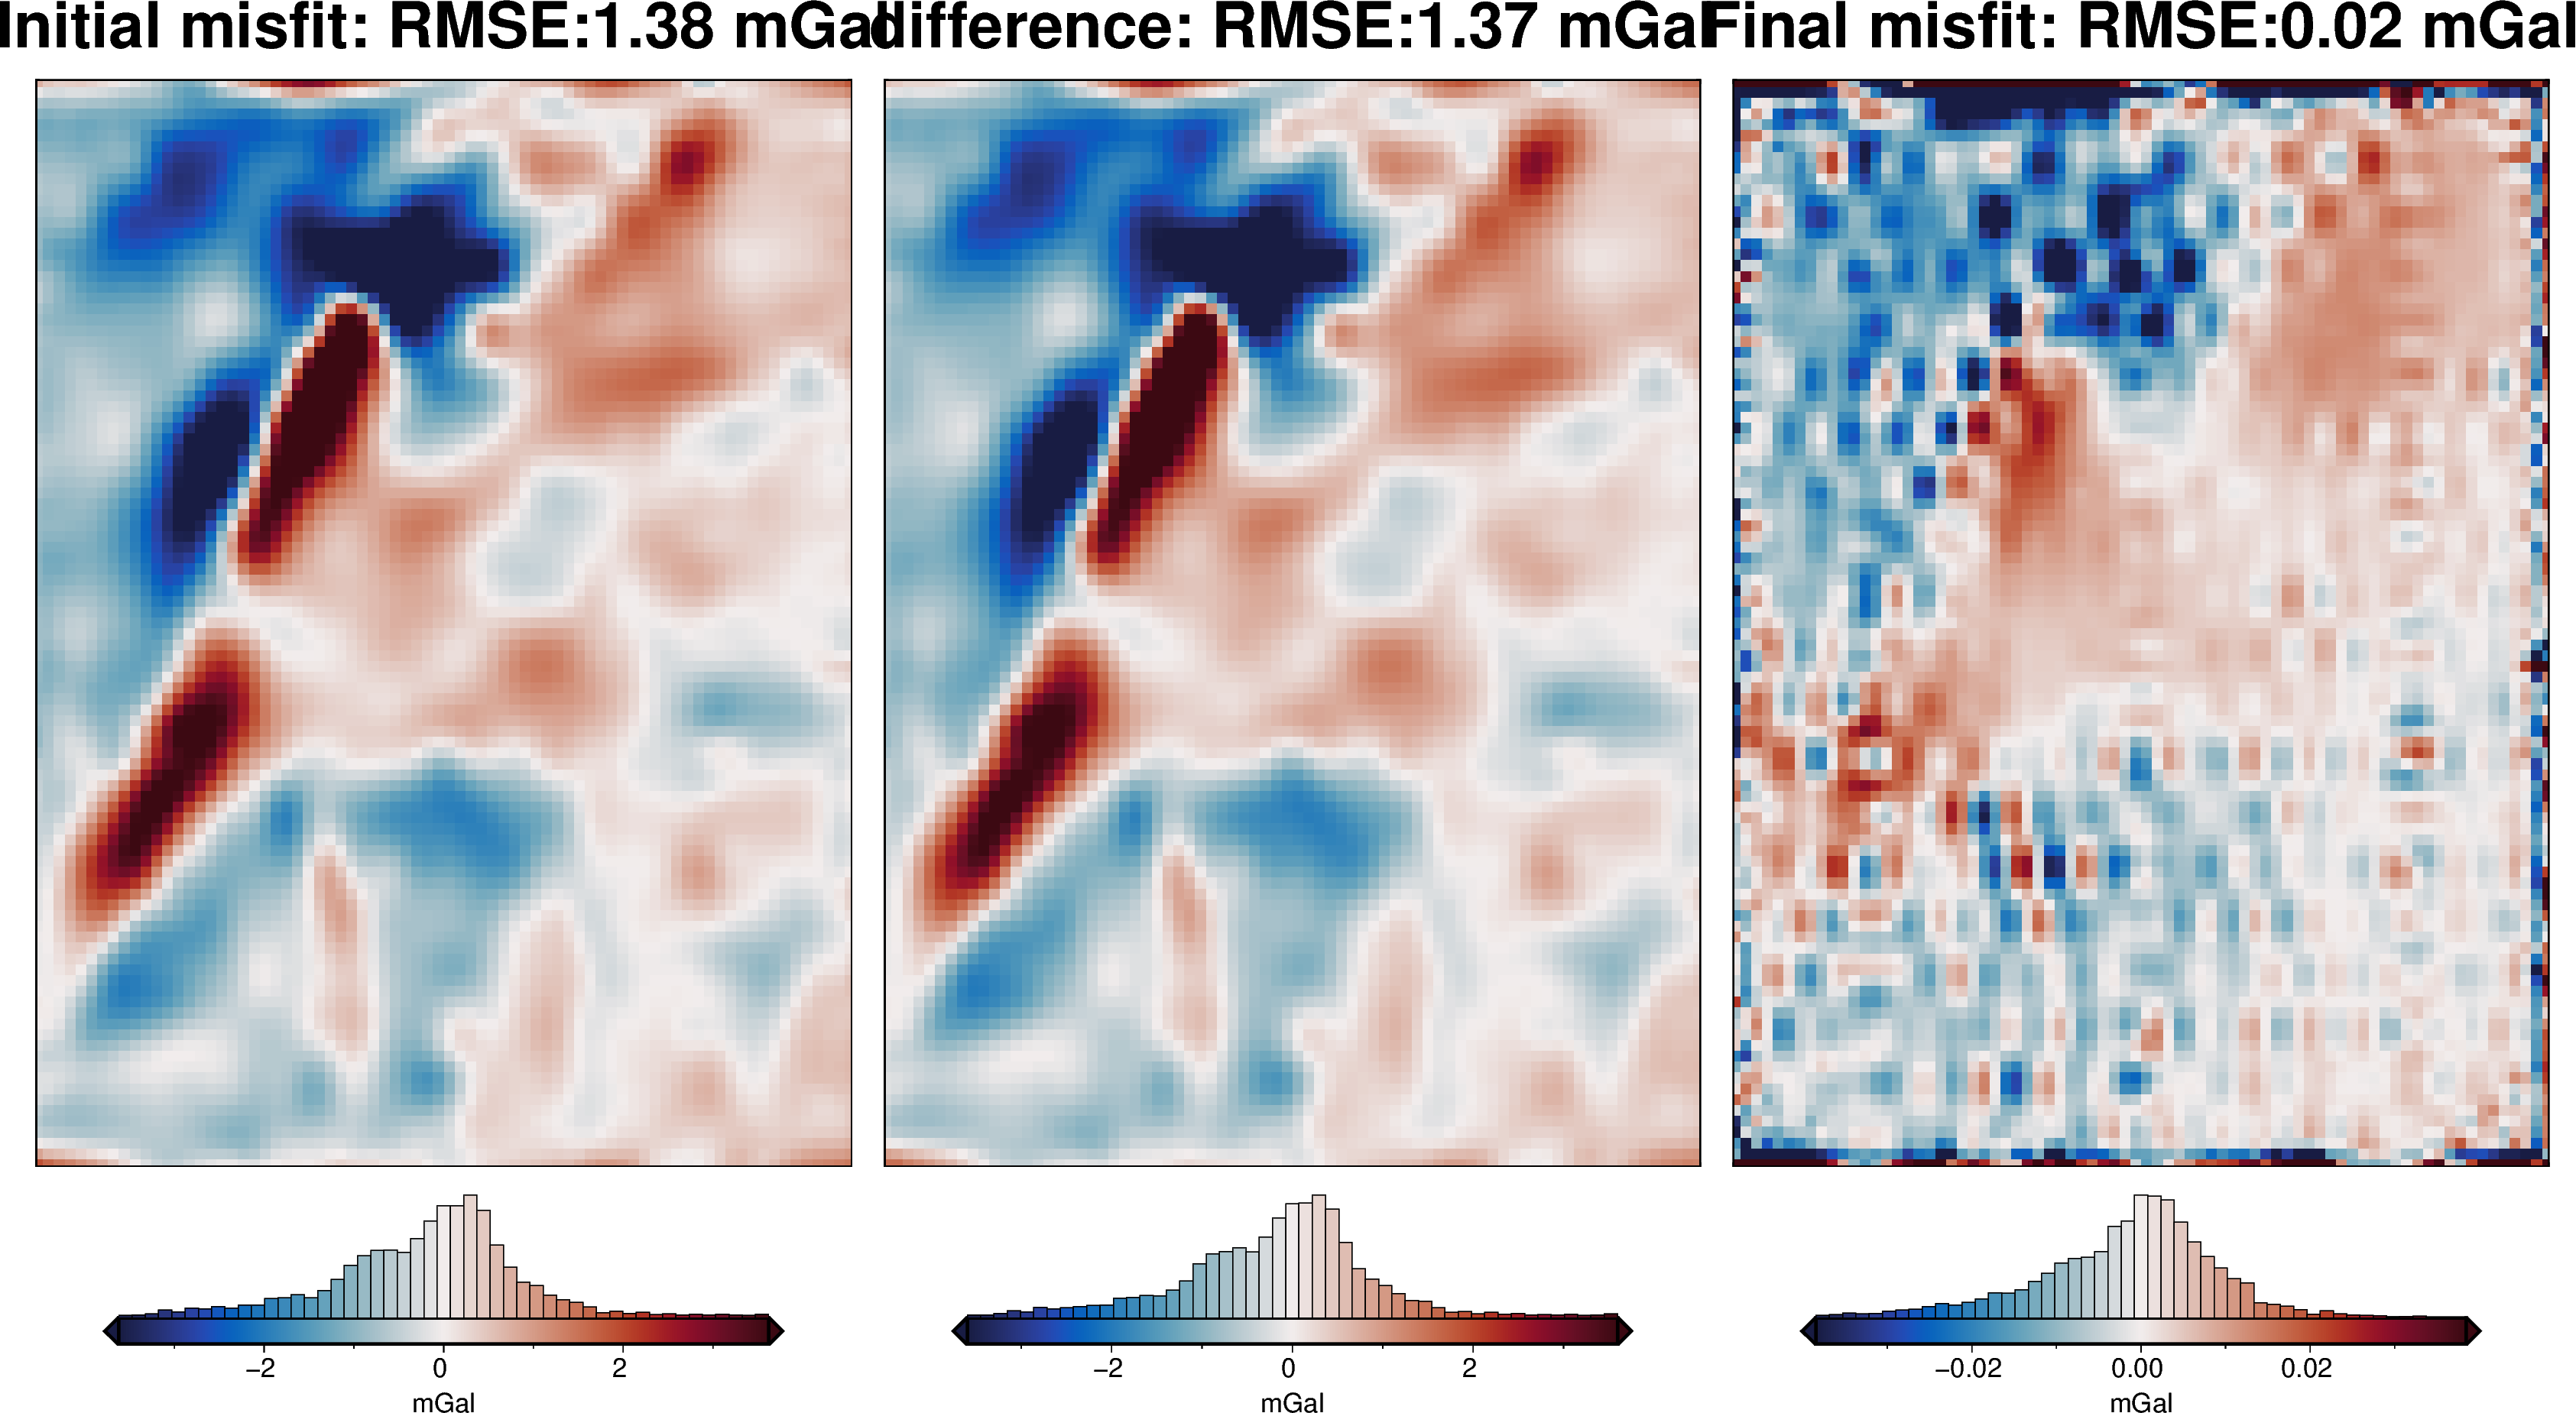
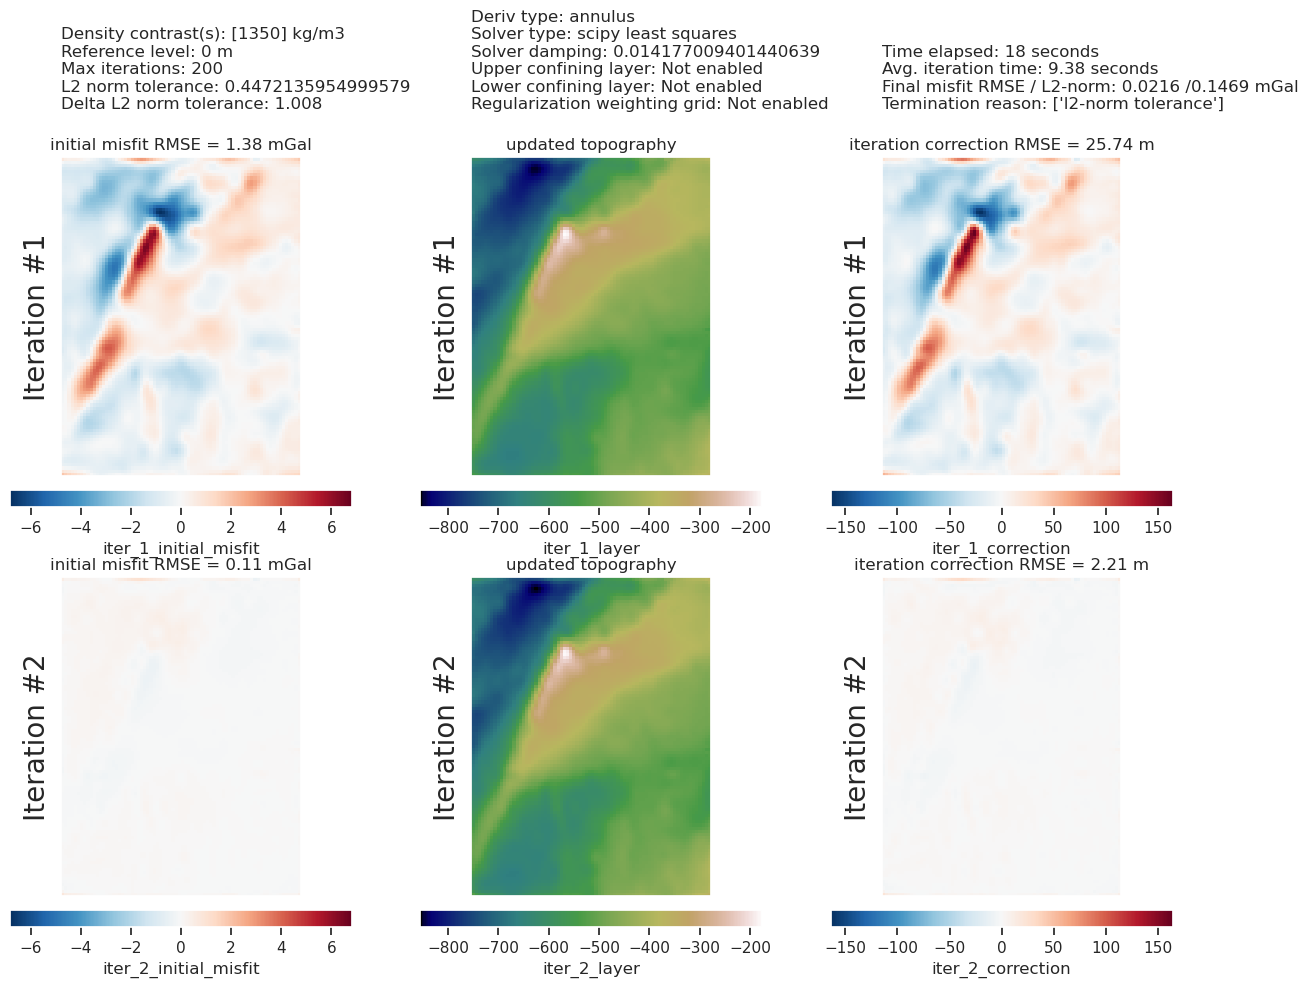
plotting.plot_inversion_results(
grav_results,
topo_results,
parameters,
inversion_region,
iters_to_plot=2,
plot_iter_results=True,
plot_topo_results=True,
plot_grav_results=True,
)
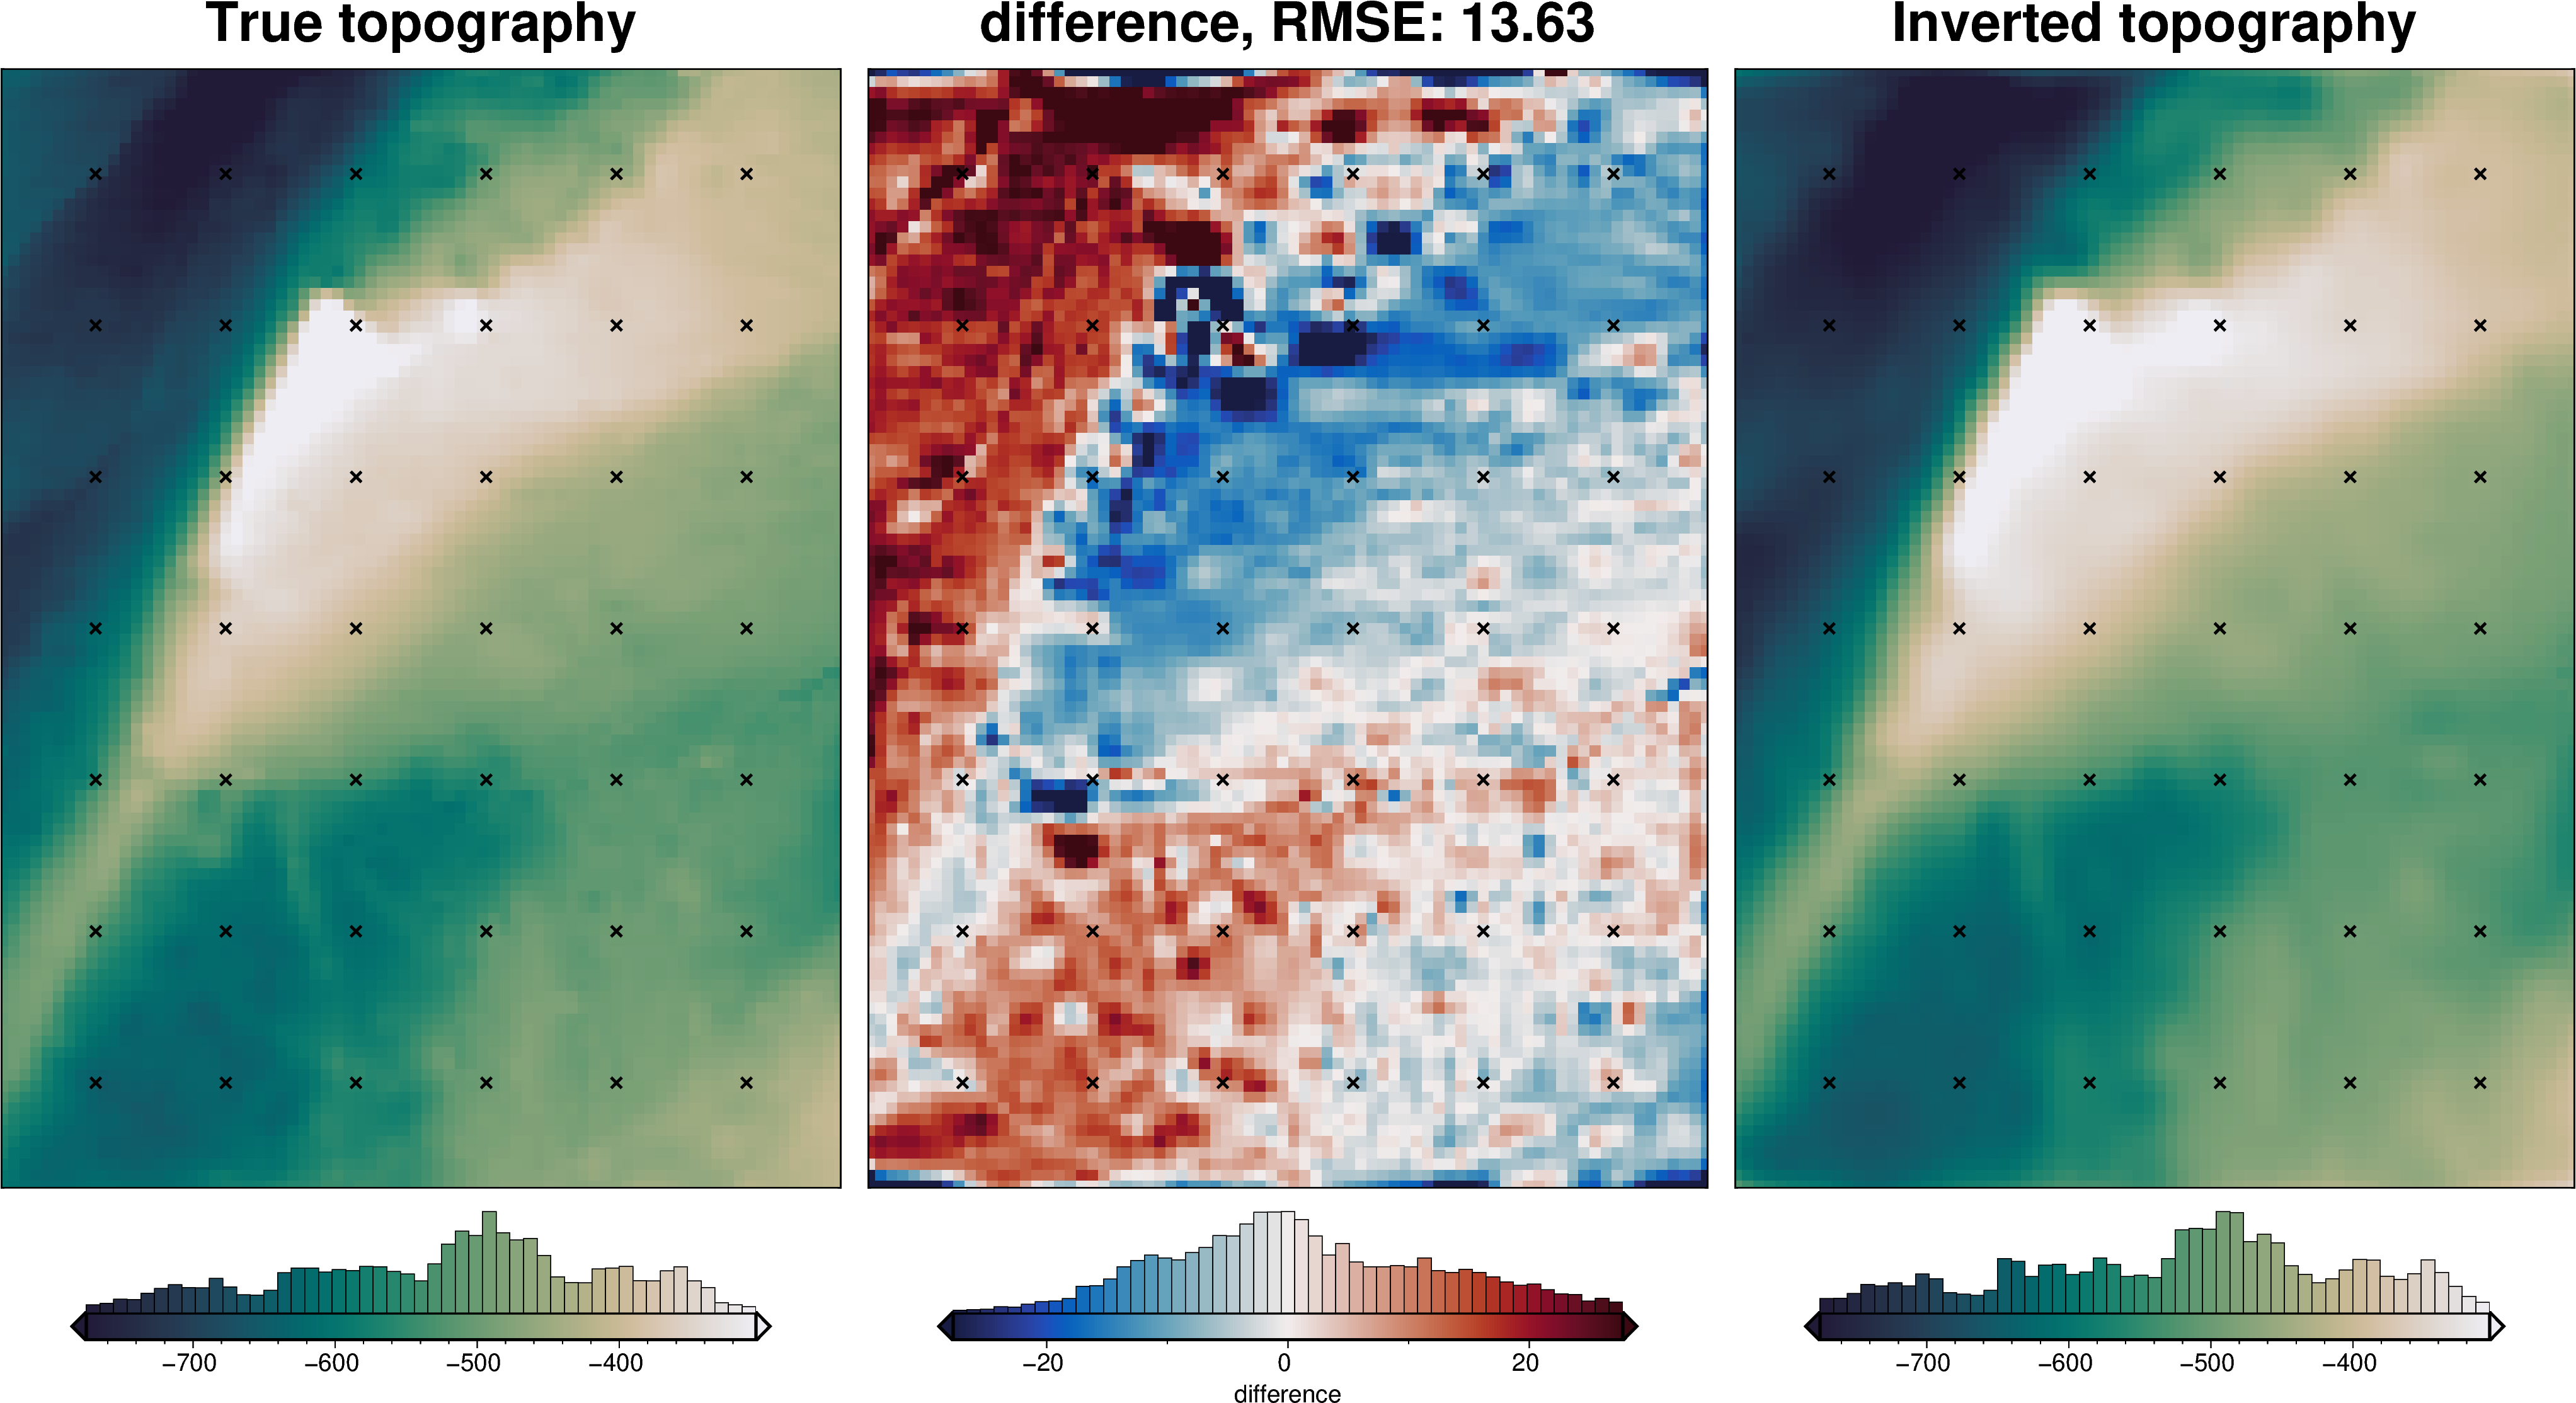
final_topography = topo_results.set_index(["northing", "easting"]).to_xarray().topo
_ = polar_utils.grd_compare(
bathymetry,
final_topography,
region=inversion_region,
plot=True,
grid1_name="True topography",
grid2_name="Inverted topography",
robust=True,
hist=True,
inset=False,
verbose="q",
title="difference",
grounding_line=False,
reverse_cpt=True,
cmap="rain",
points=constraint_points[constraint_points.inside],
points_style="x.2c",
)
[36]:
# sample the inverted topography at the constraint points
constraint_points = utils.sample_grids(
constraint_points,
final_topography,
"inverted_topography",
coord_names=("easting", "northing"),
)
rmse = utils.rmse(constraint_points.upward - constraint_points.inverted_topography)
print(f"RMSE: {rmse:.2f} m")
RMSE: 19.55 m
Density CV
[37]:
logging.getLogger().setLevel(logging.INFO)
# run the inversion workflow, including a cross validation for the damping parameter
results = inversion.run_inversion_workflow(
grav_df=grav_df,
starting_topography=starting_bathymetry,
zref=0,
calculate_regional_misfit=True,
regional_grav_kwargs=dict(
grav_df=grav_df,
method="constant",
constant=0,
),
run_zref_or_density_cv=True,
constraints_df=constraint_points,
density_contrast_limits=(1000, 2400),
zref_density_cv_trials=10,
fname=f"{fpath}_density_cv",
**kwargs,
)
'reg' already a column of `grav_df`, but is being overwritten since calculate_regional_misfit is True
'starting_gravity' already a column of `grav_df`, but is being overwritten since calculate_starting_gravity is True
'reg' already a column of `grav_df`, but is being overwritten since calculate_regional_misfit is True
[38]:
# load saved inversion results
with pathlib.Path(f"{fpath}_density_cv_results.pickle").open("rb") as f:
results = pickle.load(f)
# collect the results
topo_results, grav_results, parameters, elapsed_time = results
# load study
with pathlib.Path(f"{fpath}_density_cv_zref_density_cv_study.pickle").open("rb") as f:
study = pickle.load(f)
[39]:
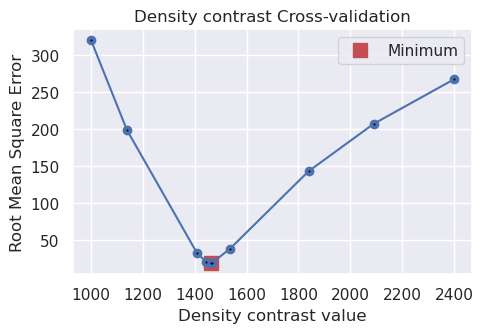
best_density_contrast = study.best_params["density_contrast"]
print("optimal determined density contrast", best_density_contrast)
print("real density contrast", true_density_contrast)
optimal determined density contrast 1464
real density contrast 1476
[40]:
study_df = study.trials_dataframe()
fig = plotting.plot_cv_scores(
study_df.value,
study_df.params_density_contrast,
param_name="Density contrast",
)
Redo with optimal density contrast
During the density cross-validation to avoid biasing the scores, we had to manually set a regional field. Now, with the optimal density contrast value found, we can rerun the inversion with an automatically determined regional field strength (the average value misfit at the constraints).
[41]:
density_contrast = best_density_contrast
density_grid = xr.where(
starting_bathymetry >= zref,
density_contrast,
-density_contrast,
)
# create layer of prisms
starting_prisms = utils.grids_to_prisms(
starting_bathymetry,
zref,
density=density_grid,
)
grav_df["starting_gravity"] = starting_prisms.prism_layer.gravity(
coordinates=(
grav_df.easting,
grav_df.northing,
grav_df.upward,
),
field="g_z",
progressbar=True,
)
grav_df = regional.regional_separation(
grav_df=grav_df,
**regional_grav_kwargs,
)
[42]:
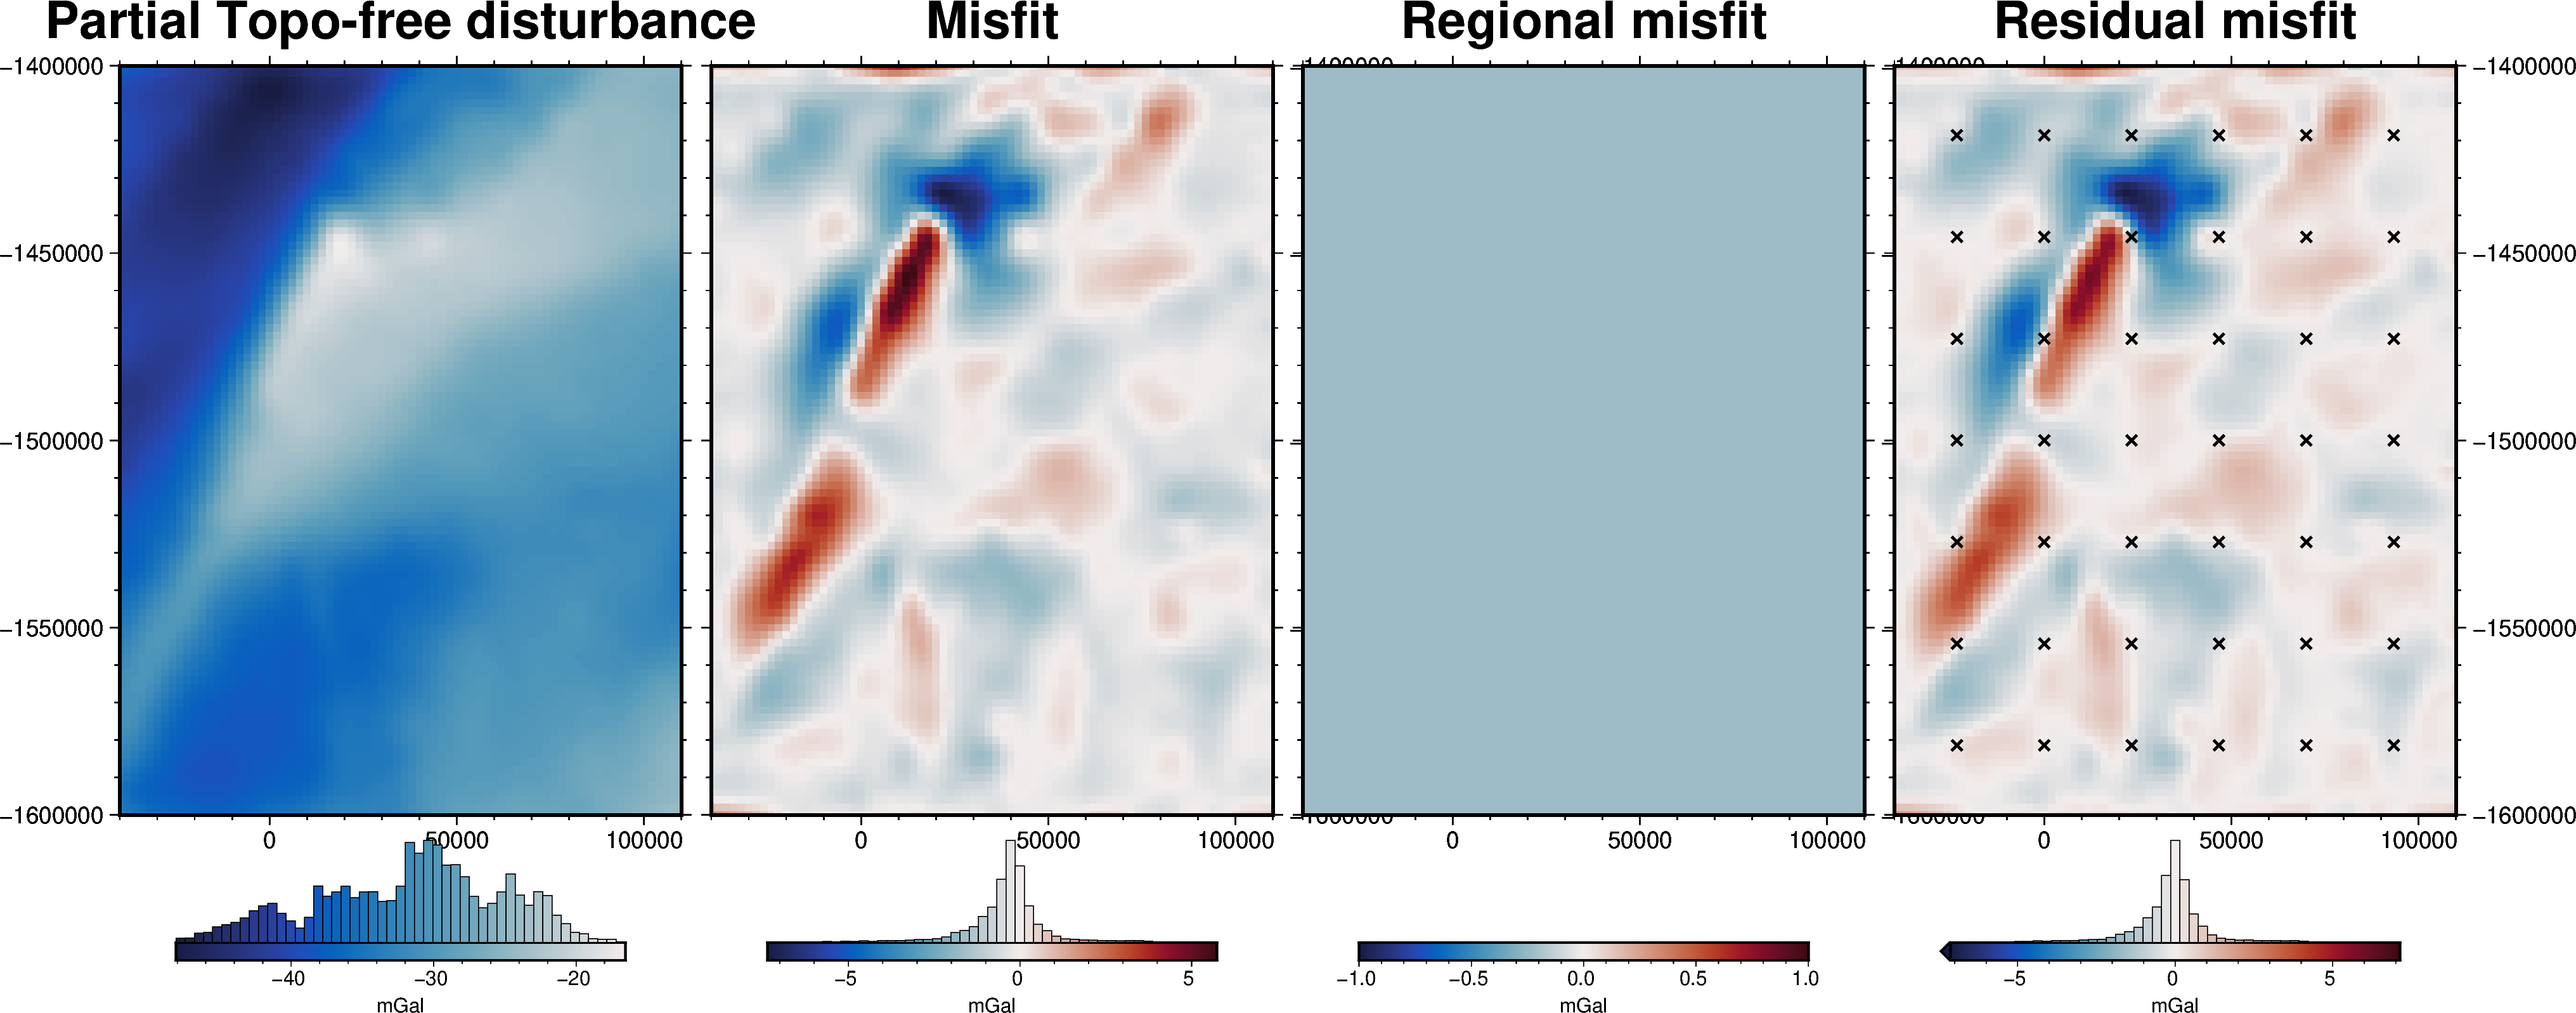
grav_grid = grav_df.set_index(["northing", "easting"]).to_xarray()
fig = maps.plot_grd(
grav_grid.gravity_anomaly,
region=inversion_region,
fig_height=10,
title="Partial Topo-free disturbance",
cmap="balance+h0",
hist=True,
cbar_label="mGal",
frame=["nSWe", "xaf10000", "yaf10000"],
)
fig = maps.plot_grd(
grav_grid.misfit,
region=inversion_region,
fig=fig,
origin_shift="xshift",
fig_height=10,
title="Misfit",
cmap="balance+h0",
hist=True,
cbar_label="mGal",
frame=["nSwE", "xaf10000", "yaf10000"],
)
fig = maps.plot_grd(
grav_grid.reg,
region=inversion_region,
fig=fig,
origin_shift="xshift",
fig_height=10,
title="Regional misfit",
cmap="balance+h0",
hist=True,
cbar_label="mGal",
frame=["nSwE", "xaf10000", "yaf10000"],
)
fig = maps.plot_grd(
grav_grid.res,
region=inversion_region,
fig=fig,
origin_shift="xshift",
fig_height=10,
title="Residual misfit",
cmap="balance+h0",
cpt_lims=[-vd.maxabs(grav_grid.res), vd.maxabs(grav_grid.res)],
hist=True,
cbar_label="mGal",
frame=["nSwE", "xaf10000", "yaf10000"],
points=constraint_points[constraint_points.inside],
points_style="x.2c",
)
fig.show()
makecpt [ERROR]: Option T: min >= max
supplied min value is greater or equal to max value
Grid/points are a constant value, can't make a colorbar histogram!
[43]:
# run the inversion workflow
inversion_results = inversion.run_inversion_workflow(
grav_df=grav_df,
fname=f"{fpath}_optimal",
starting_prisms=starting_prisms,
plot_dynamic_convergence=True,
**kwargs,
)
[44]:
# load saved inversion results
with pathlib.Path(f"{fpath}_optimal_results.pickle").open("rb") as f:
results = pickle.load(f)
# collect the results
topo_results, grav_results, parameters, elapsed_time = results
final_topography = topo_results.set_index(["northing", "easting"]).to_xarray().topo
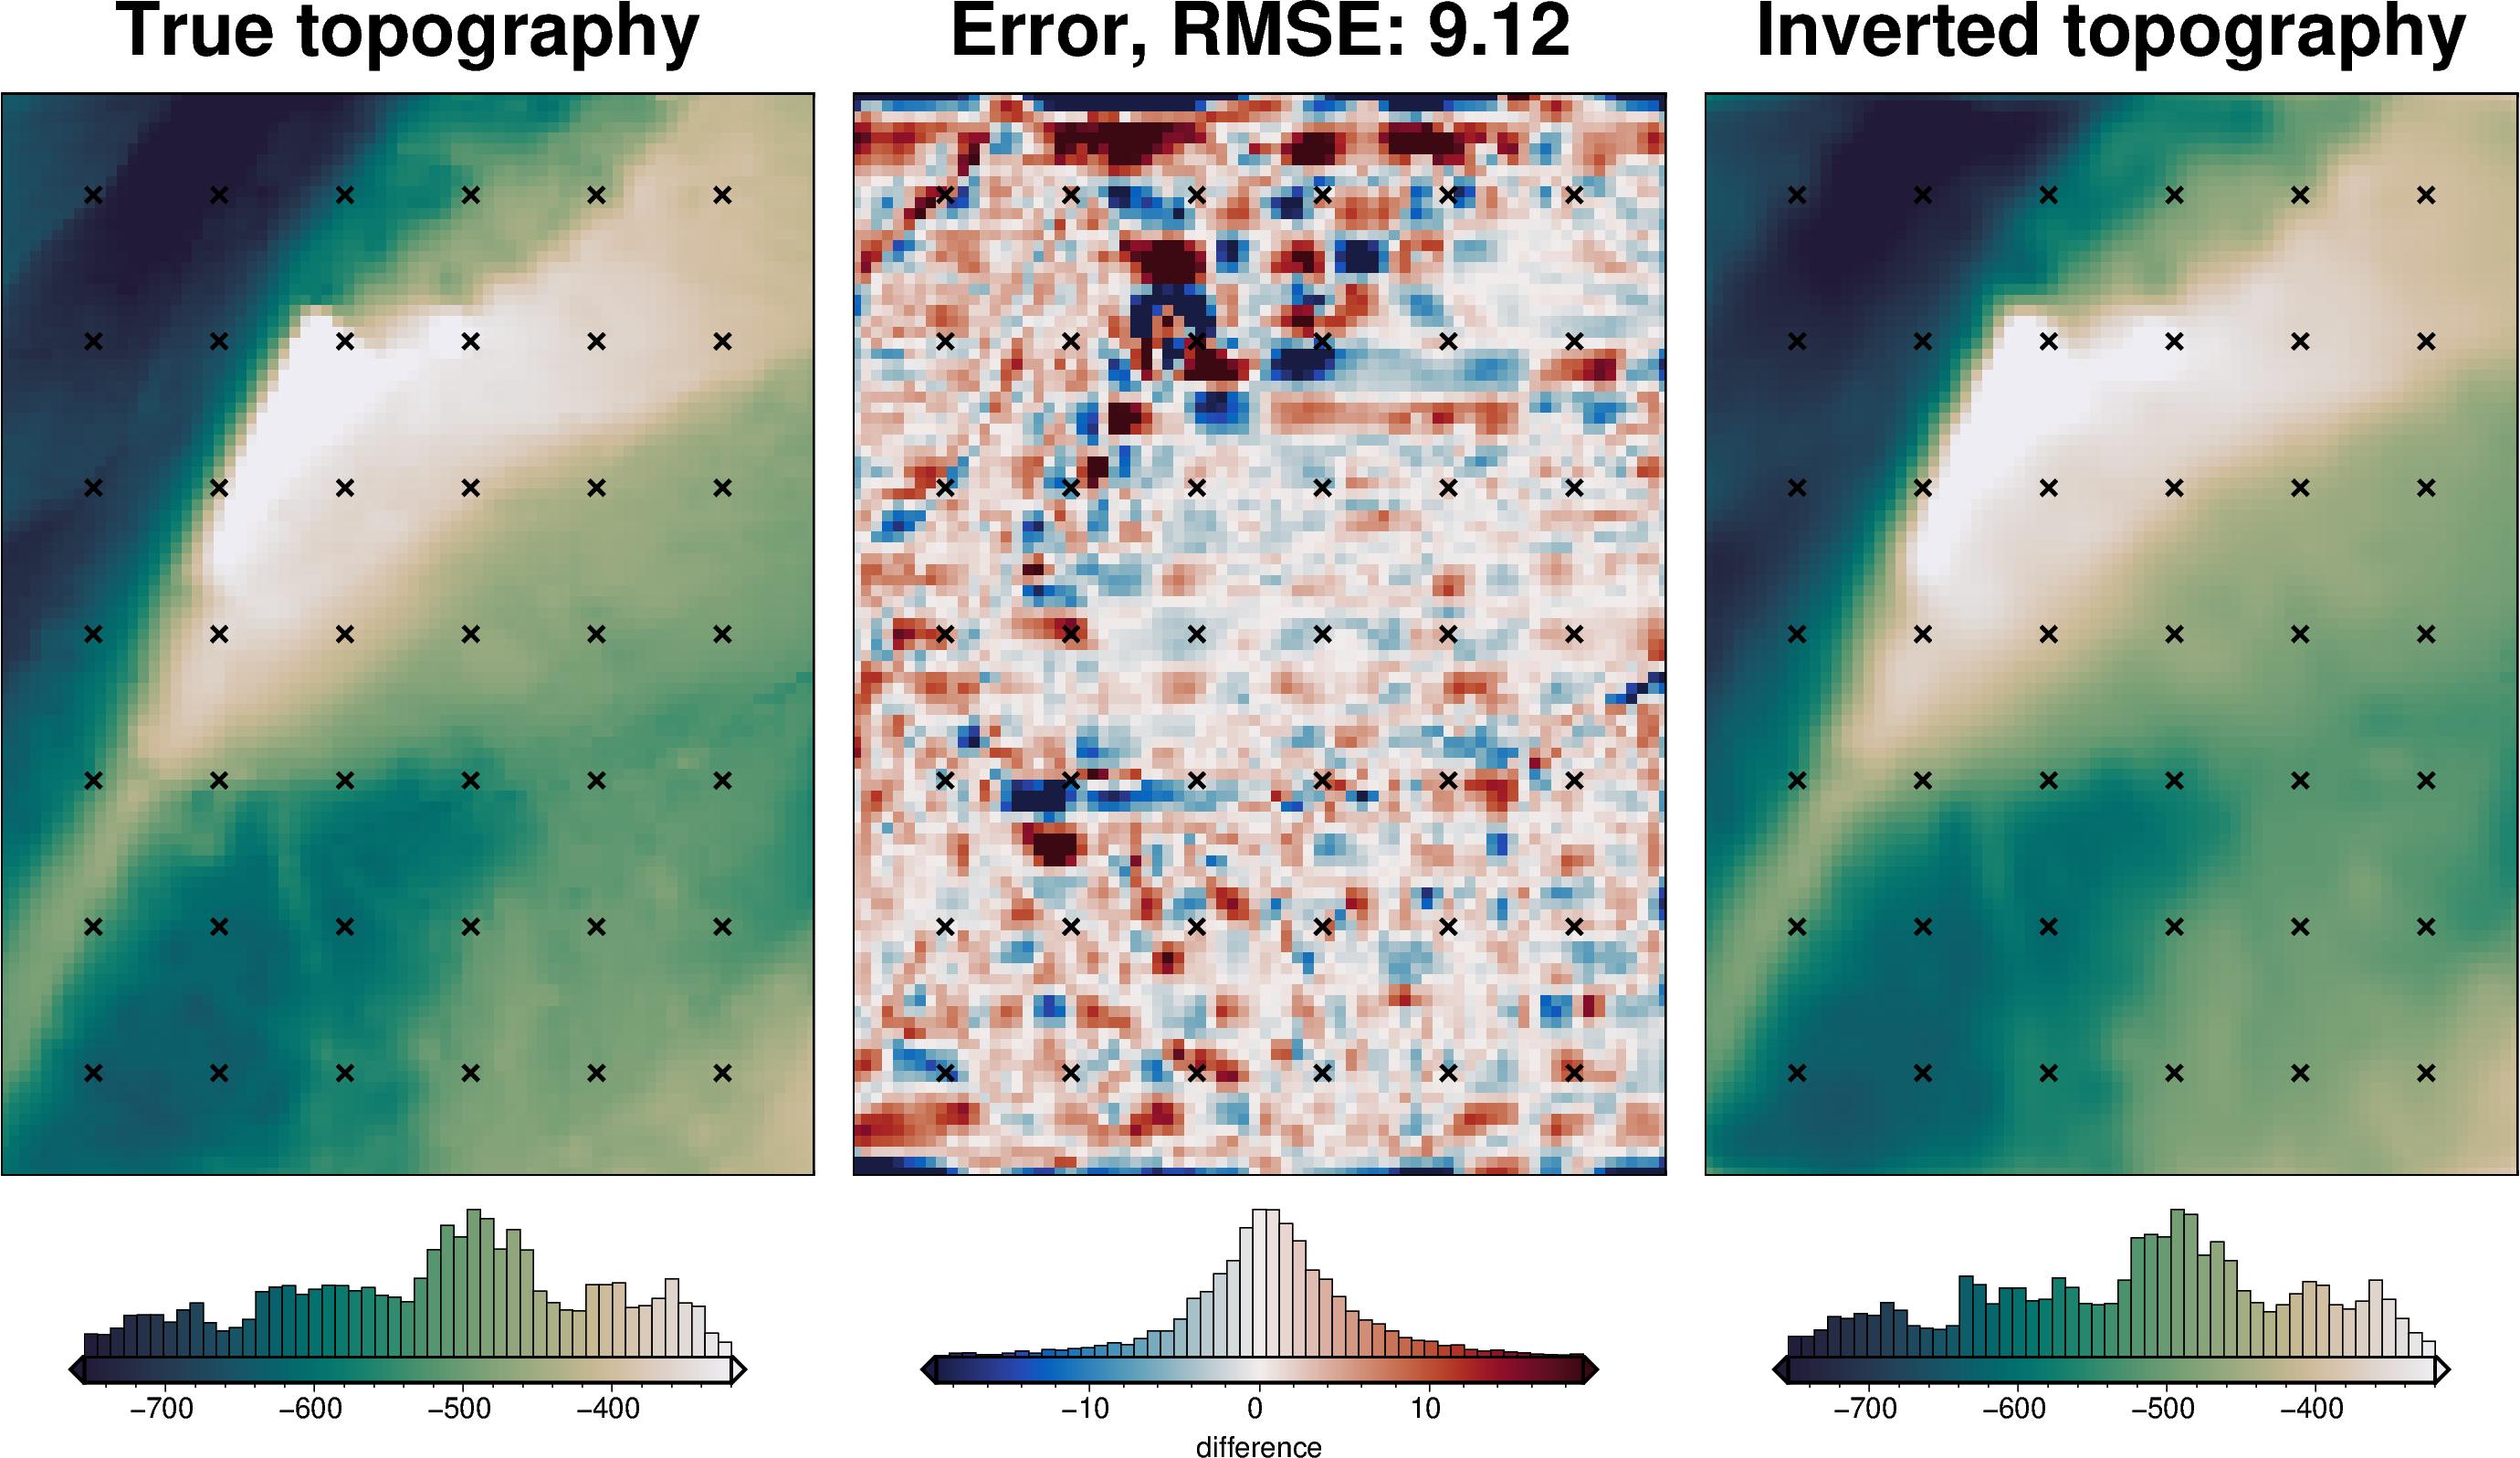
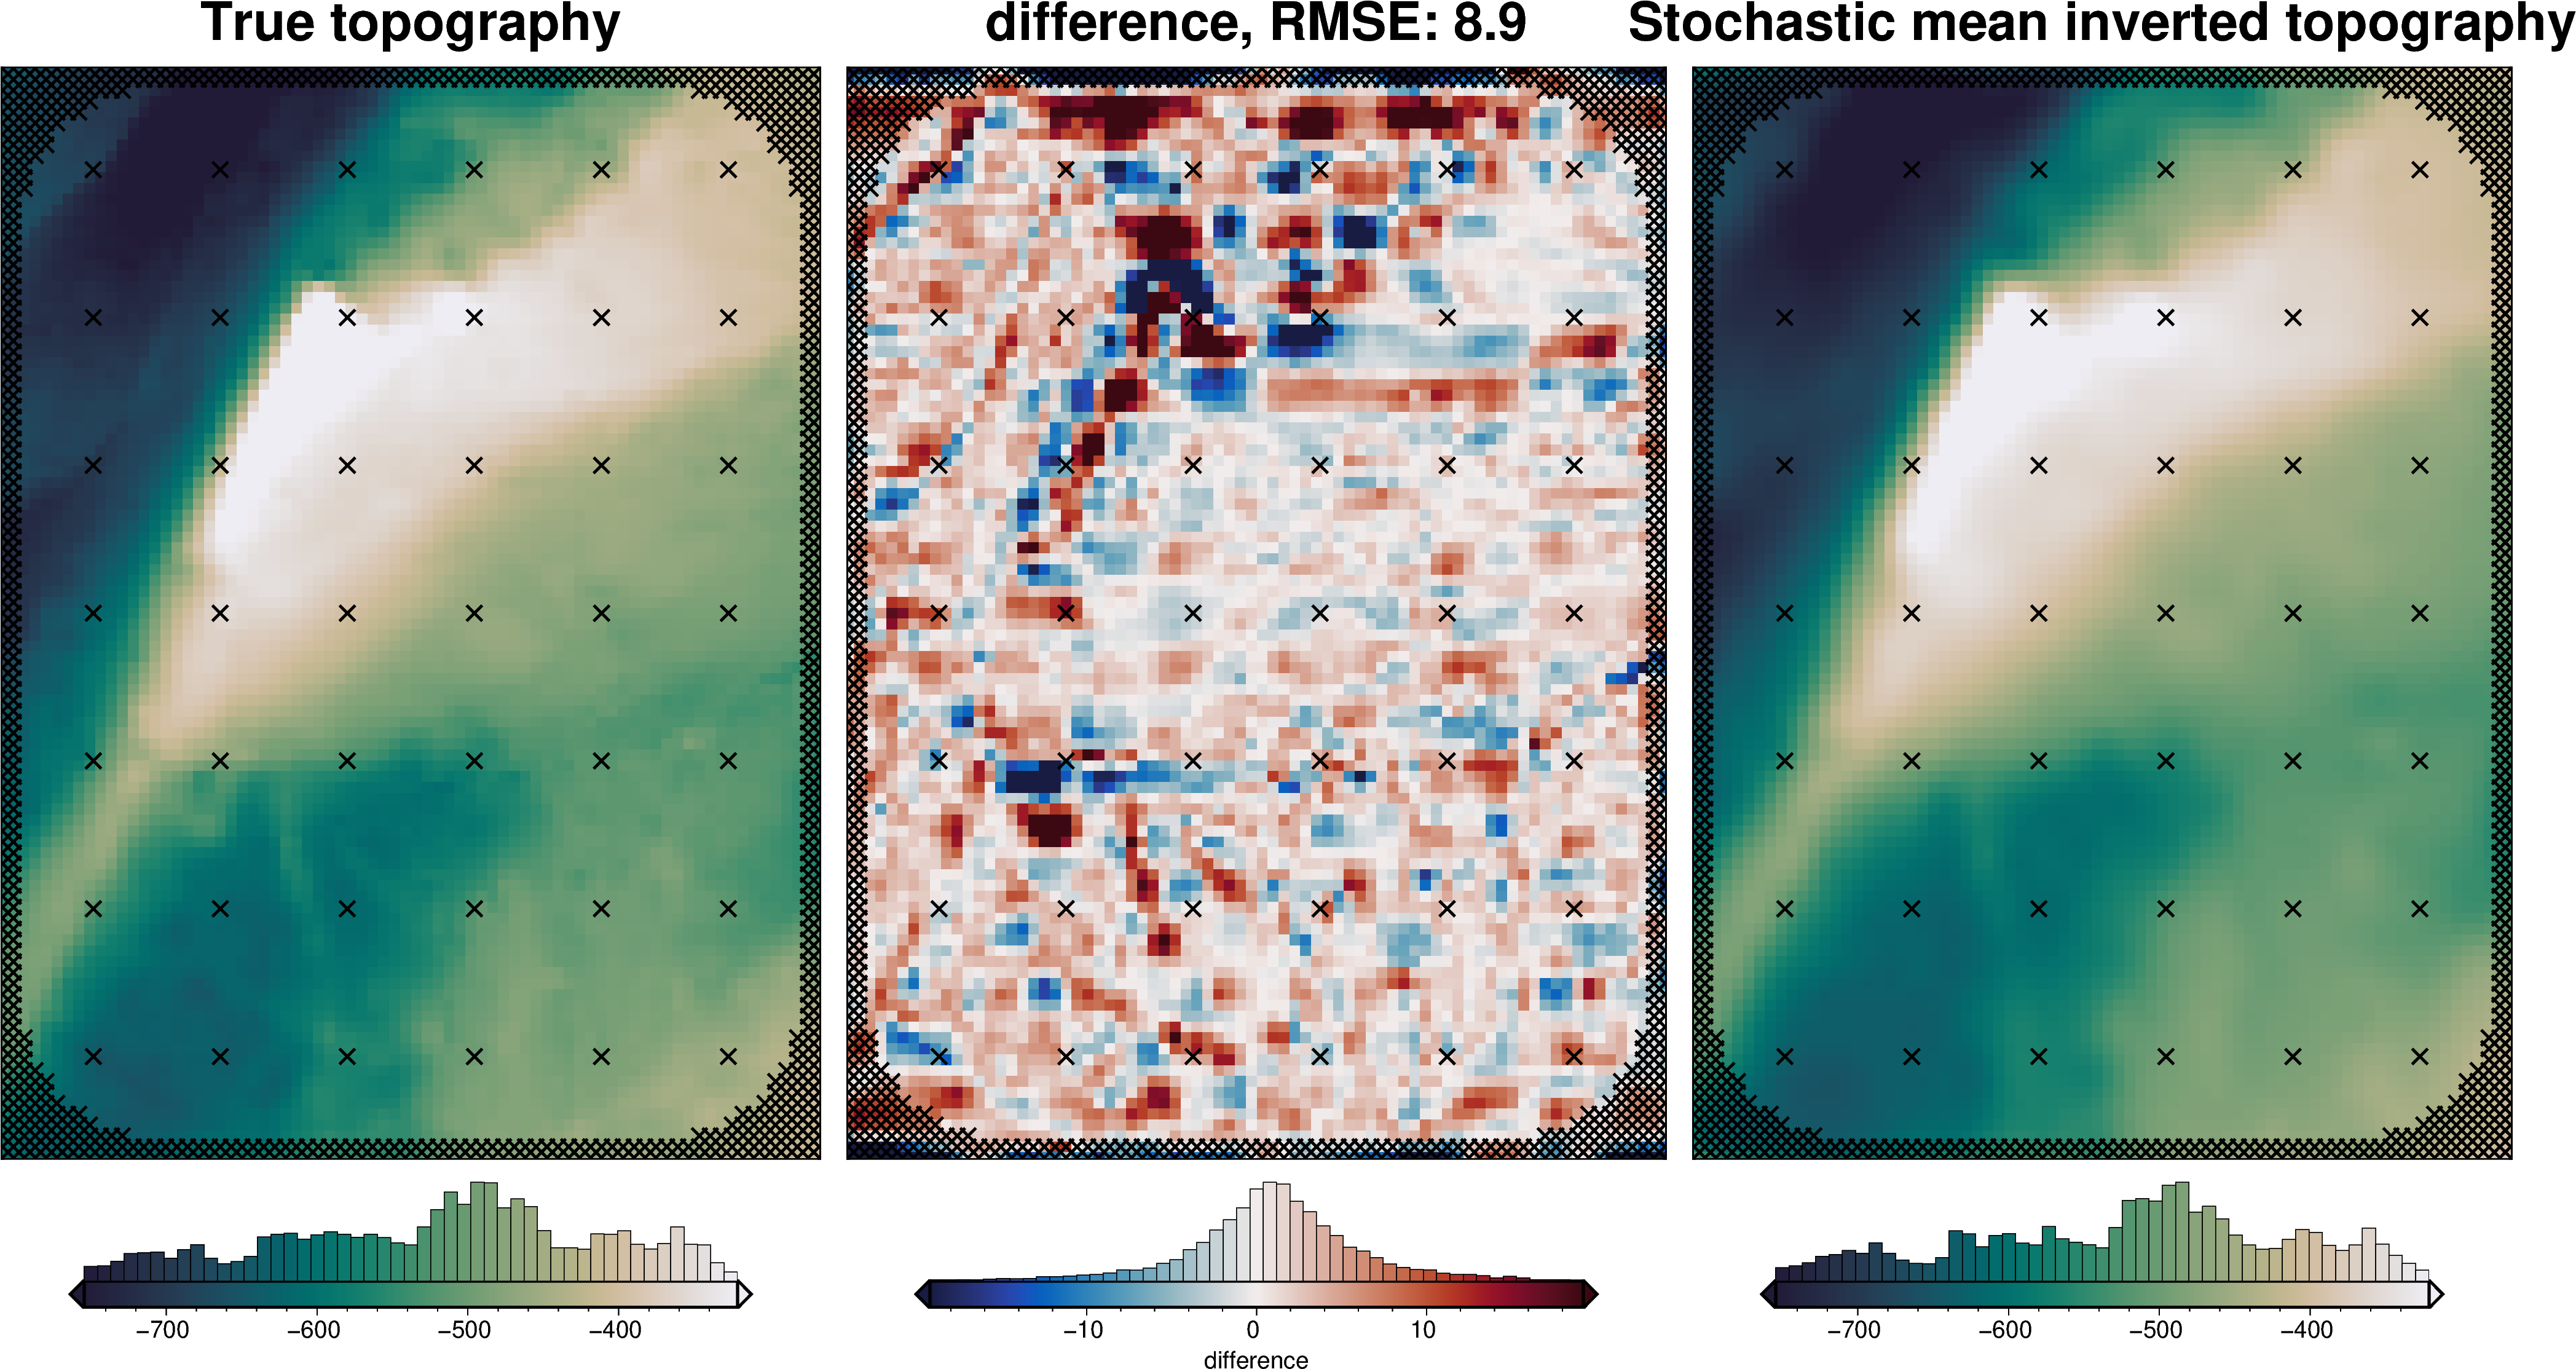
[45]:
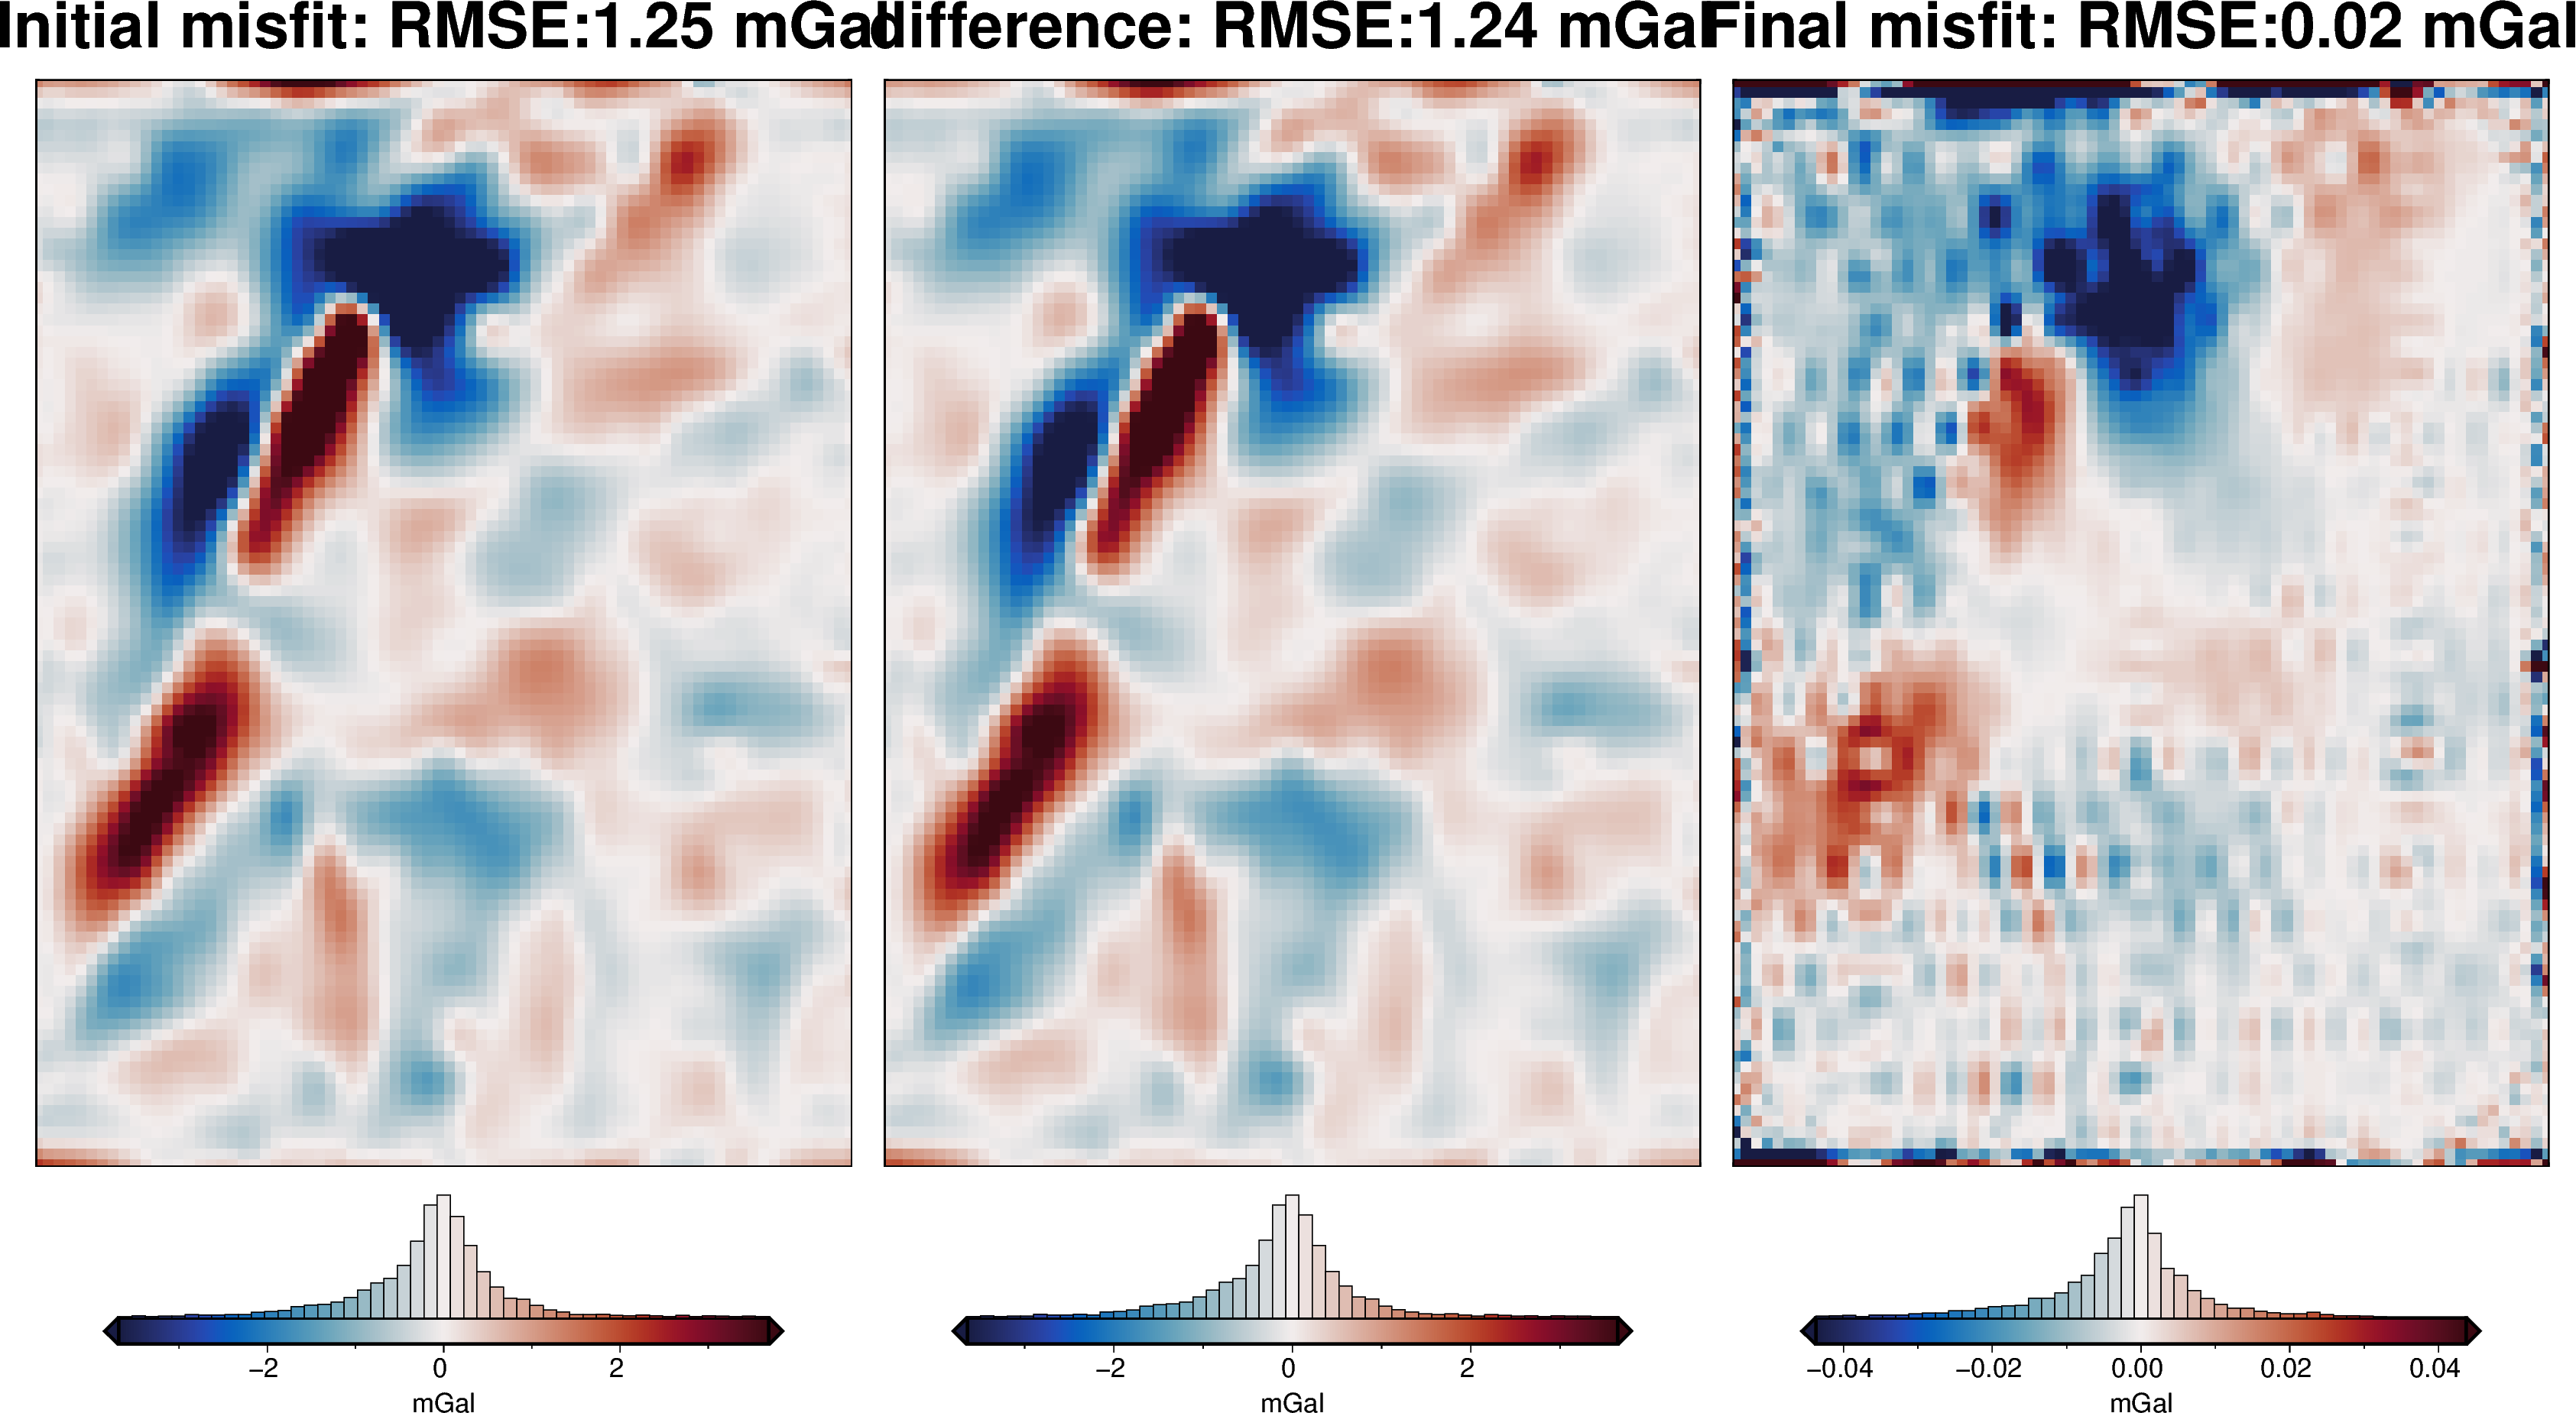
_ = polar_utils.grd_compare(
bathymetry,
final_topography,
fig_height=10,
region=inversion_region,
plot=True,
grid1_name="True topography",
grid2_name="Inverted topography",
robust=True,
hist=True,
inset=False,
verbose="q",
title="Error",
grounding_line=False,
reverse_cpt=True,
cmap="rain",
points=constraint_points[constraint_points.inside],
points_style="x.2c",
)
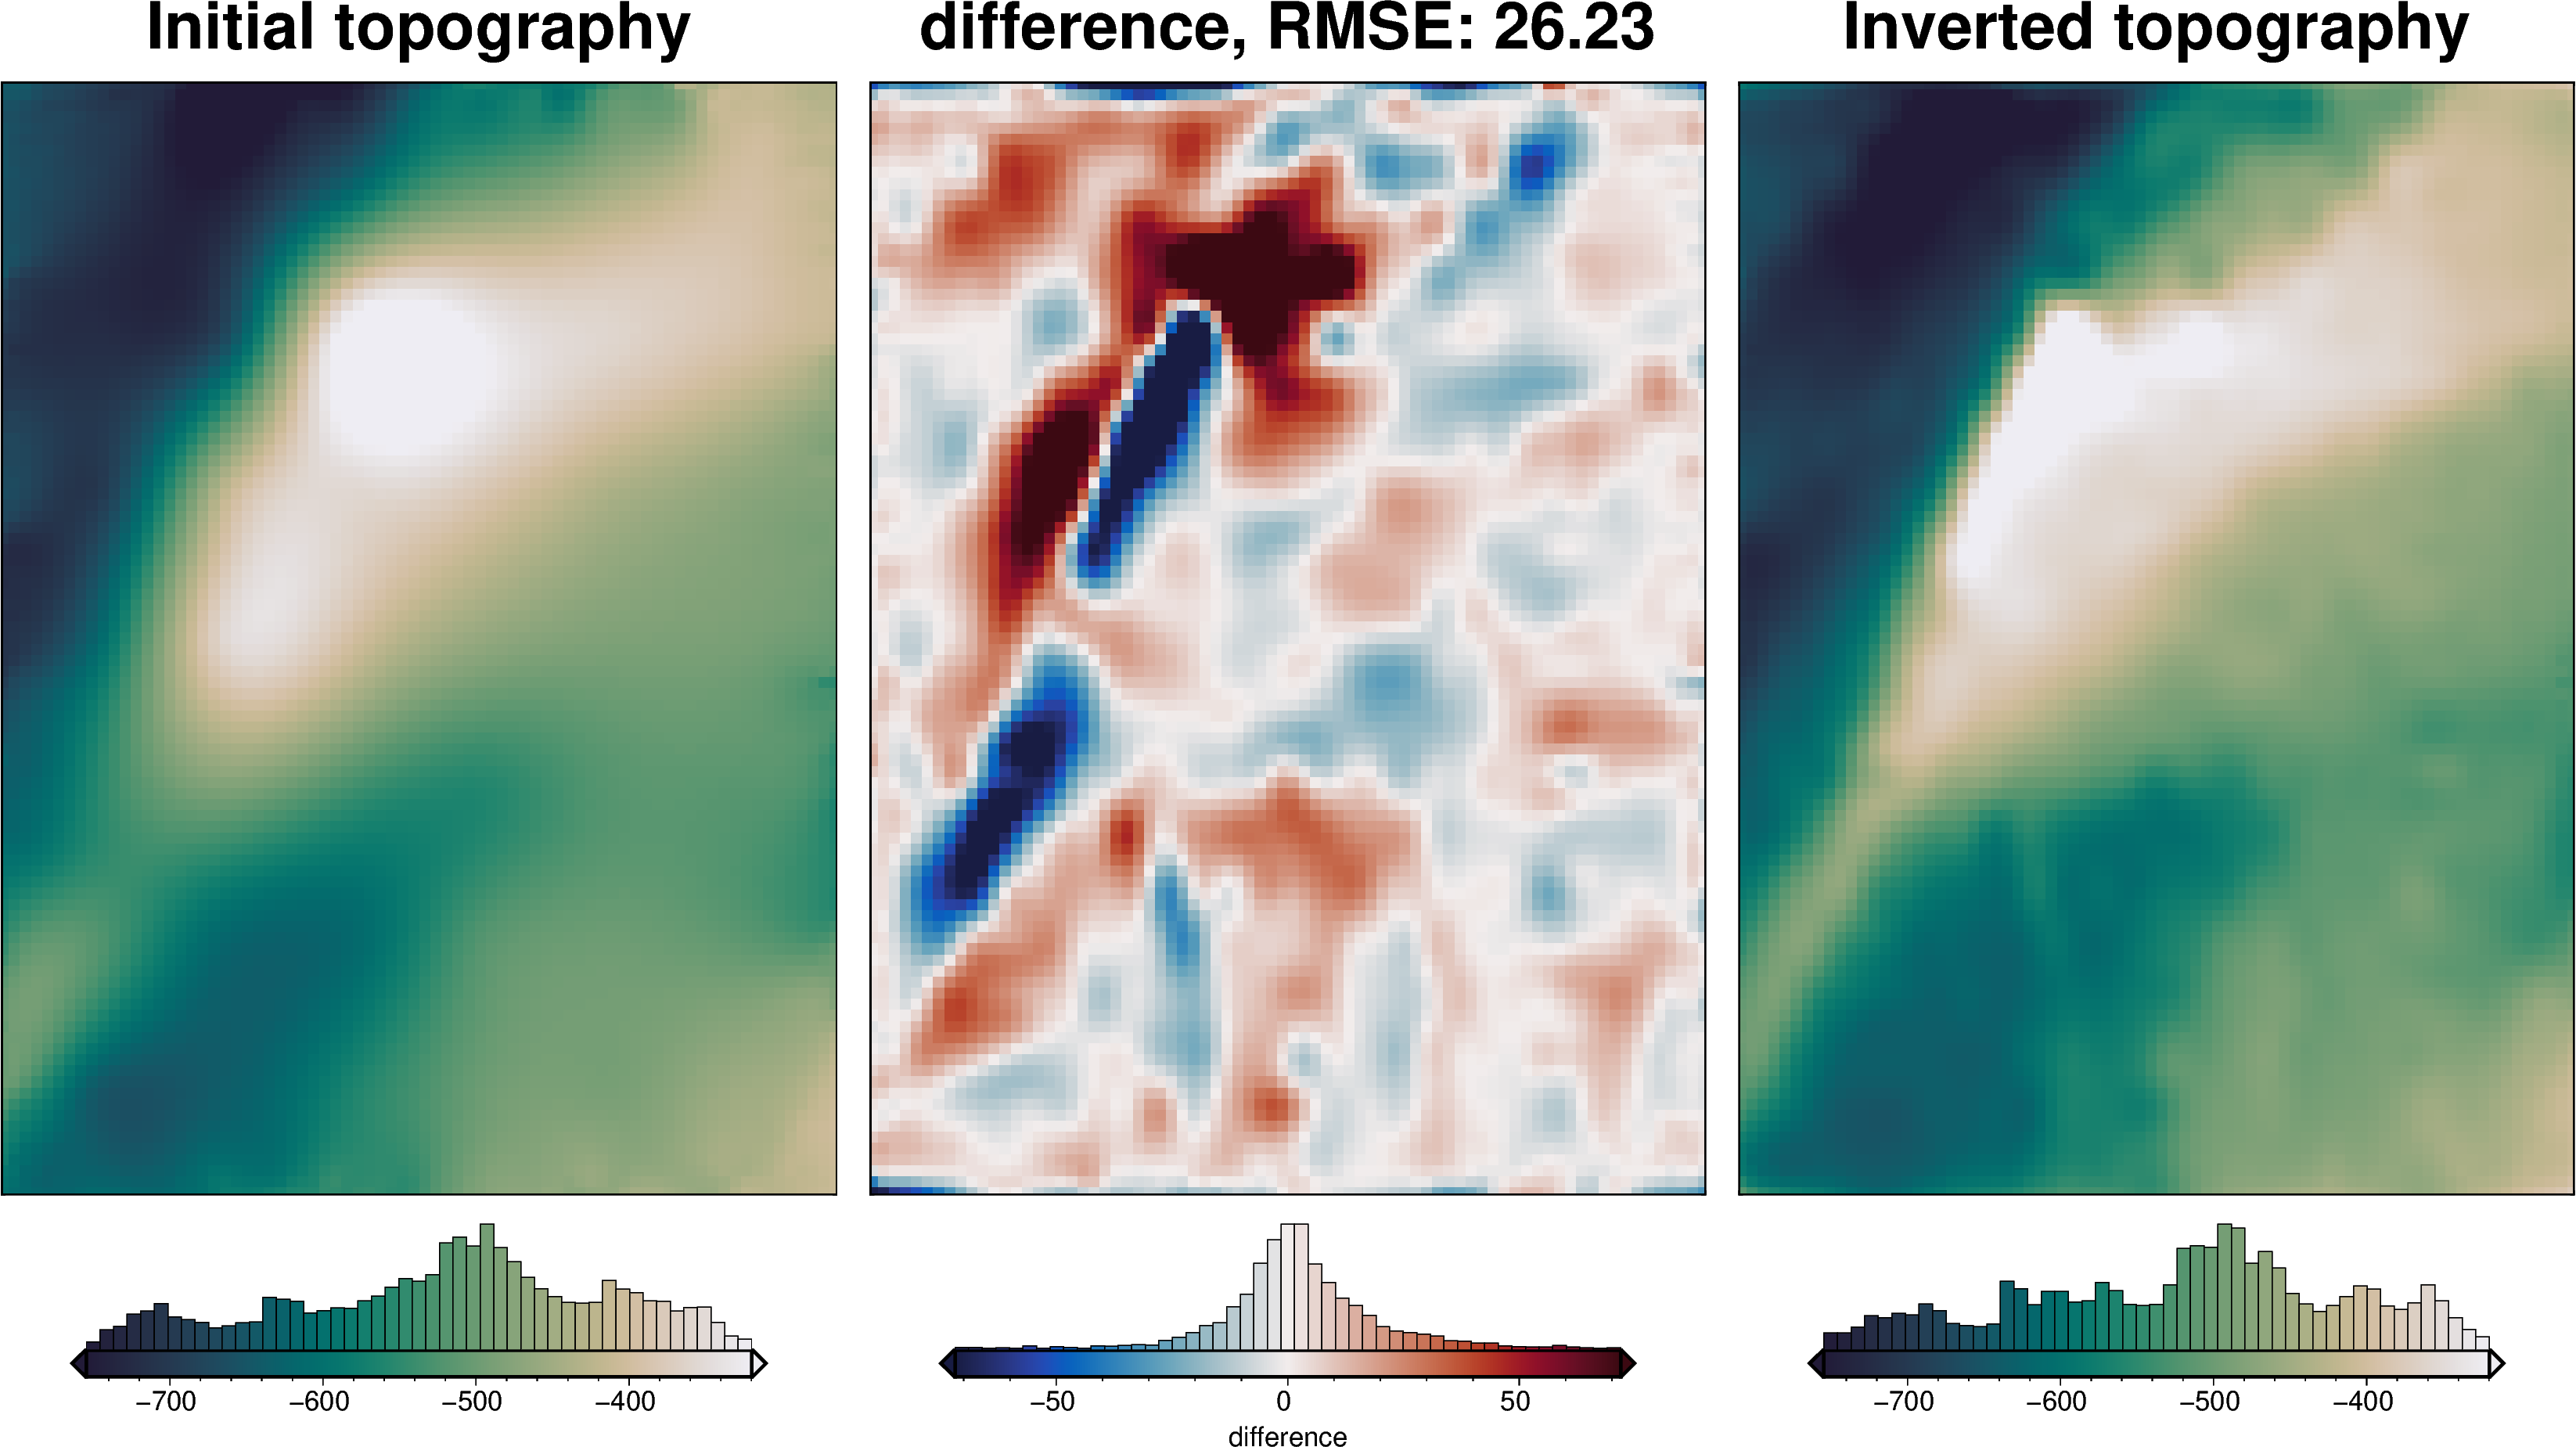
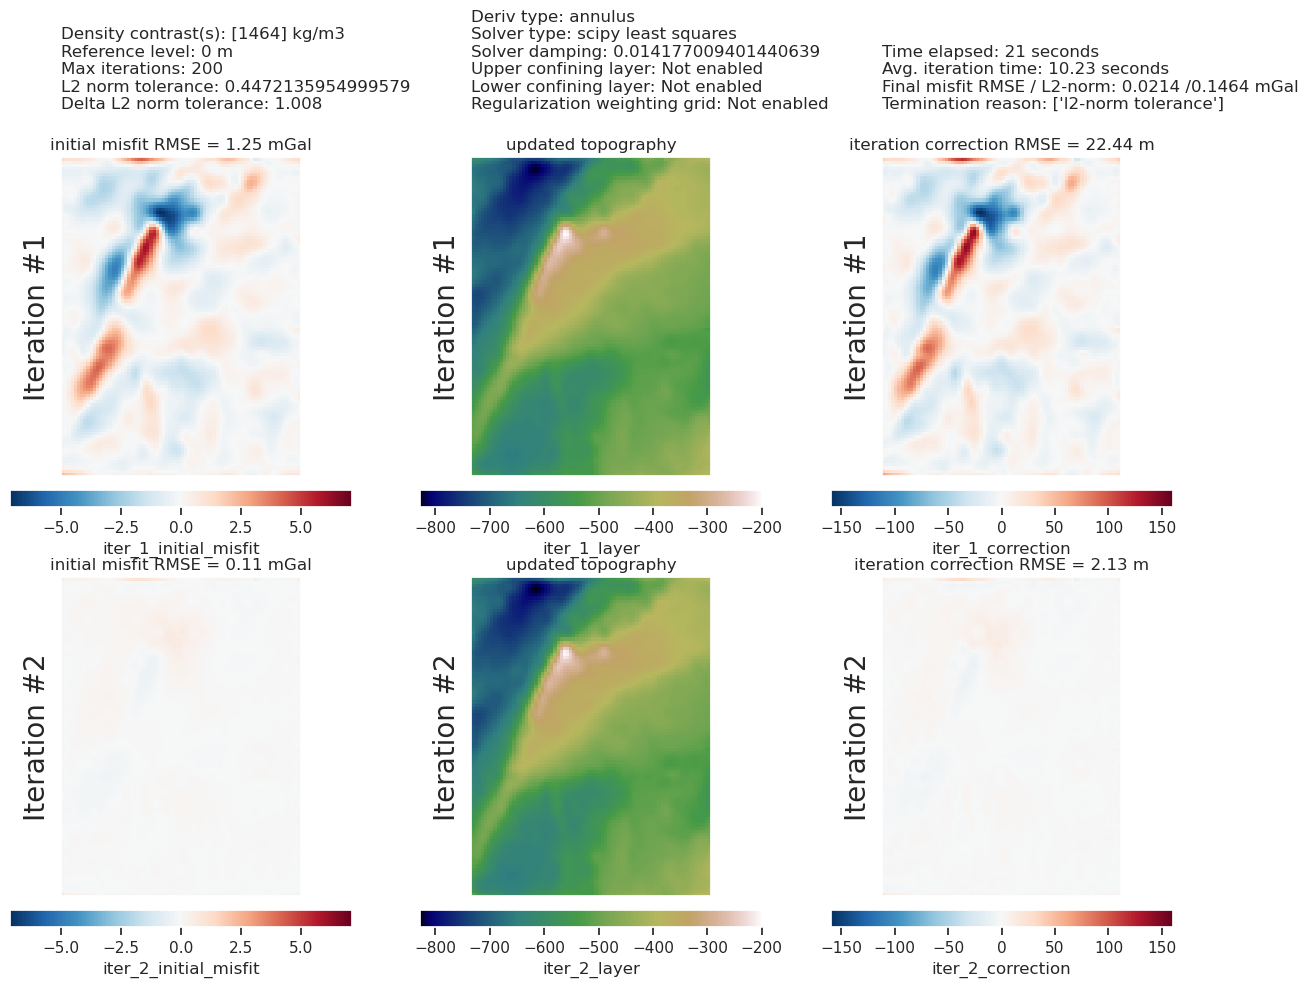
[46]:
plotting.plot_inversion_results(
grav_results,
topo_results,
parameters,
inversion_region,
iters_to_plot=2,
plot_iter_results=True,
plot_topo_results=True,
plot_grav_results=True,
)
[47]:
# sample the inverted topography at the constraint points
constraint_points = utils.sample_grids(
constraint_points,
final_topography,
"inverted_topography",
coord_names=("easting", "northing"),
)
rmse = utils.rmse(constraint_points.upward - constraint_points.inverted_topography)
print(f"RMSE: {rmse:.2f} m")
RMSE: 19.21 m
[48]:
# save to csv
constraint_points.to_csv(f"{fpath}_constraint_points.csv", index=False)
[49]:
constraint_points = pd.read_csv(f"{fpath}_constraint_points.csv")
constraint_points
[49]:
| northing | easting | inside | true_upward | upward | starting_bathymetry | inverted_topography | |
|---|---|---|---|---|---|---|---|
| 0 | -1.600000e+06 | -4.000000e+04 | False | -601.093994 | -601.093994 | -601.093994 | -517.513184 |
| 1 | -1.600000e+06 | -3.800000e+04 | False | -609.216919 | -609.216919 | -609.216919 | -540.226440 |
| 2 | -1.600000e+06 | -3.600000e+04 | False | -616.355957 | -616.355957 | -616.355957 | -557.244324 |
| 3 | -1.600000e+06 | -3.400000e+04 | False | -621.262268 | -621.262268 | -621.262268 | -565.657104 |
| 4 | -1.600000e+06 | -3.200000e+04 | False | -625.510925 | -625.510925 | -625.510925 | -574.122864 |
| ... | ... | ... | ... | ... | ... | ... | ... |
| 881 | -1.418571e+06 | -3.637979e-12 | True | -747.305711 | -747.305711 | -747.289192 | -754.926166 |
| 882 | -1.418571e+06 | 2.333333e+04 | True | -619.672055 | -619.672055 | -619.459742 | -622.551962 |
| 883 | -1.418571e+06 | 4.666667e+04 | True | -505.761536 | -505.761536 | -505.739808 | -507.541911 |
| 884 | -1.418571e+06 | 7.000000e+04 | True | -447.753091 | -447.753091 | -447.782831 | -448.868460 |
| 885 | -1.418571e+06 | 9.333333e+04 | True | -395.004206 | -395.004206 | -395.079663 | -398.805861 |
886 rows × 7 columns
Uncertainty analysis
Inversion error
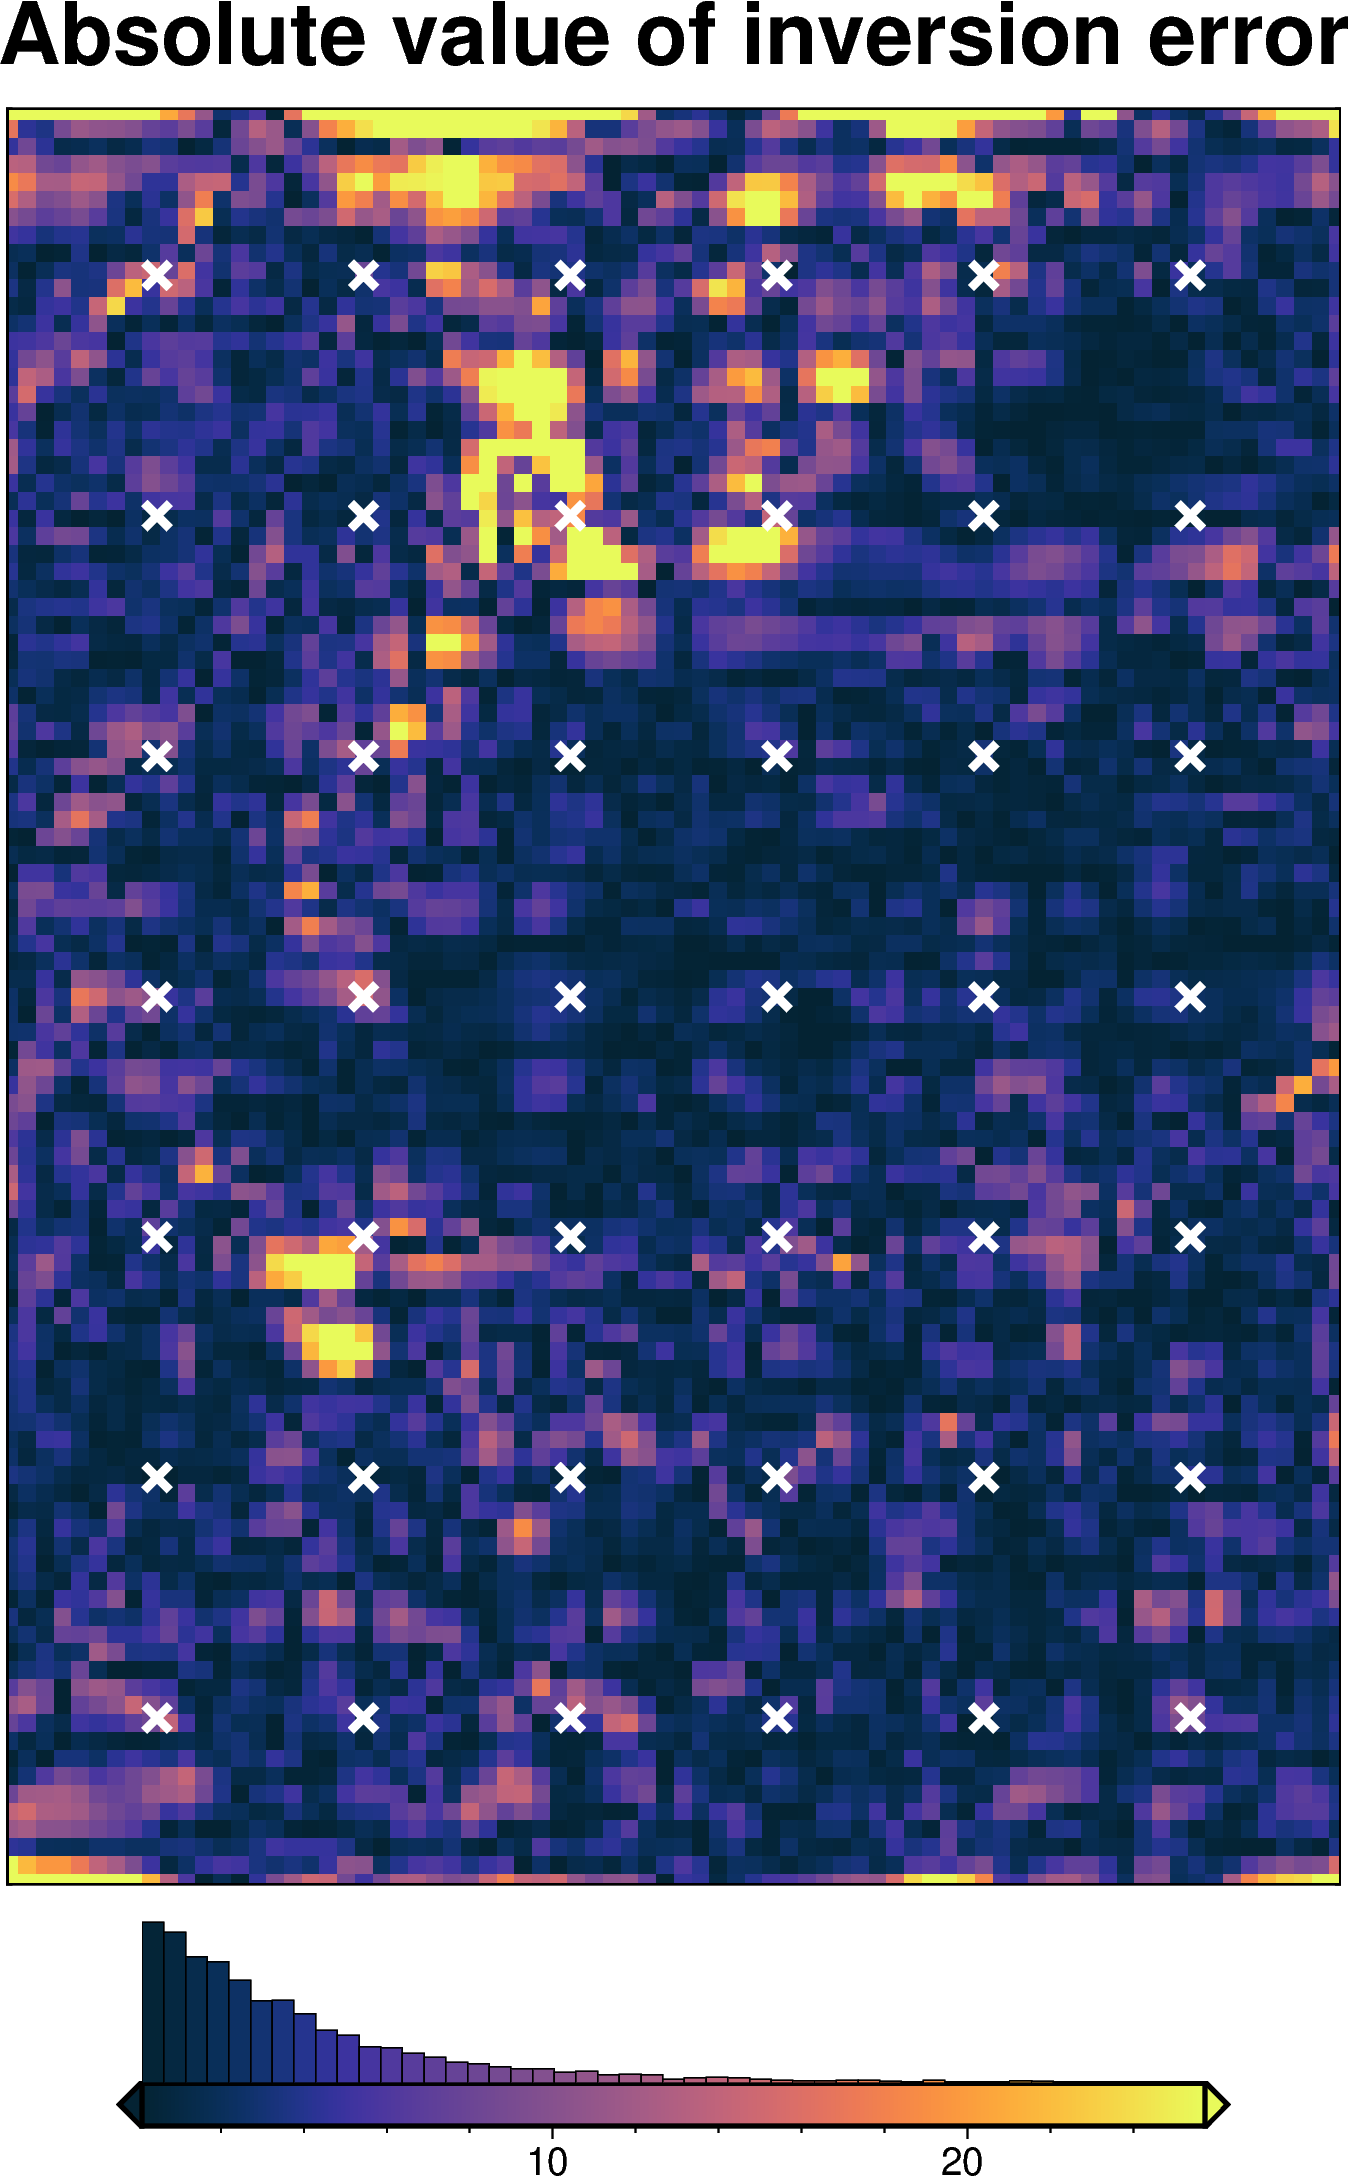
[50]:
inversion_error = np.abs(bathymetry - final_topography)
fig = maps.plot_grd(
inversion_error,
region=inversion_region,
hist=True,
cmap="thermal",
title="Absolute value of inversion error",
robust=True,
points=constraint_points[constraint_points.inside],
points_style="x.3c",
points_fill="white",
points_pen="2p",
)
fig.show()
[51]:
# kwargs to reuse for all uncertainty analyses
uncert_kwargs = dict(
grav_df=grav_df,
density_contrast=best_density_contrast,
zref=zref,
starting_prisms=starting_prisms,
starting_topography=starting_bathymetry,
regional_grav_kwargs=regional_grav_kwargs,
**kwargs,
)
Solver damping component
[52]:
# load study
with pathlib.Path(f"{fpath}_damping_cv_damping_cv_study.pickle").open("rb") as f:
study = pickle.load(f)
study_df = study.trials_dataframe().drop(columns=["user_attrs_results"])
study_df = study_df.sort_values("value")
# calculate zscores of values
study_df["value_zscore"] = sp.stats.zscore(study_df["value"])
# drop outliers (values with zscore > |2|)
study_df2 = study_df[(np.abs(study_df.value_zscore) < 2)]
# pick damping standard deviation based on optimization
stdev = np.log10(study_df2.params_damping).std()
print(f"calculated stdev: {stdev}")
stdev = stdev / 2
print(f"using stdev: {stdev}")
calculated stdev: 0.4893215801036921
using stdev: 0.24466079005184604
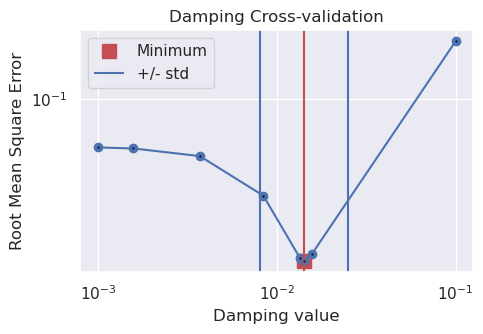
[53]:
fig = plotting.plot_cv_scores(
study_df.value,
study_df.params_damping,
param_name="Damping",
logx=True,
logy=True,
)
ax = fig.axes[0]
best = float(study_df2.params_damping.iloc[0])
upper = float(10 ** (np.log10(best) + stdev))
lower = float(10 ** (np.log10(best) - stdev))
y_lims = ax.get_ylim()
ax.vlines(best, ymin=y_lims[0], ymax=y_lims[1], color="r")
ax.vlines(upper, ymin=y_lims[0], ymax=y_lims[1], label="+/- std")
ax.vlines(lower, ymin=y_lims[0], ymax=y_lims[1])
x_lims = ax.get_xlim()
ax.set_xlim(
min(x_lims[0], lower),
max(x_lims[1], upper),
)
ax.legend()
print("best:", best, "\nstd:", stdev, "\n+1std:", upper, "\n-1std:", lower)
best: 0.014177009401440639
std: 0.24466079005184604
+1std: 0.0249026415526624
-1std: 0.008070934769851684
[54]:
solver_dict = {
"solver_damping": {
"distribution": "normal",
"loc": np.log10(best_damping), # mean of base 10 exponent
"scale": stdev, # standard deviation of base 10 exponent
"log": True,
},
}
fname = f"{fpath}_uncertainty_damping"
# delete files if already exist
for p in pathlib.Path().glob(f"{fname}*"):
p.unlink(missing_ok=True)
uncert_damping_results = uncertainty.full_workflow_uncertainty_loop(
fname=fname,
runs=10,
parameter_dict=solver_dict,
**uncert_kwargs,
)
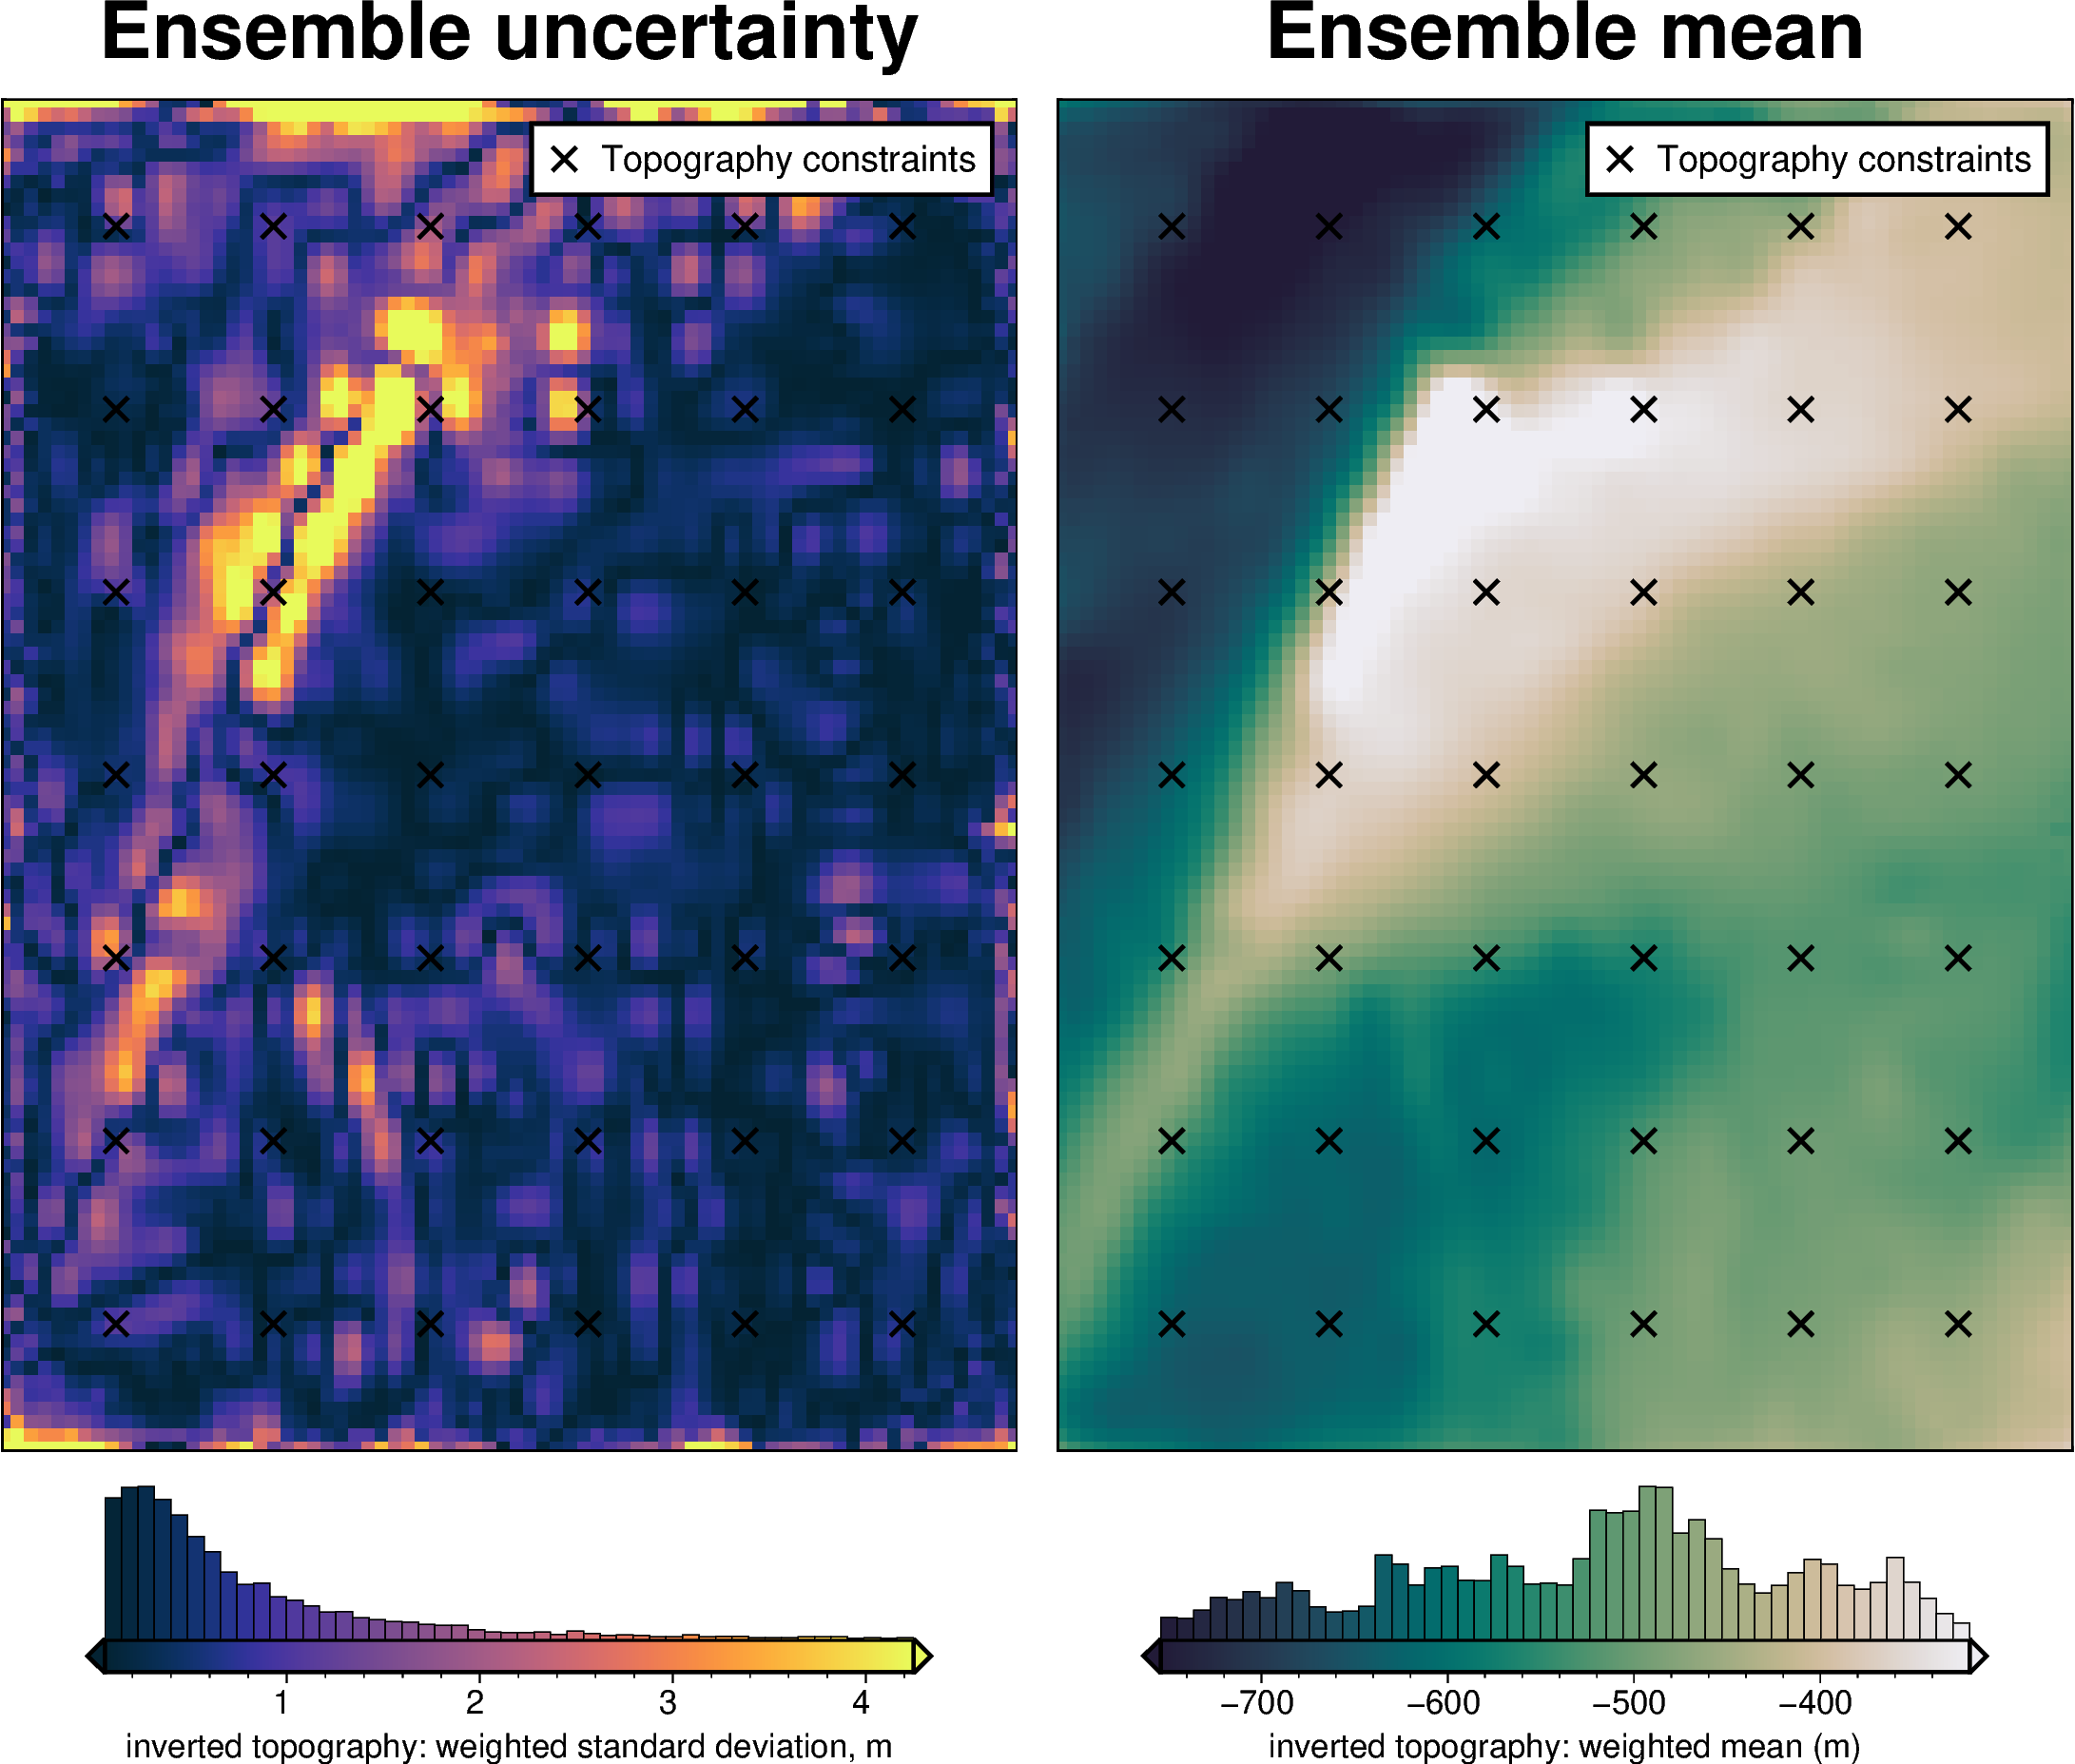
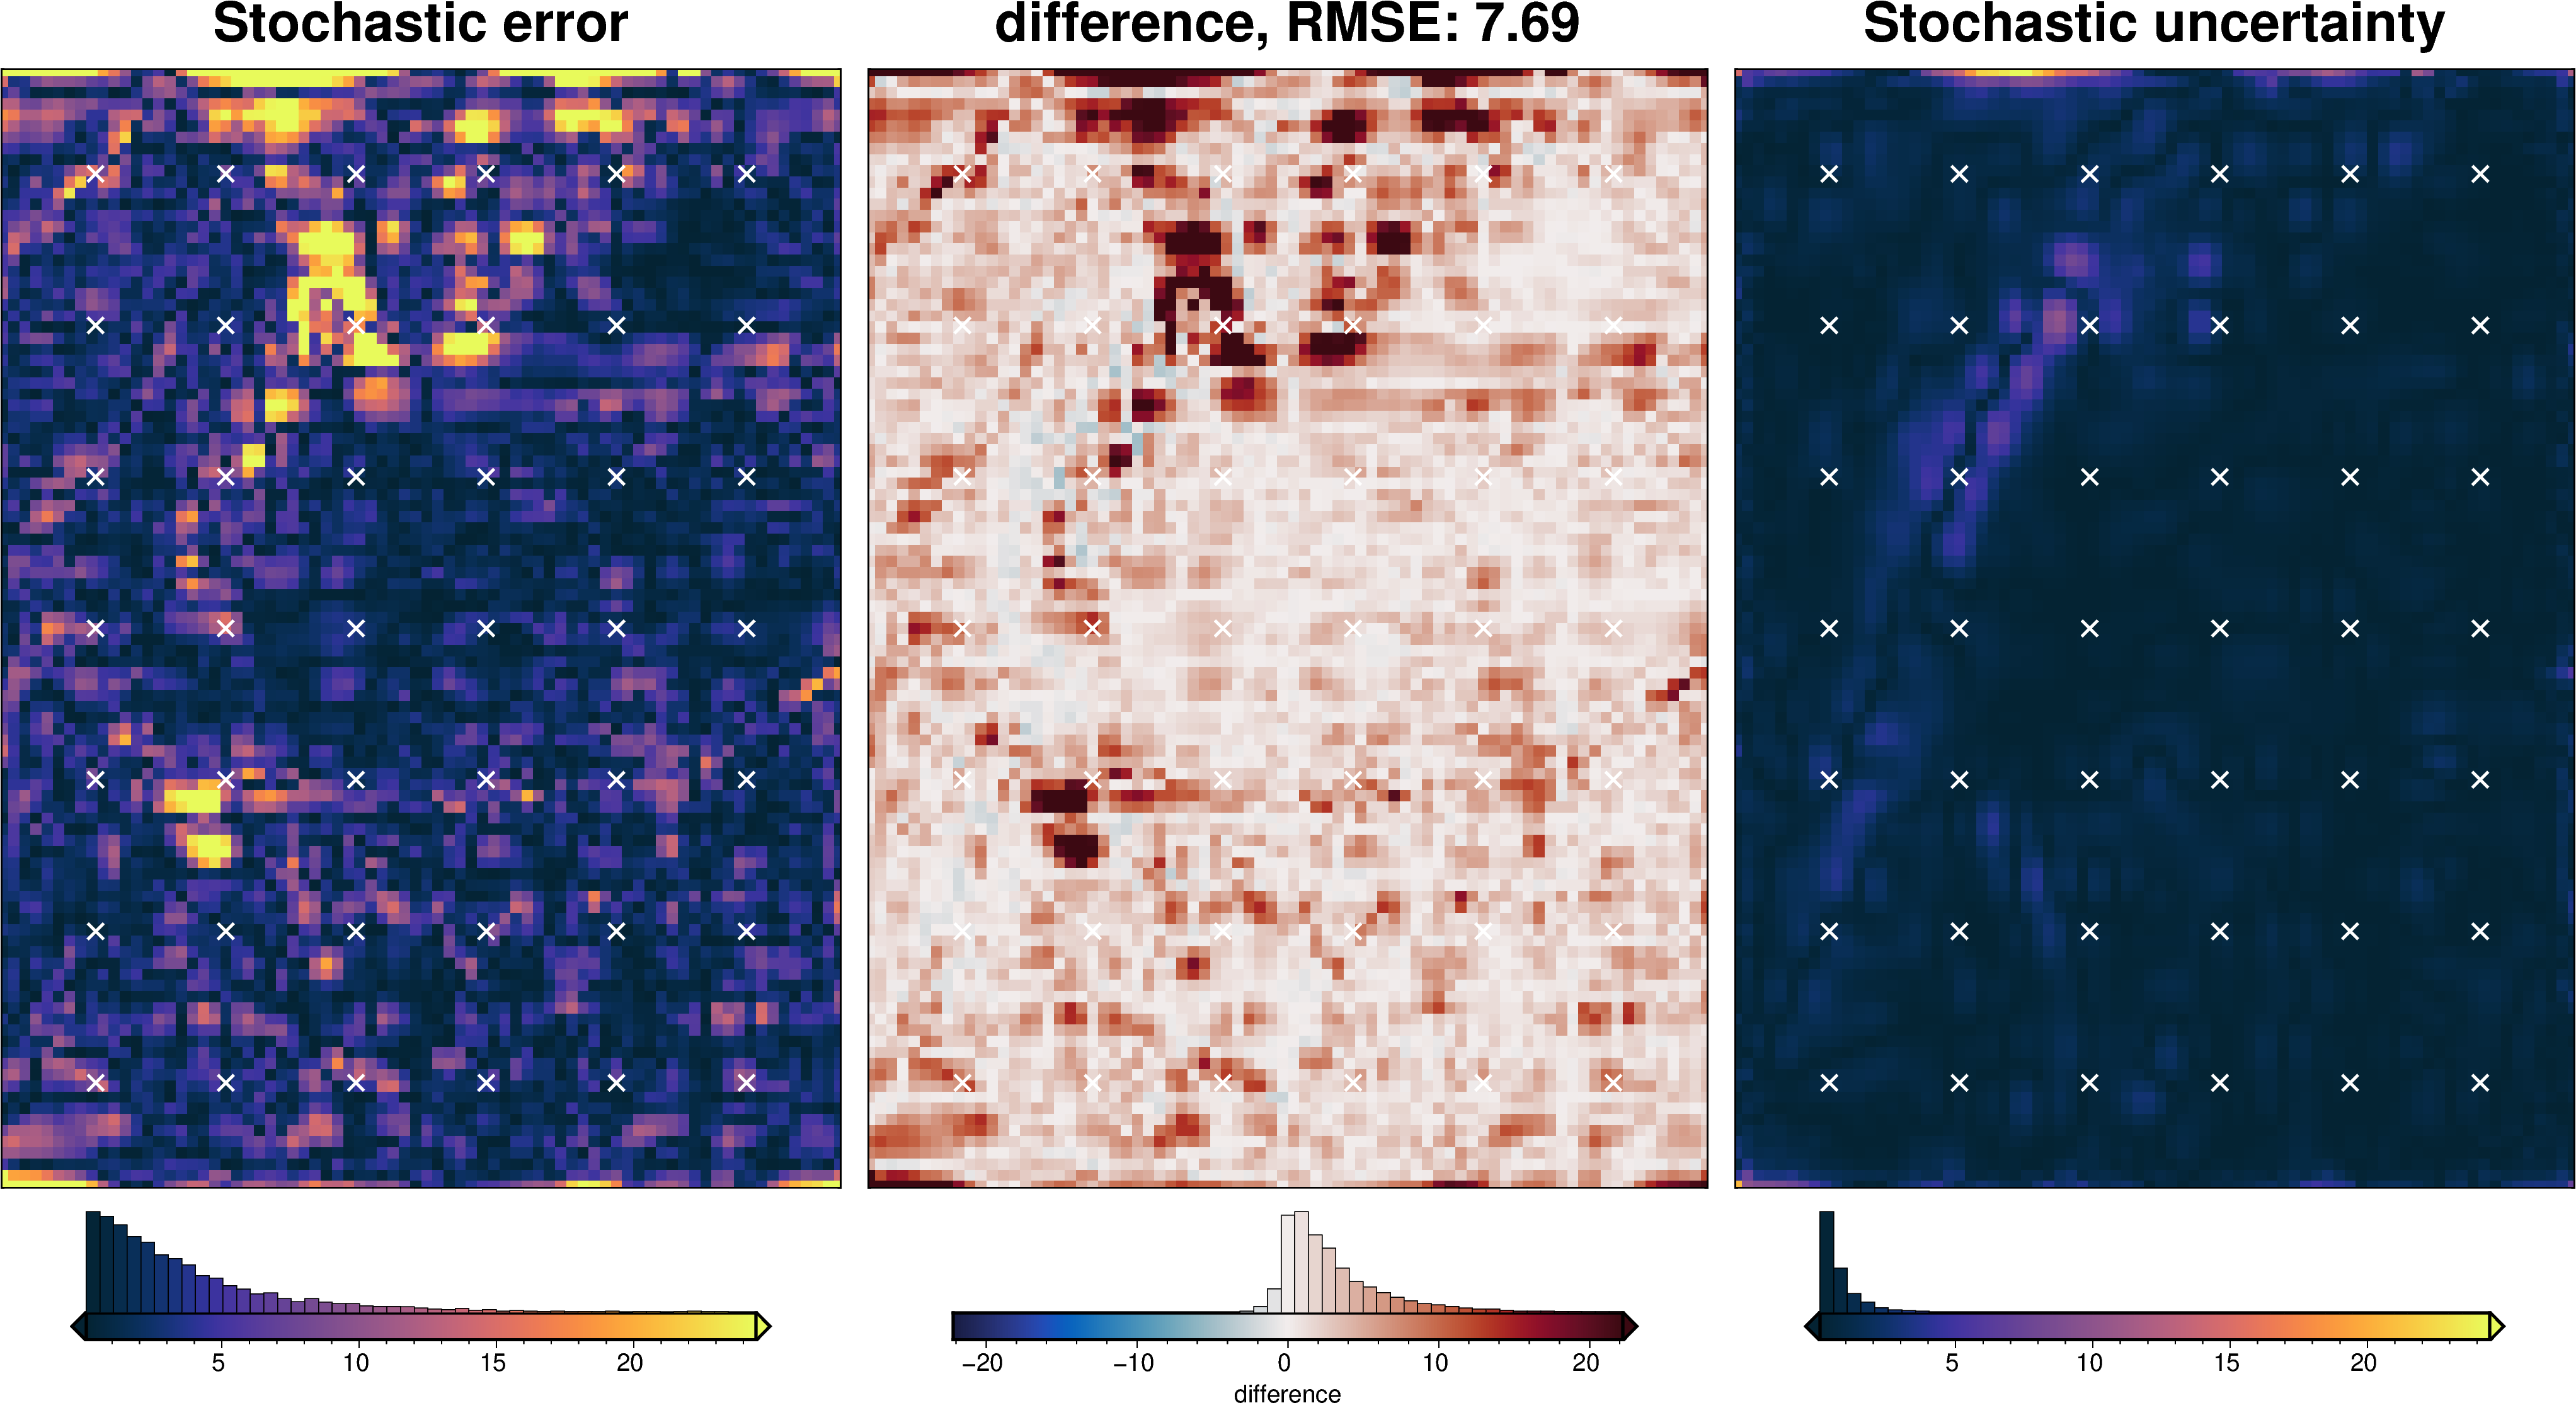
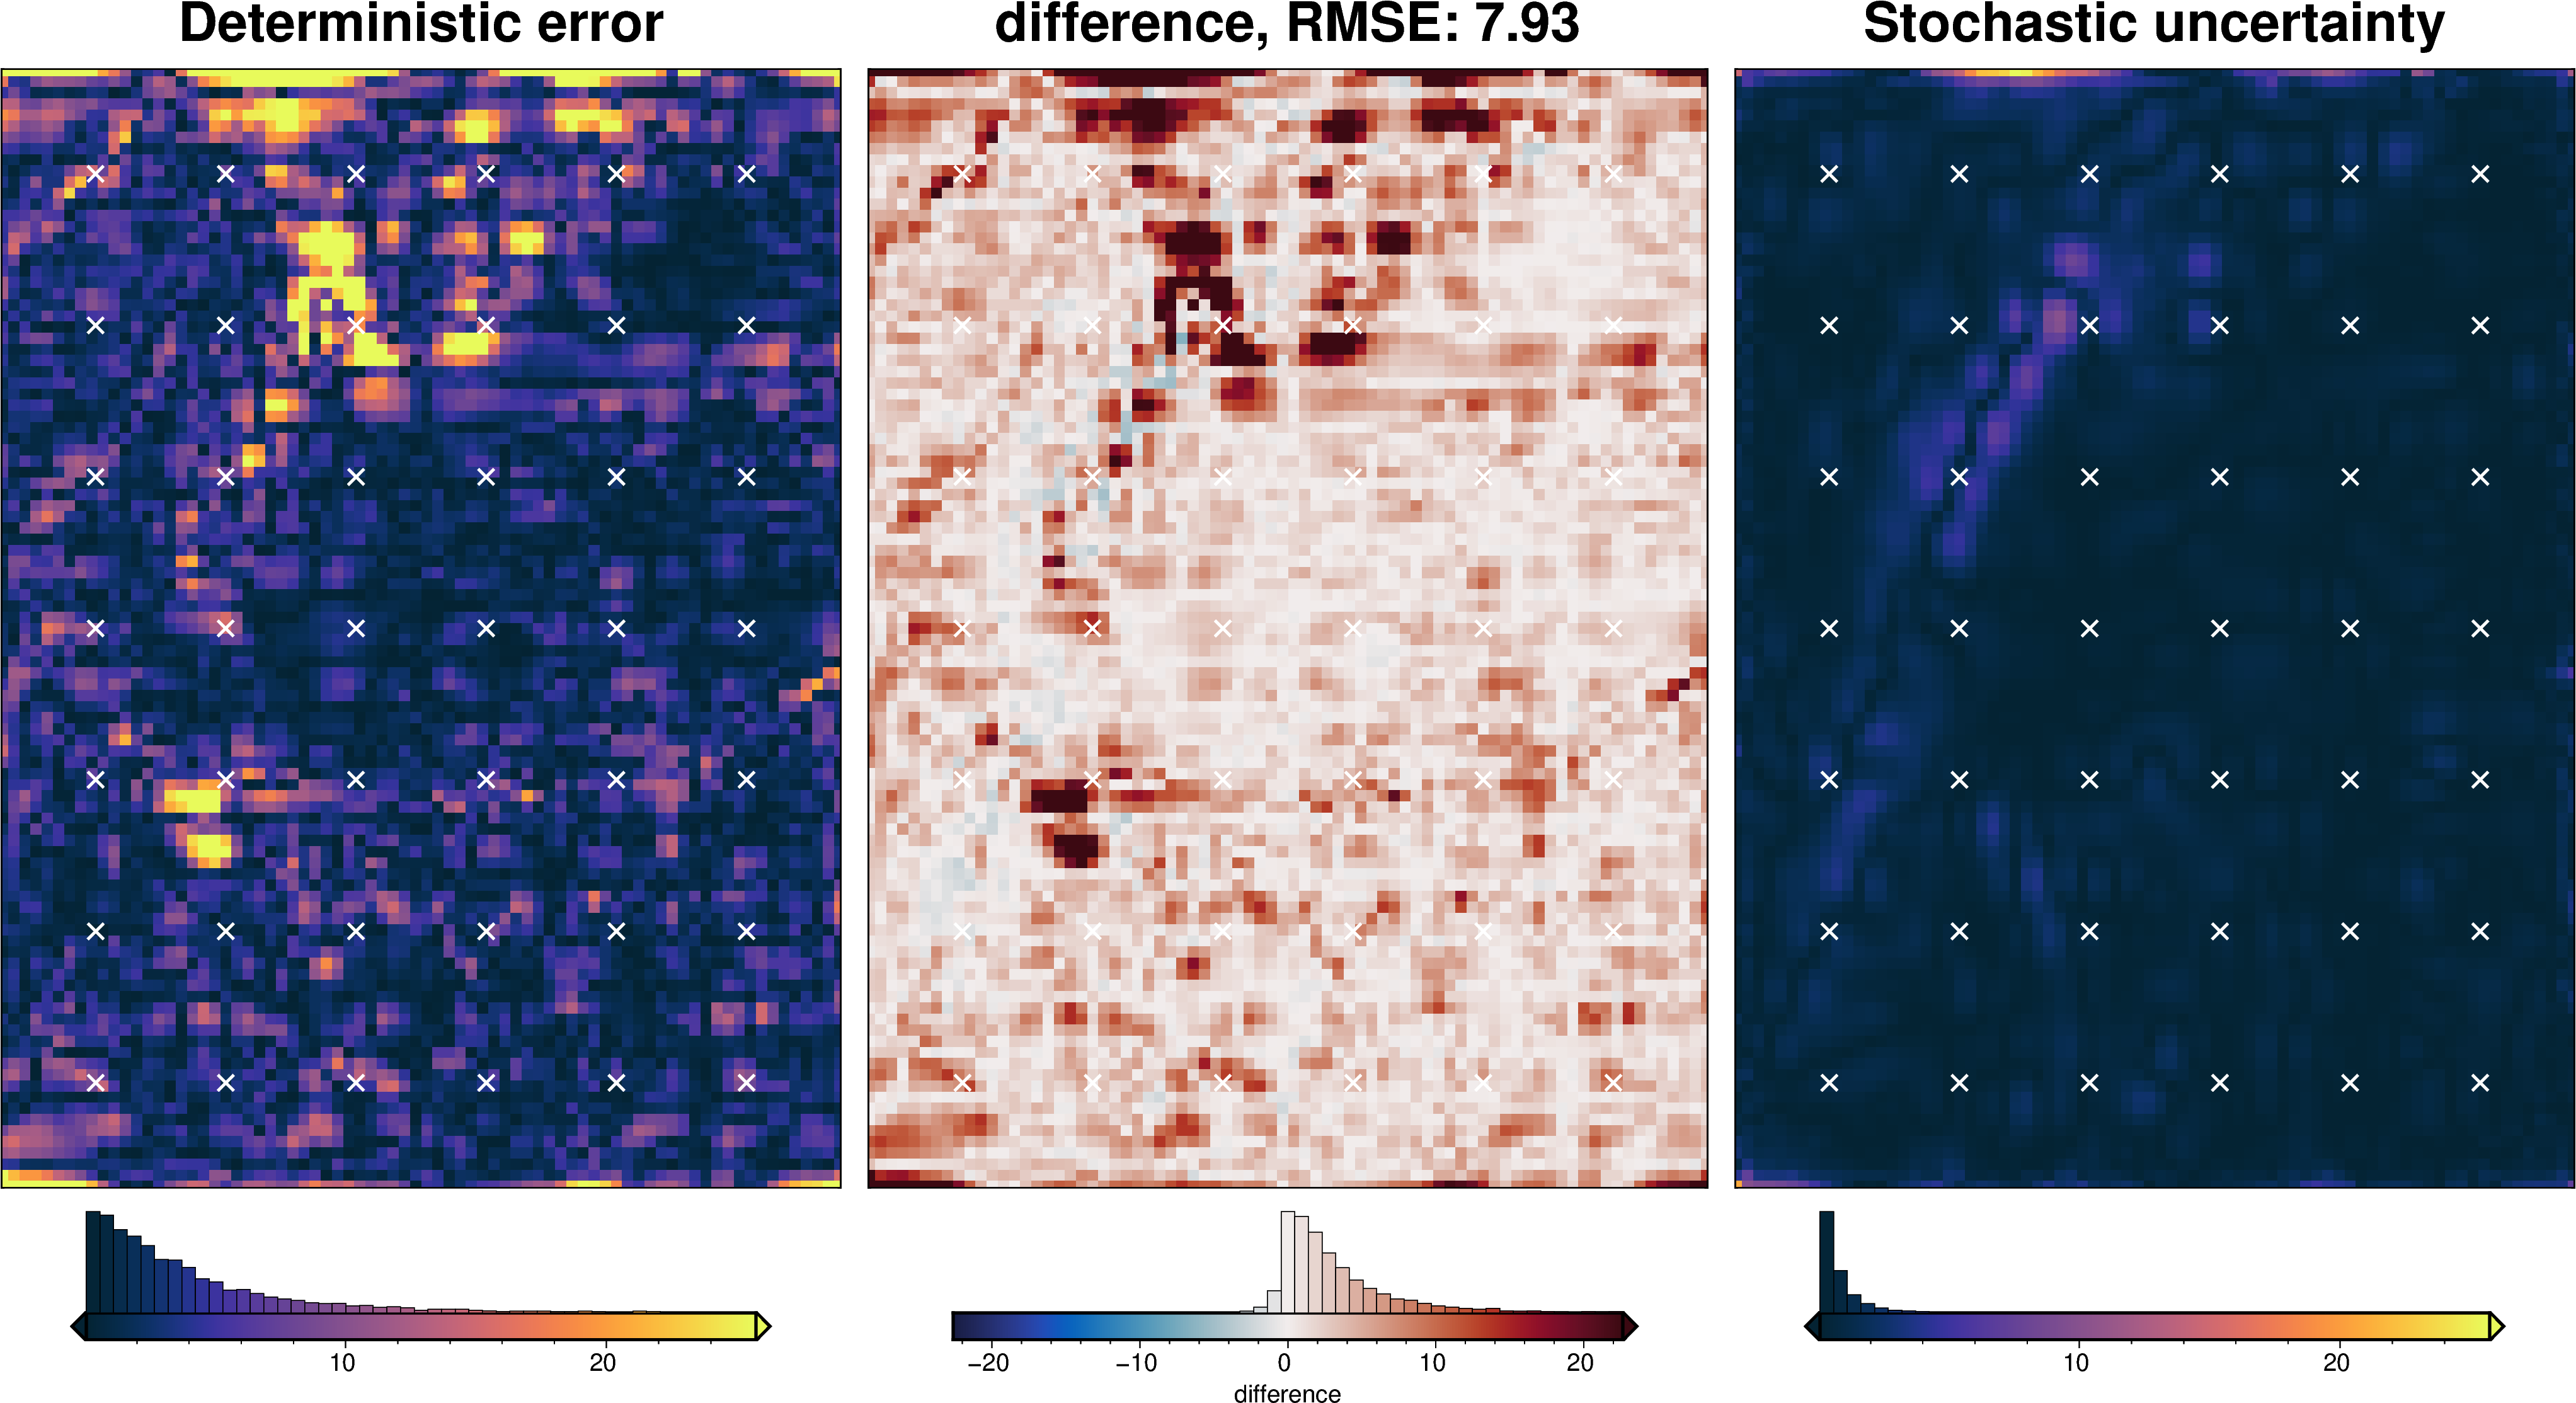
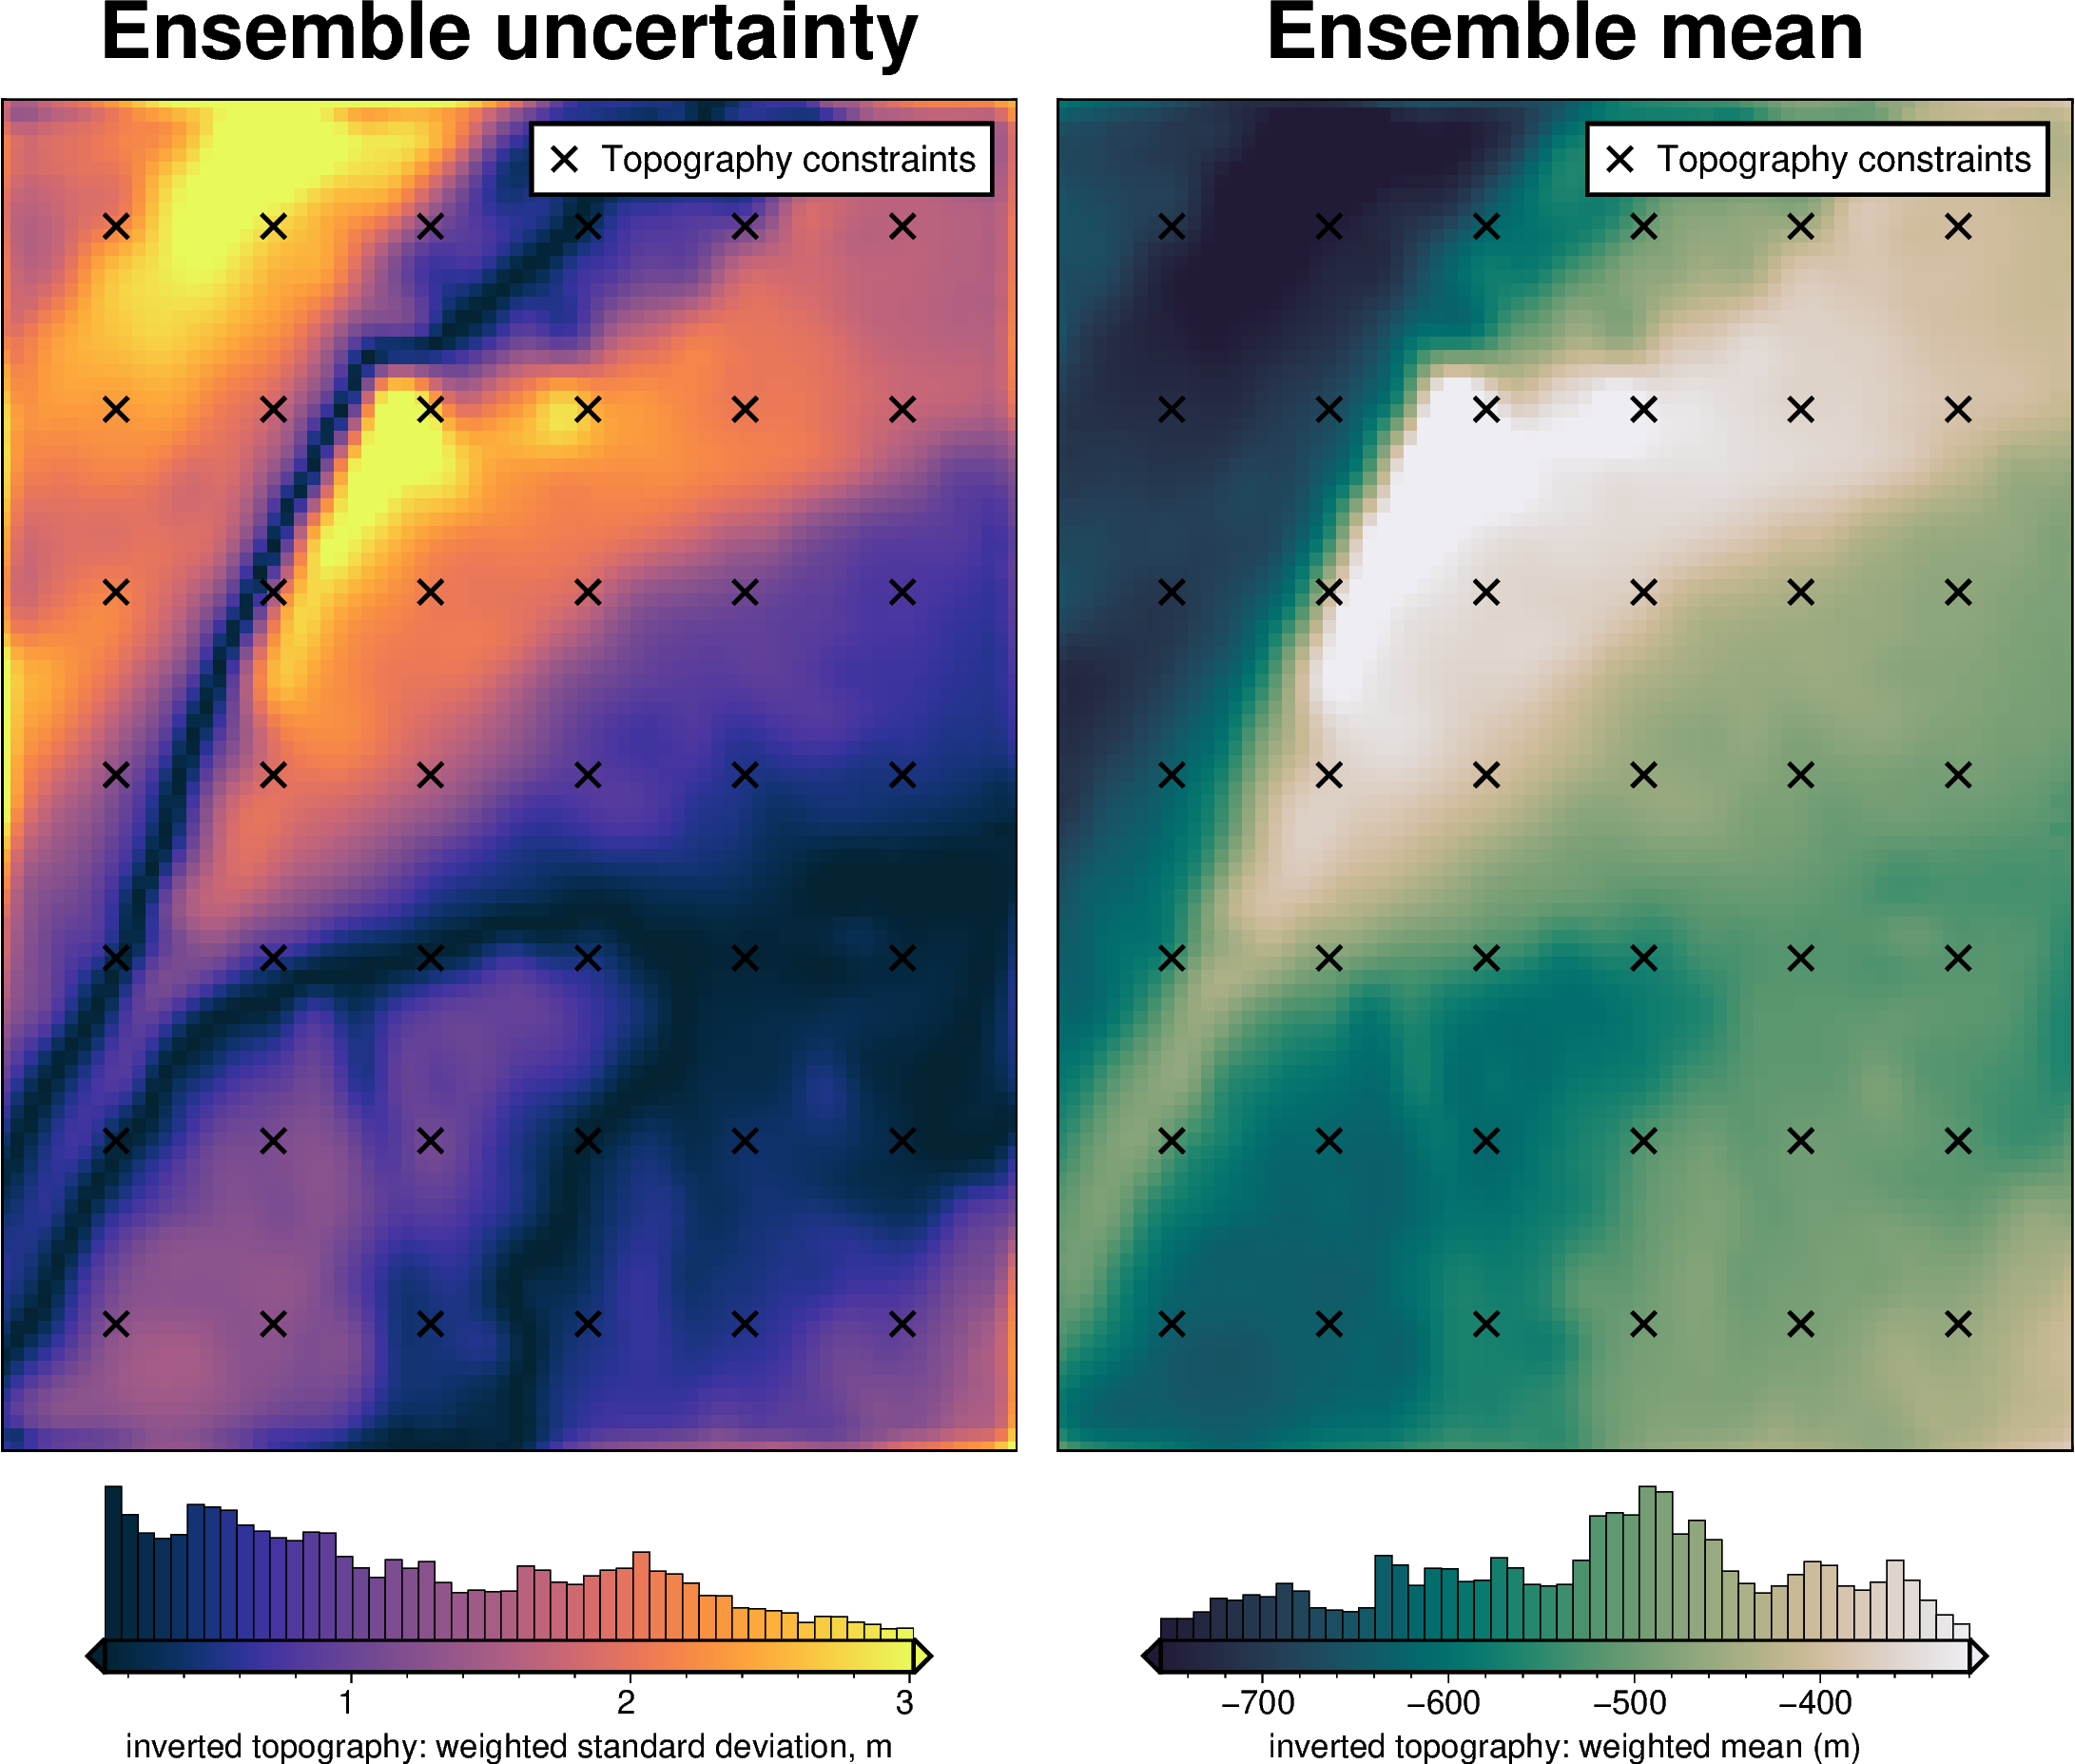
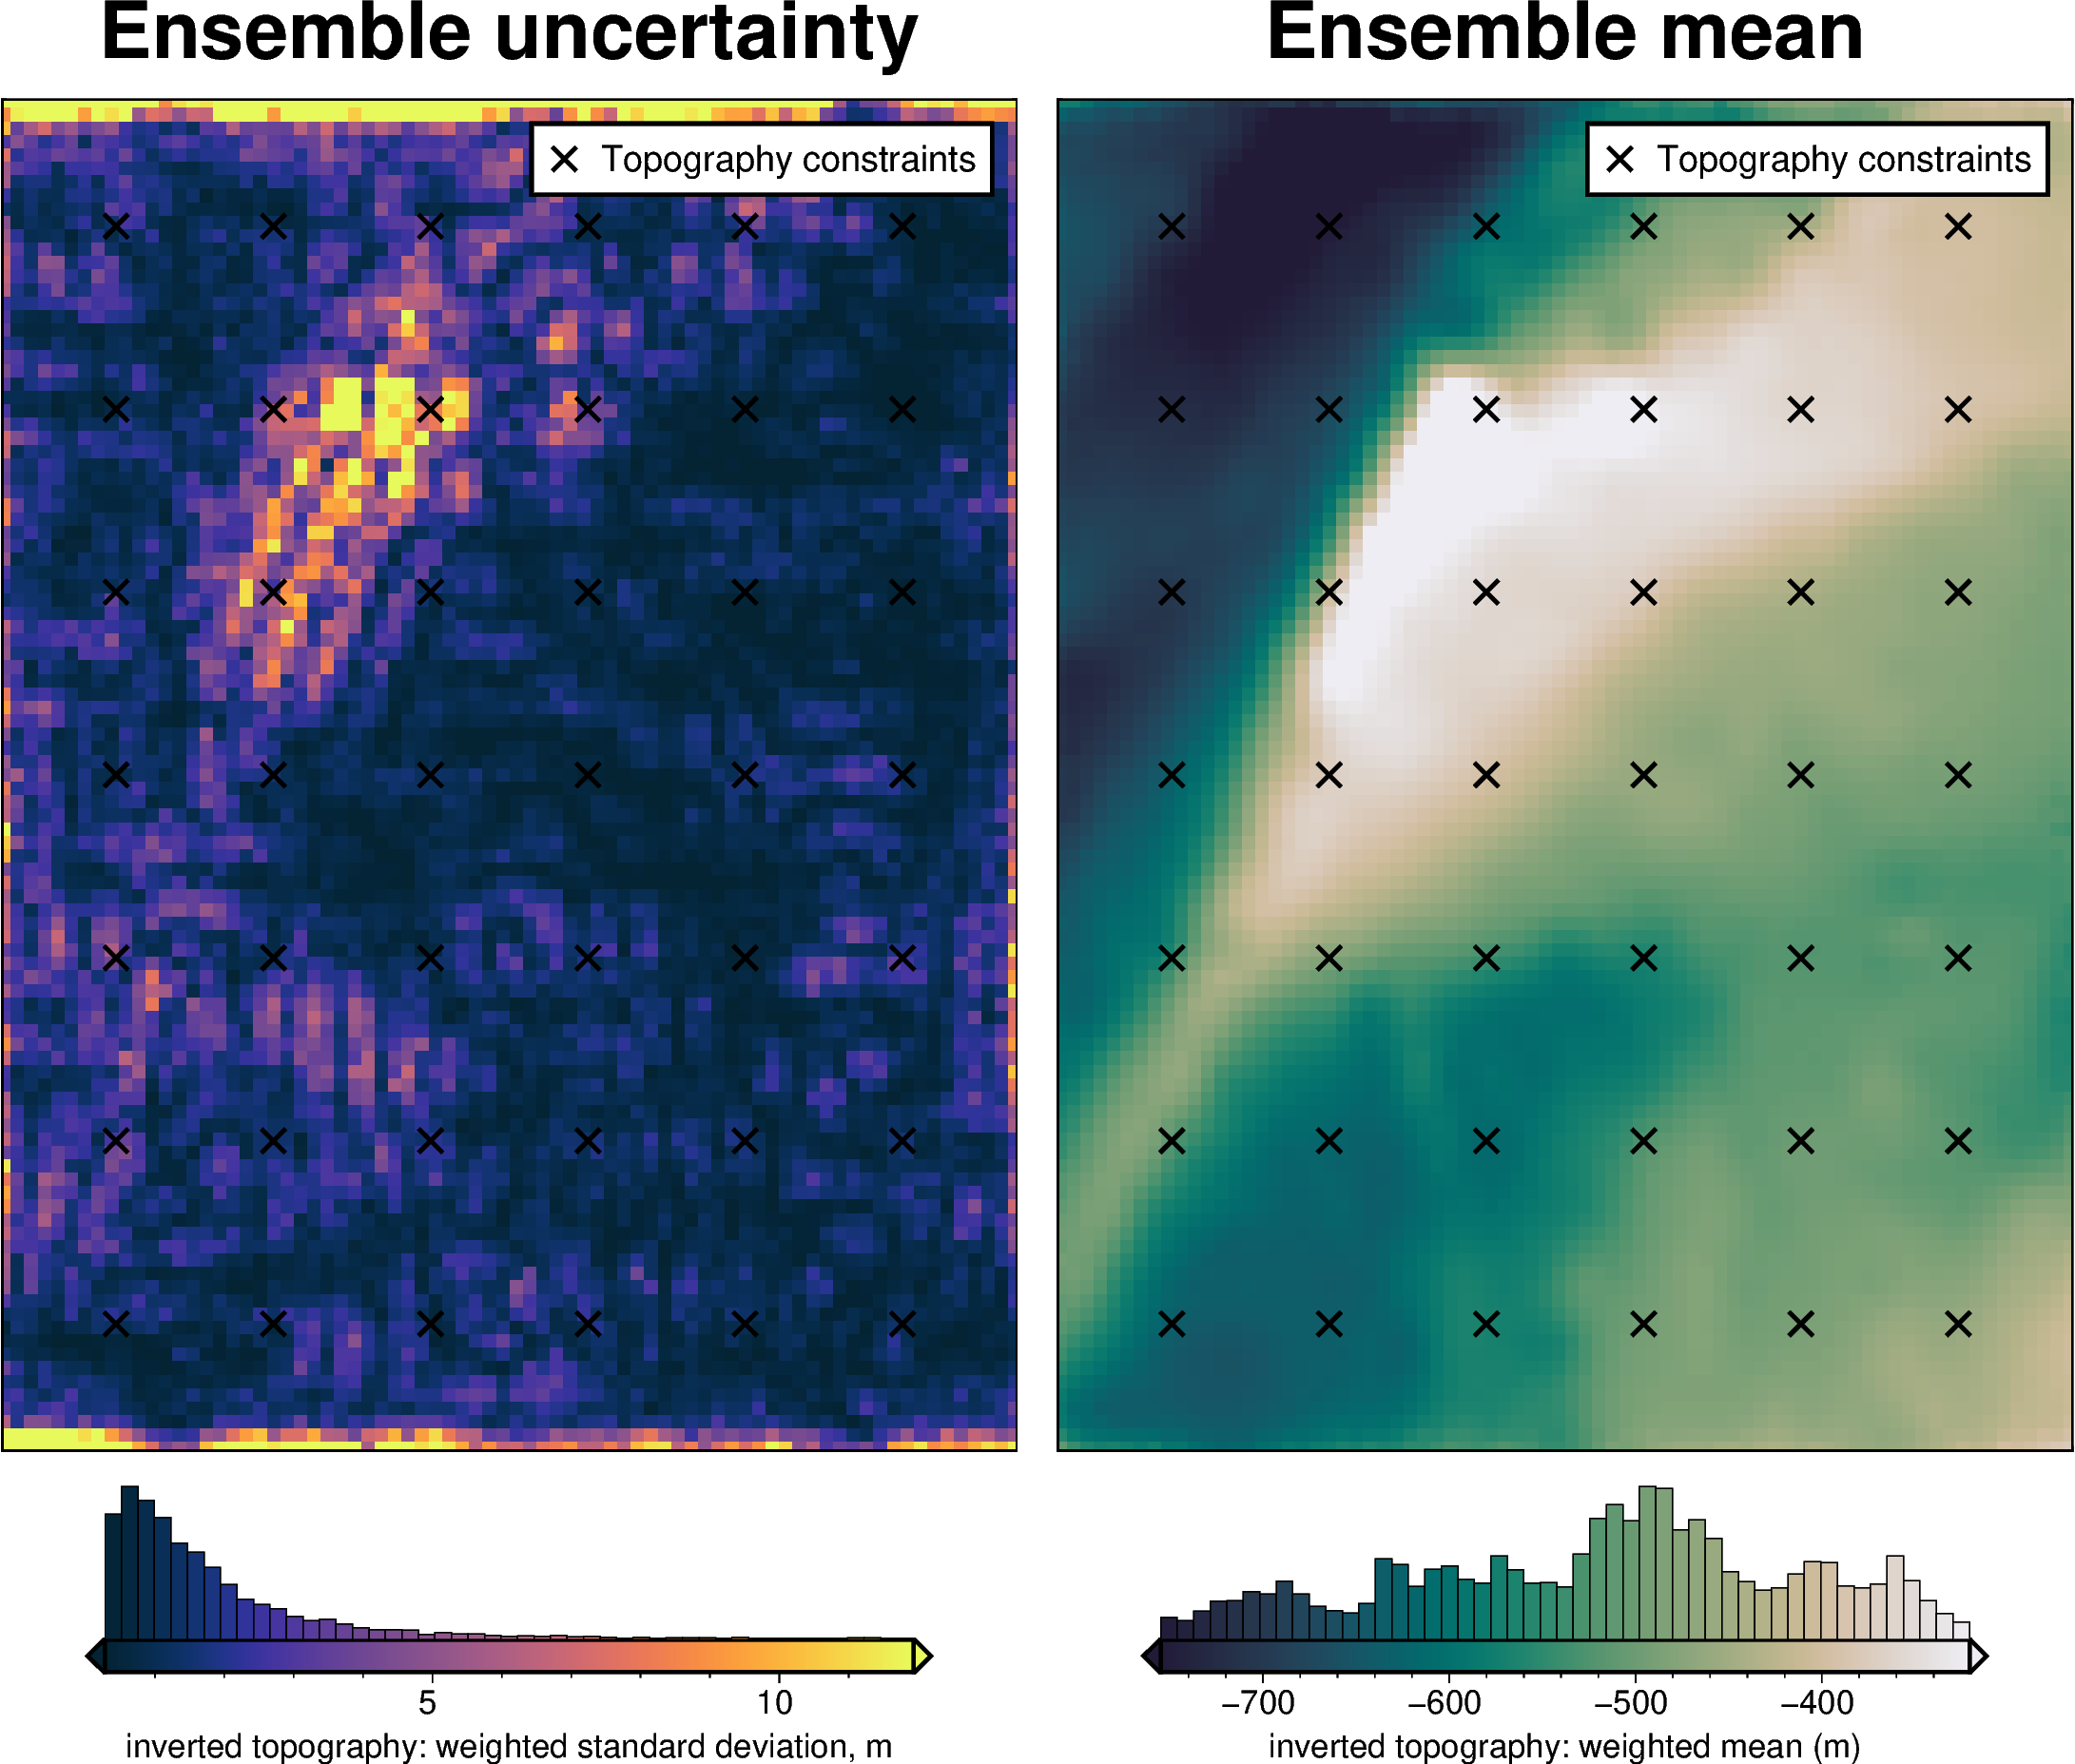
stats_ds = synth_plotting.uncert_plots(
uncert_damping_results,
inversion_region,
bathymetry,
deterministic_bathymetry=final_topography,
constraint_points=constraint_points[constraint_points.inside],
weight_by="constraints",
)

Density component
[55]:
# load study
with pathlib.Path(f"{fpath}_density_cv_zref_density_cv_study.pickle").open("rb") as f:
study = pickle.load(f)
study_df = study.trials_dataframe()
study_df = study_df.sort_values("value")
# calculate zscores of values
study_df["value_zscore"] = sp.stats.zscore(study_df["value"])
# drop outliers (values with zscore > |2|)
study_df2 = study_df[(np.abs(study_df.value_zscore) < 2)]
stdev = study_df2.params_density_contrast.std()
print(f"calculated stdev: {stdev}")
# manually pick a stdev
stdev = 20
print(f"using stdev: {stdev}")
print(
f"density estimation error: {np.abs(true_density_contrast - best_density_contrast)}"
)
calculated stdev: 422.705518719067
using stdev: 20
density estimation error: 12
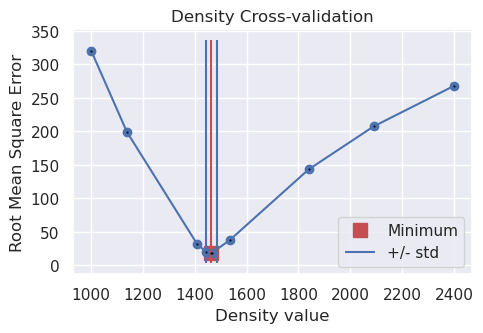
[56]:
fig = plotting.plot_cv_scores(
study.trials_dataframe().value.to_numpy(),
study.trials_dataframe().params_density_contrast.values,
param_name="Density",
logx=False,
logy=False,
)
ax = fig.axes[0]
best = study_df2.params_density_contrast.iloc[0]
upper = best + stdev
lower = best - stdev
y_lims = ax.get_ylim()
ax.vlines(best, ymin=y_lims[0], ymax=y_lims[1], color="r")
ax.vlines(upper, ymin=y_lims[0], ymax=y_lims[1], label="+/- std")
ax.vlines(lower, ymin=y_lims[0], ymax=y_lims[1])
x_lims = ax.get_xlim()
ax.set_xlim(
min(x_lims[0], lower),
max(x_lims[1], upper),
)
ax.legend()
print("best:", best, "\nstd:", stdev, "\n+1std:", upper, "\n-1std:", lower)
best: 1464
std: 20
+1std: 1484
-1std: 1444
[57]:
density_dict = {
"density_contrast": {
"distribution": "normal",
"loc": best_density_contrast,
"scale": stdev,
},
}
fname = f"{fpath}_uncertainty_density"
# delete files if already exist
for p in pathlib.Path().glob(f"{fname}*"):
p.unlink(missing_ok=True)
uncert_density_results = uncertainty.full_workflow_uncertainty_loop(
fname=fname,
runs=10,
parameter_dict=density_dict,
**uncert_kwargs,
)
stats_ds = synth_plotting.uncert_plots(
uncert_density_results,
inversion_region,
bathymetry,
deterministic_bathymetry=final_topography,
constraint_points=constraint_points[constraint_points.inside],
weight_by="constraints",
)

Equivalent source gridding component
[58]:
eqs.depth, eqs.damping
[58]:
(10002.265810449084, 0.0016430661458014173)
[1]:
import numpy as np
np.log10(0.0016430661458014173)
[1]:
np.float64(-2.7843449525854407)
[59]:
# grid the airborne survey data over the whole grid
coords = (grav_survey_df.easting, grav_survey_df.northing, grav_survey_df.upward)
data = grav_survey_df.gravity_anomaly
equivalent_source_parameter_dict = {
"depth": {
"distribution": "normal",
"loc": eqs.depth, # mean
"scale": eqs.depth / 4, # standard deviation
},
"damping": {
"log": True,
"distribution": "normal",
"loc": np.log10(
eqs.damping
), # mean of base 10 exponent, supply log10(value) here
"scale": 2,
},
}
eqs_kwargs = dict(block_size=spacing, damping=eqs.damping, depth=eqs.depth)
grd = grav_df.set_index(["northing", "easting"]).to_xarray()
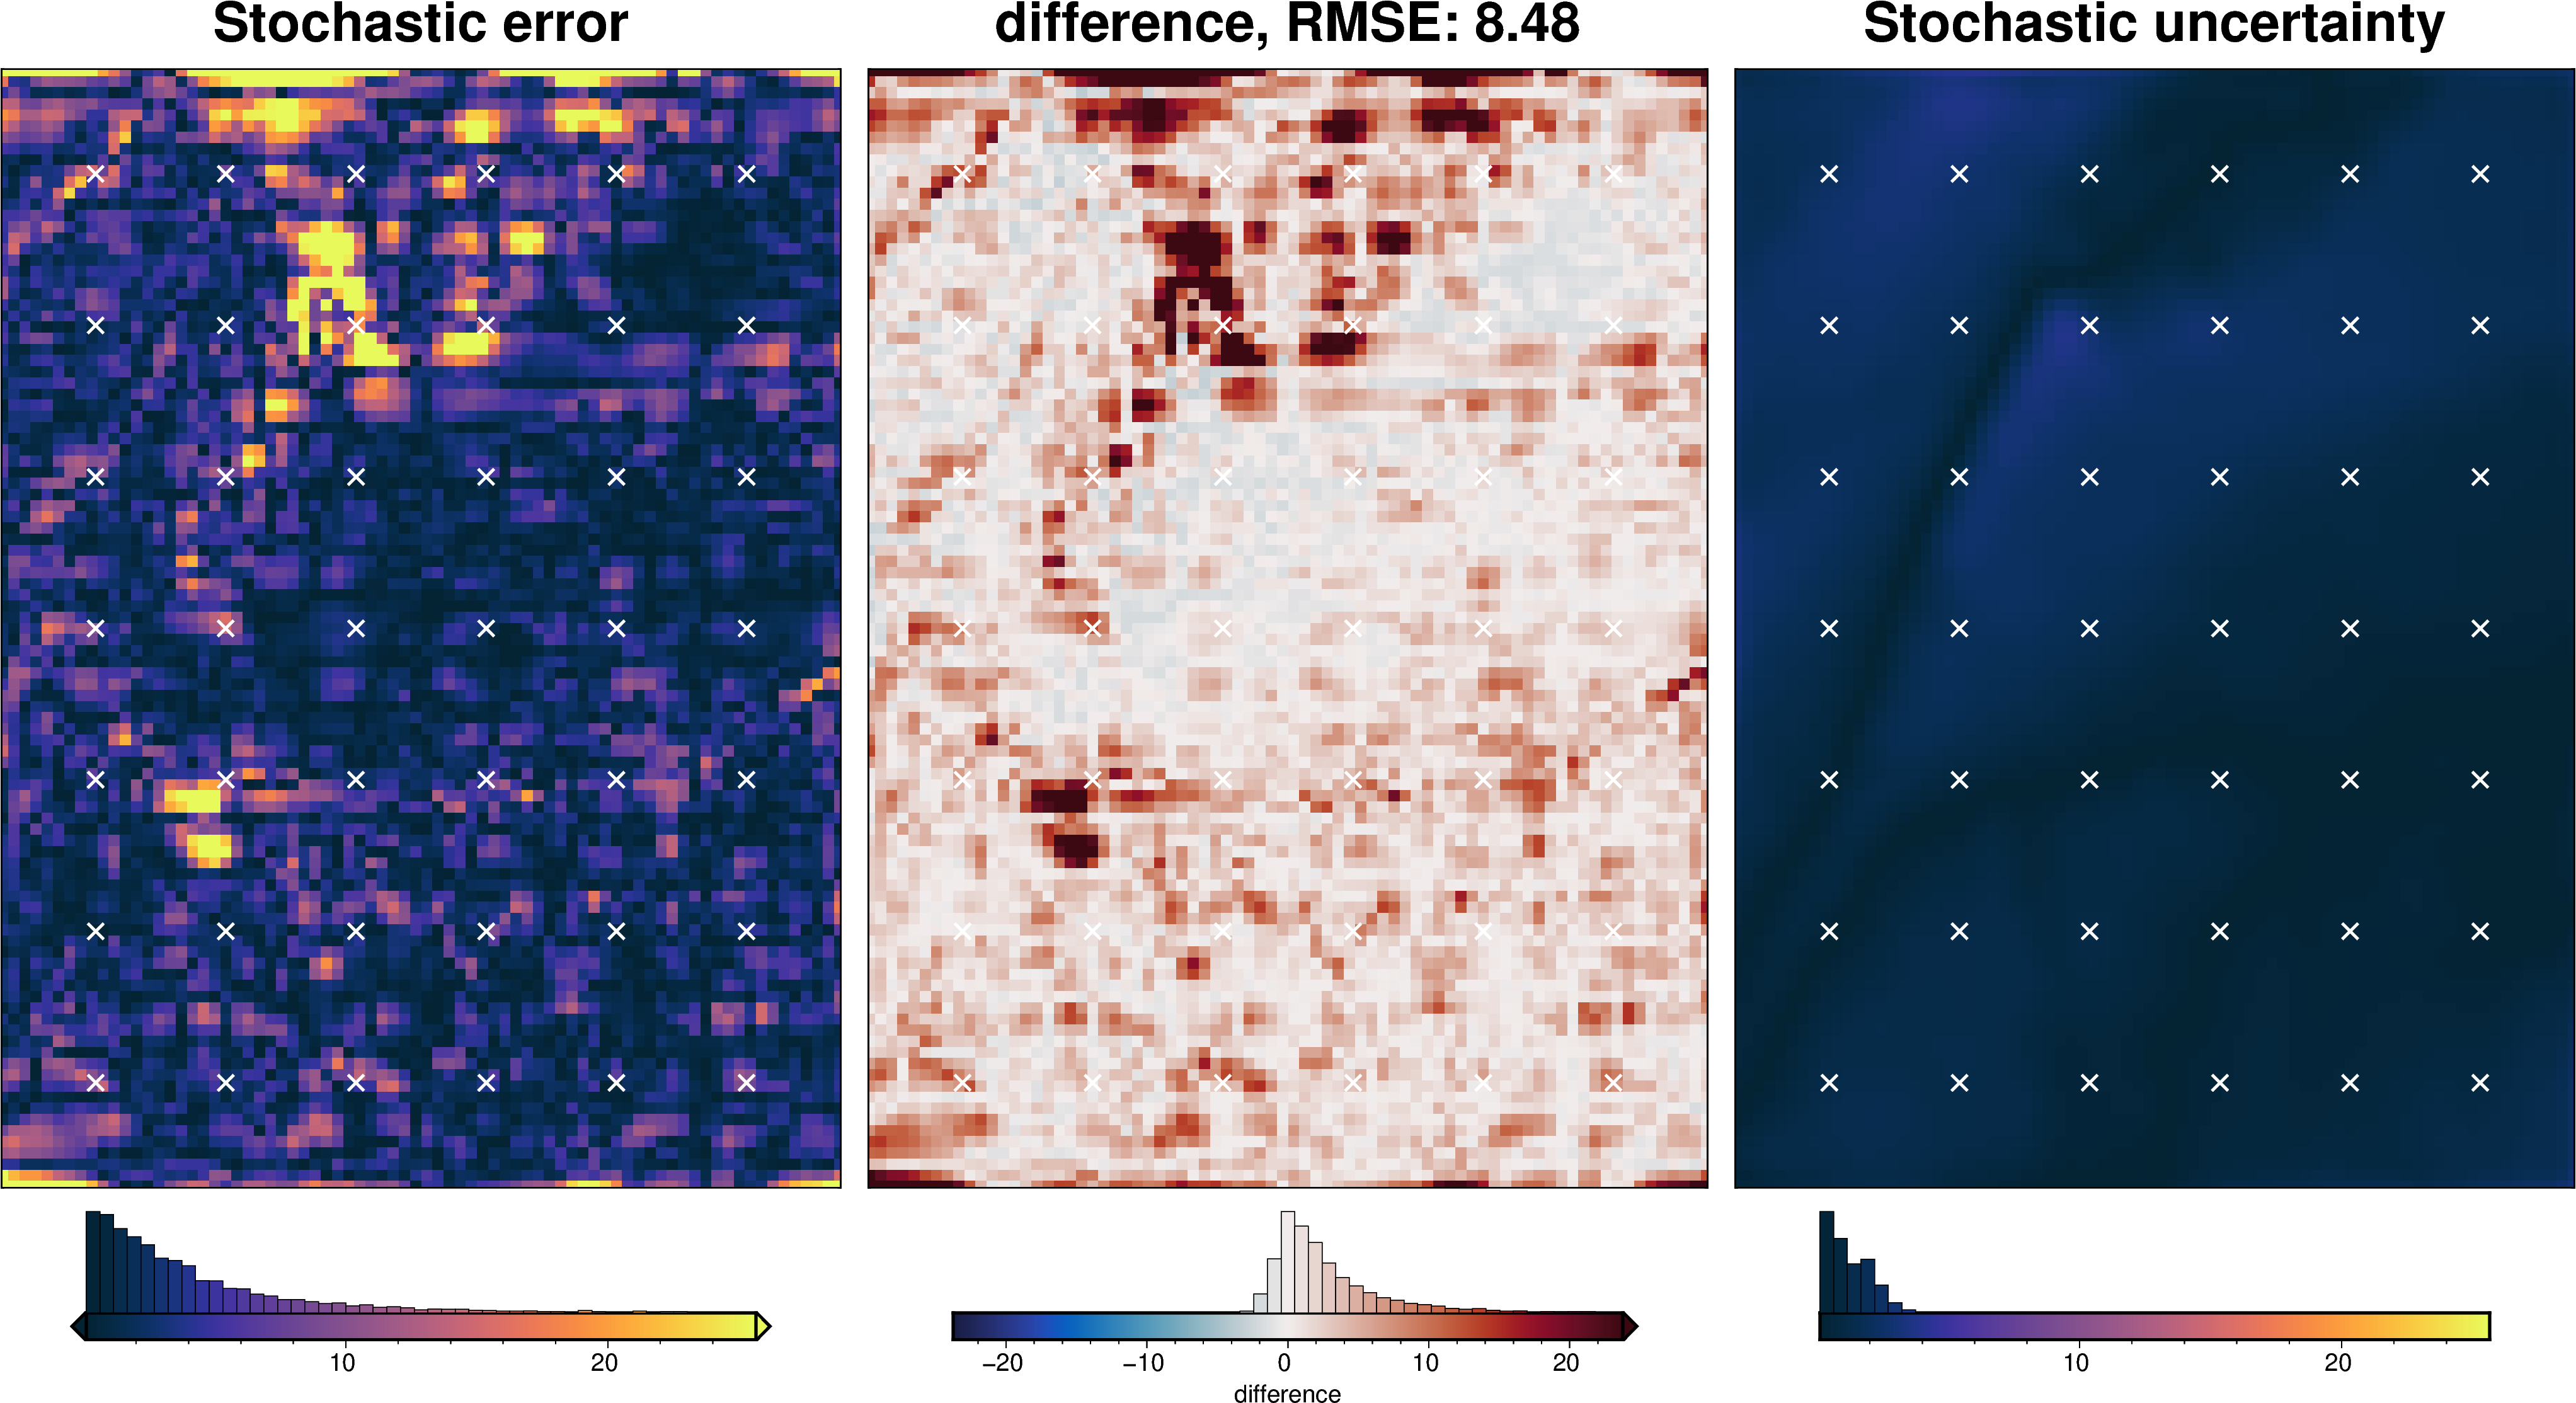
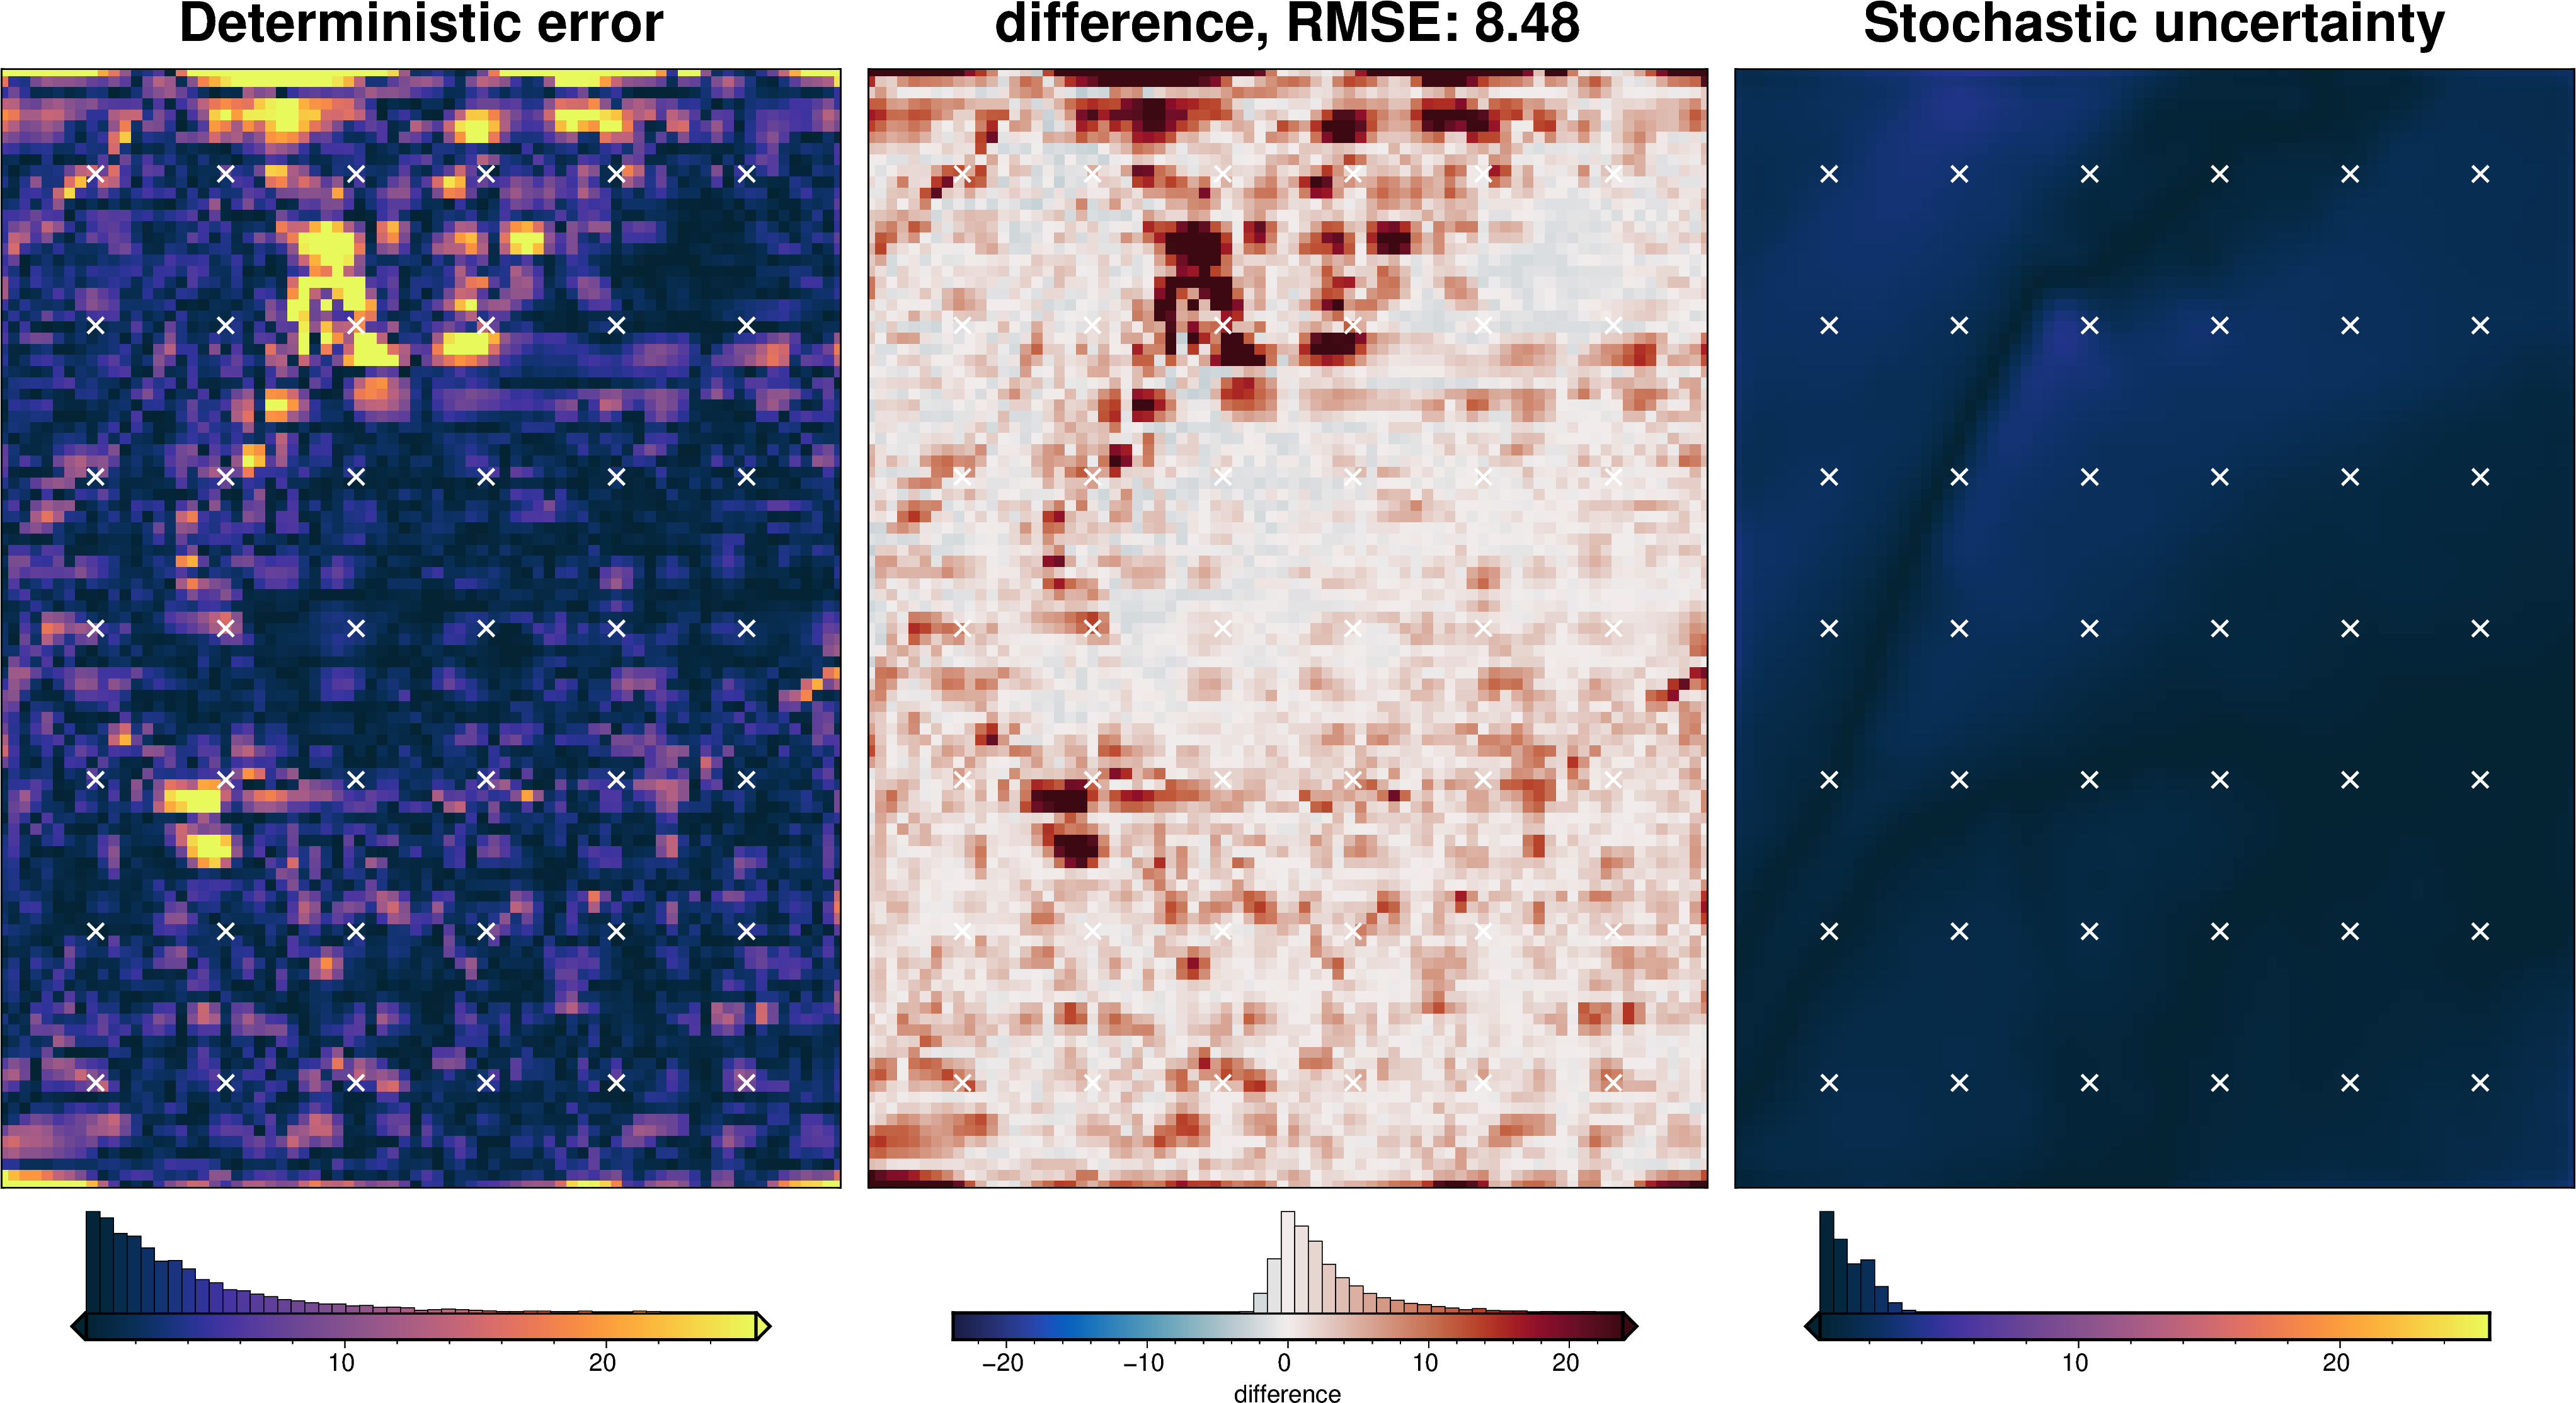
eqs_stats, _ = uncertainty.equivalent_sources_uncertainty(
runs=10,
data=data,
coords=coords,
grid_points=grav_df,
parameter_dict=equivalent_source_parameter_dict,
plot_region=inversion_region,
true_gravity=grd.gravity_anomaly_full_res,
deterministic_error=grd.gravity_anomaly_full_res - grd.gravity_anomaly,
**eqs_kwargs,
)
[60]:
grav_df = utils.sample_grids(
grav_df,
eqs_stats.z_stdev,
sampled_name="eqs_uncert",
coord_names=["easting", "northing"],
)
grav_df = utils.sample_grids(
grav_df,
eqs_stats.z_mean,
sampled_name="gravity_anomaly_eqs_mean",
coord_names=["easting", "northing"],
)
grav_df
[60]:
| northing | easting | upward | bathymetry_grav | basement_grav | disturbance | gravity_anomaly_full_res | eqs_gravity_anomaly | gravity_anomaly | starting_gravity | misfit | reg | res | predicted_grav | eqs_uncert | gravity_anomaly_eqs_mean | |
|---|---|---|---|---|---|---|---|---|---|---|---|---|---|---|---|---|
| 0 | -1600000.0 | -40000.0 | 1000.0 | -35.551055 | 0 | -35.551055 | -35.551055 | -33.273917 | -33.273917 | -35.289305 | 2.015388 | -0.2291 | 2.244487 | -32.866954 | 0.679666 | -33.125317 |
| 1 | -1600000.0 | -38000.0 | 1000.0 | -36.054657 | 0 | -36.054657 | -36.054657 | -33.983594 | -33.983594 | -35.749612 | 1.766018 | -0.2291 | 1.995117 | -33.558906 | 0.640888 | -33.856945 |
| 2 | -1600000.0 | -36000.0 | 1000.0 | -36.473147 | 0 | -36.473147 | -36.473147 | -34.554225 | -34.554225 | -36.163672 | 1.609447 | -0.2291 | 1.838546 | -34.134524 | 0.630313 | -34.440243 |
| 3 | -1600000.0 | -34000.0 | 1000.0 | -36.755609 | 0 | -36.755609 | -36.755609 | -35.014135 | -35.014135 | -36.485586 | 1.471451 | -0.2291 | 1.700551 | -34.604643 | 0.615711 | -34.902172 |
| 4 | -1600000.0 | -32000.0 | 1000.0 | -36.951029 | 0 | -36.951029 | -36.951029 | -35.365702 | -35.365702 | -36.697668 | 1.331966 | -0.2291 | 1.561066 | -34.970598 | 0.589974 | -35.250641 |
| ... | ... | ... | ... | ... | ... | ... | ... | ... | ... | ... | ... | ... | ... | ... | ... | ... |
| 7671 | -1400000.0 | 102000.0 | 1000.0 | -25.760090 | 0 | -25.760090 | -25.760090 | -24.851786 | -24.851786 | -25.290878 | 0.439091 | -0.2291 | 0.668191 | -24.645140 | 0.310813 | -24.787649 |
| 7672 | -1400000.0 | 104000.0 | 1000.0 | -25.911429 | 0 | -25.911429 | -25.911429 | -24.853220 | -24.853220 | -25.465050 | 0.611830 | -0.2291 | 0.840929 | -24.638210 | 0.336113 | -24.790991 |
| 7673 | -1400000.0 | 106000.0 | 1000.0 | -26.032814 | 0 | -26.032814 | -26.032814 | -24.843369 | -24.843369 | -25.598964 | 0.755595 | -0.2291 | 0.984695 | -24.612773 | 0.356042 | -24.773582 |
| 7674 | -1400000.0 | 108000.0 | 1000.0 | -26.121903 | 0 | -26.121903 | -26.121903 | -24.781222 | -24.781222 | -25.693927 | 0.912705 | -0.2291 | 1.141805 | -24.539817 | 0.379788 | -24.692001 |
| 7675 | -1400000.0 | 110000.0 | 1000.0 | -26.206160 | 0 | -26.206160 | -26.206160 | -24.608107 | -24.608107 | -25.770499 | 1.162392 | -0.2291 | 1.391491 | -24.379383 | 0.433861 | -24.492643 |
7676 rows × 16 columns
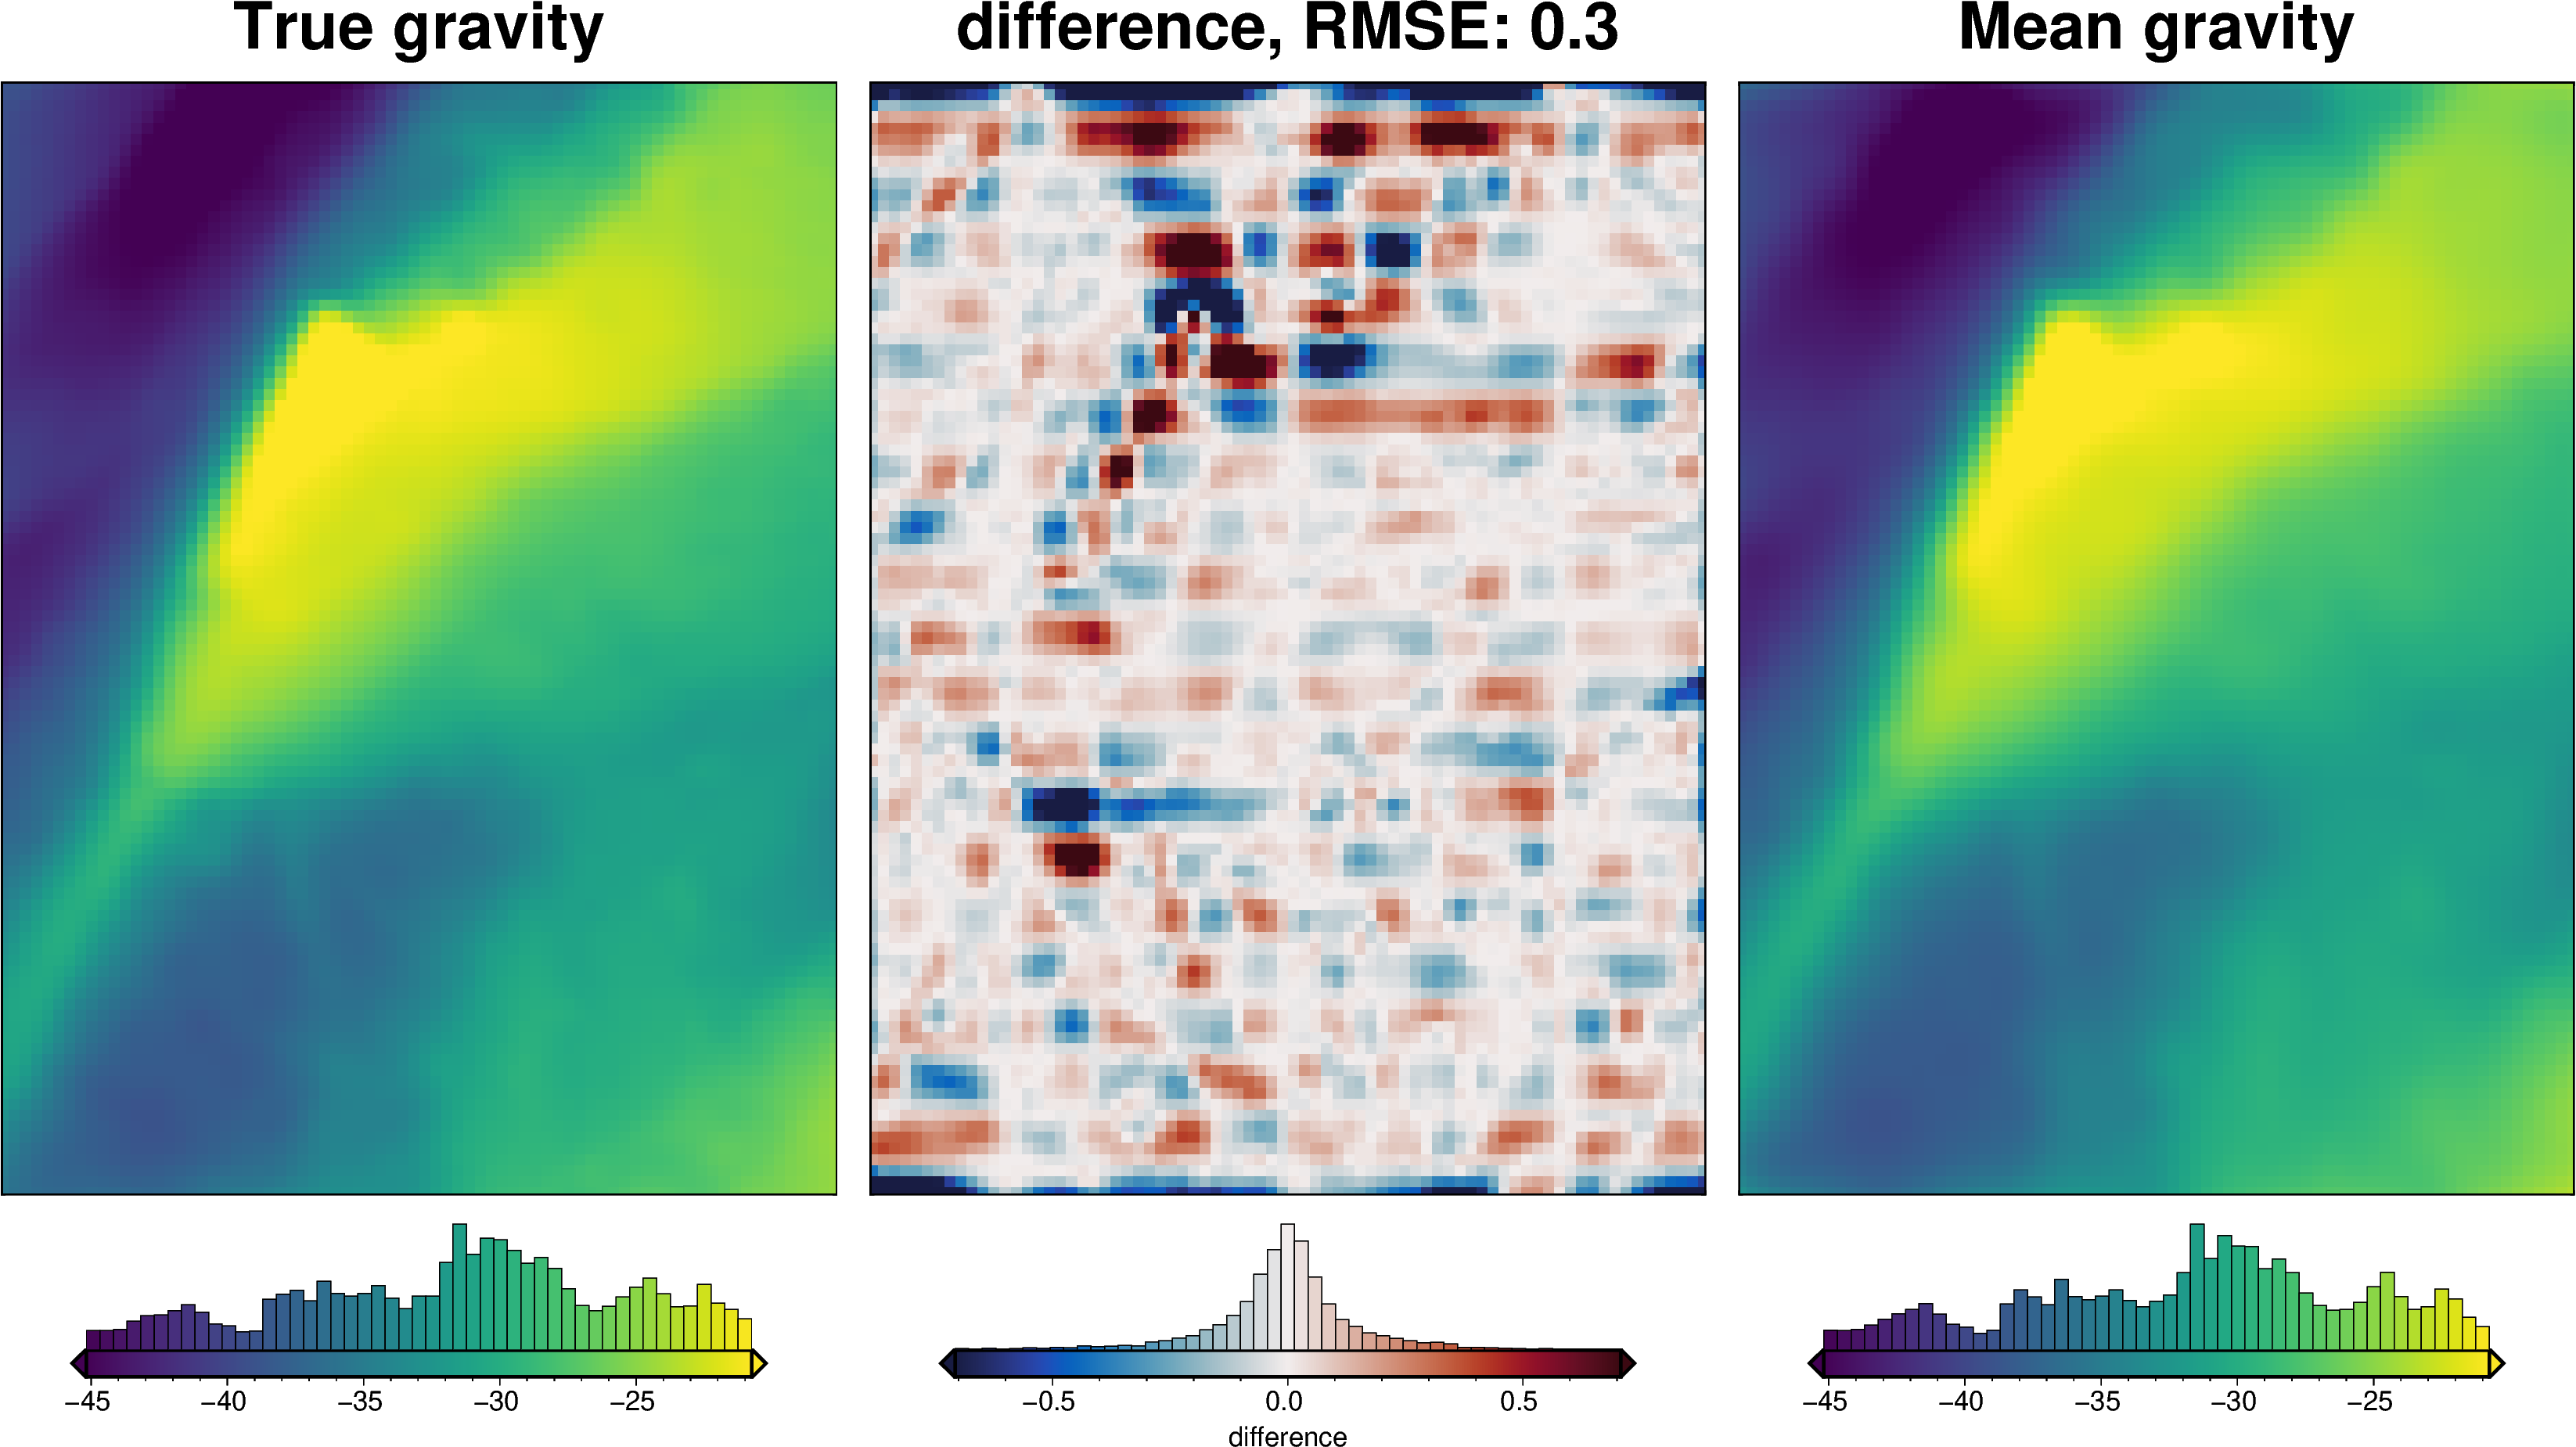
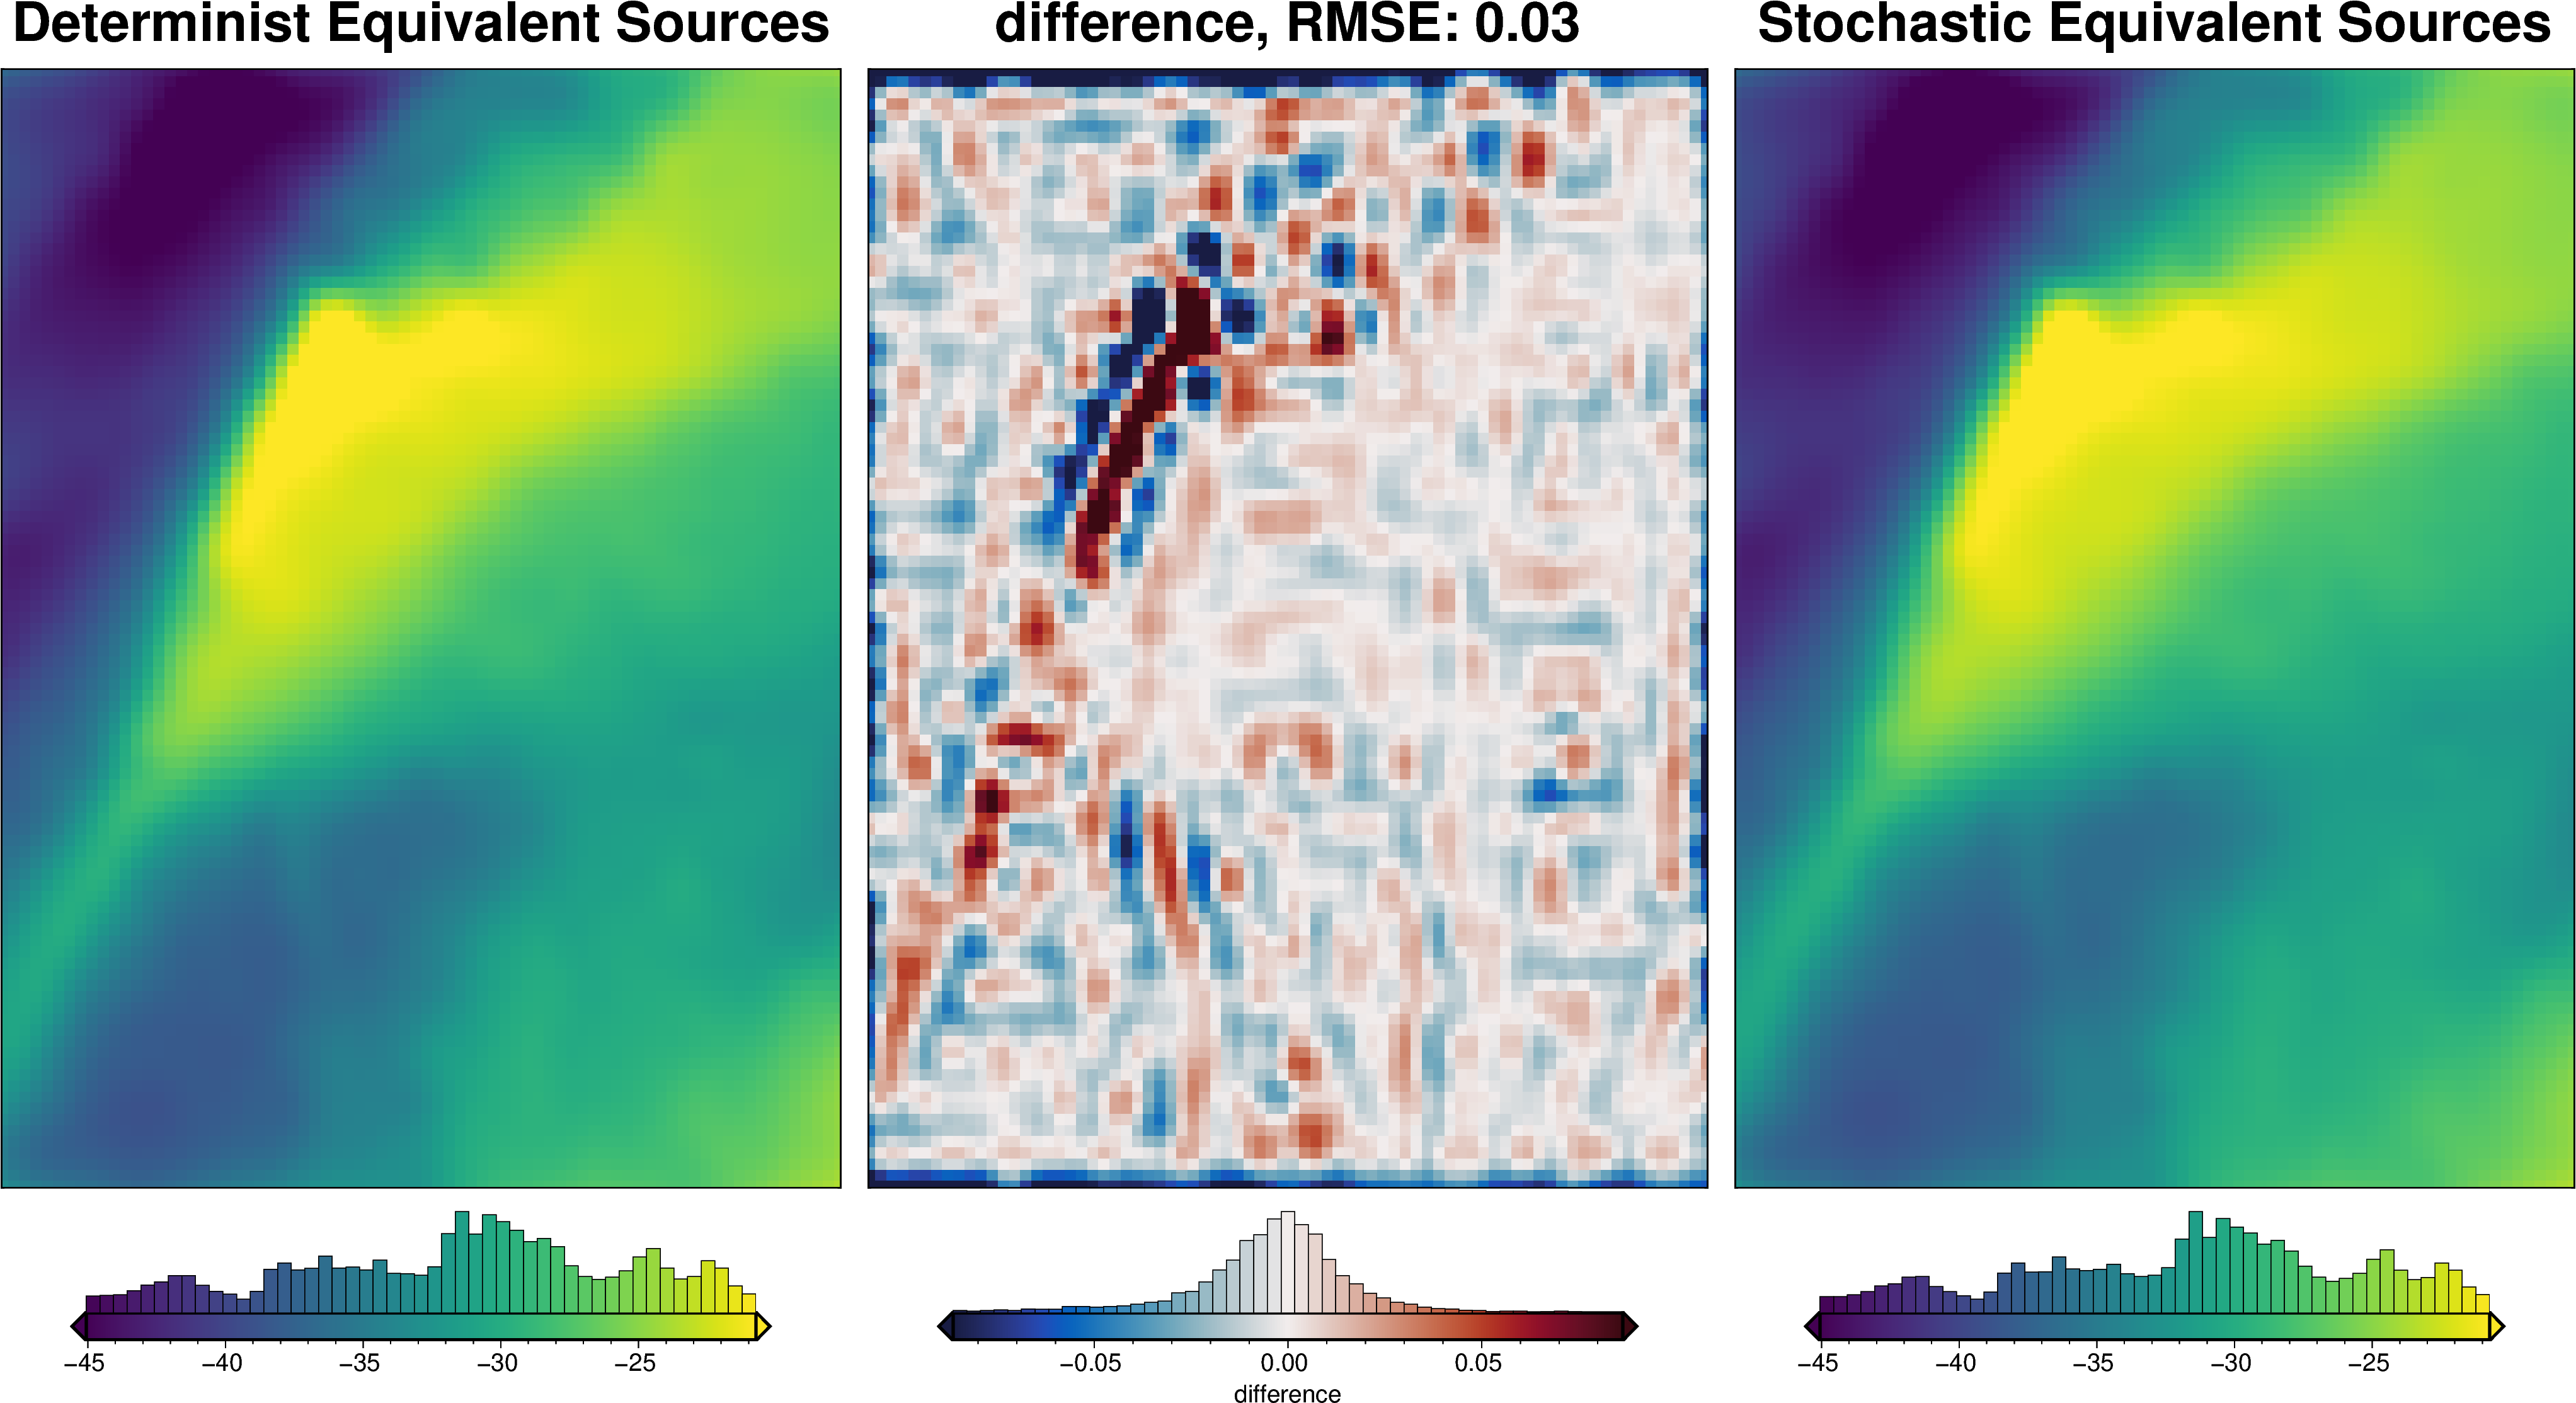
[61]:
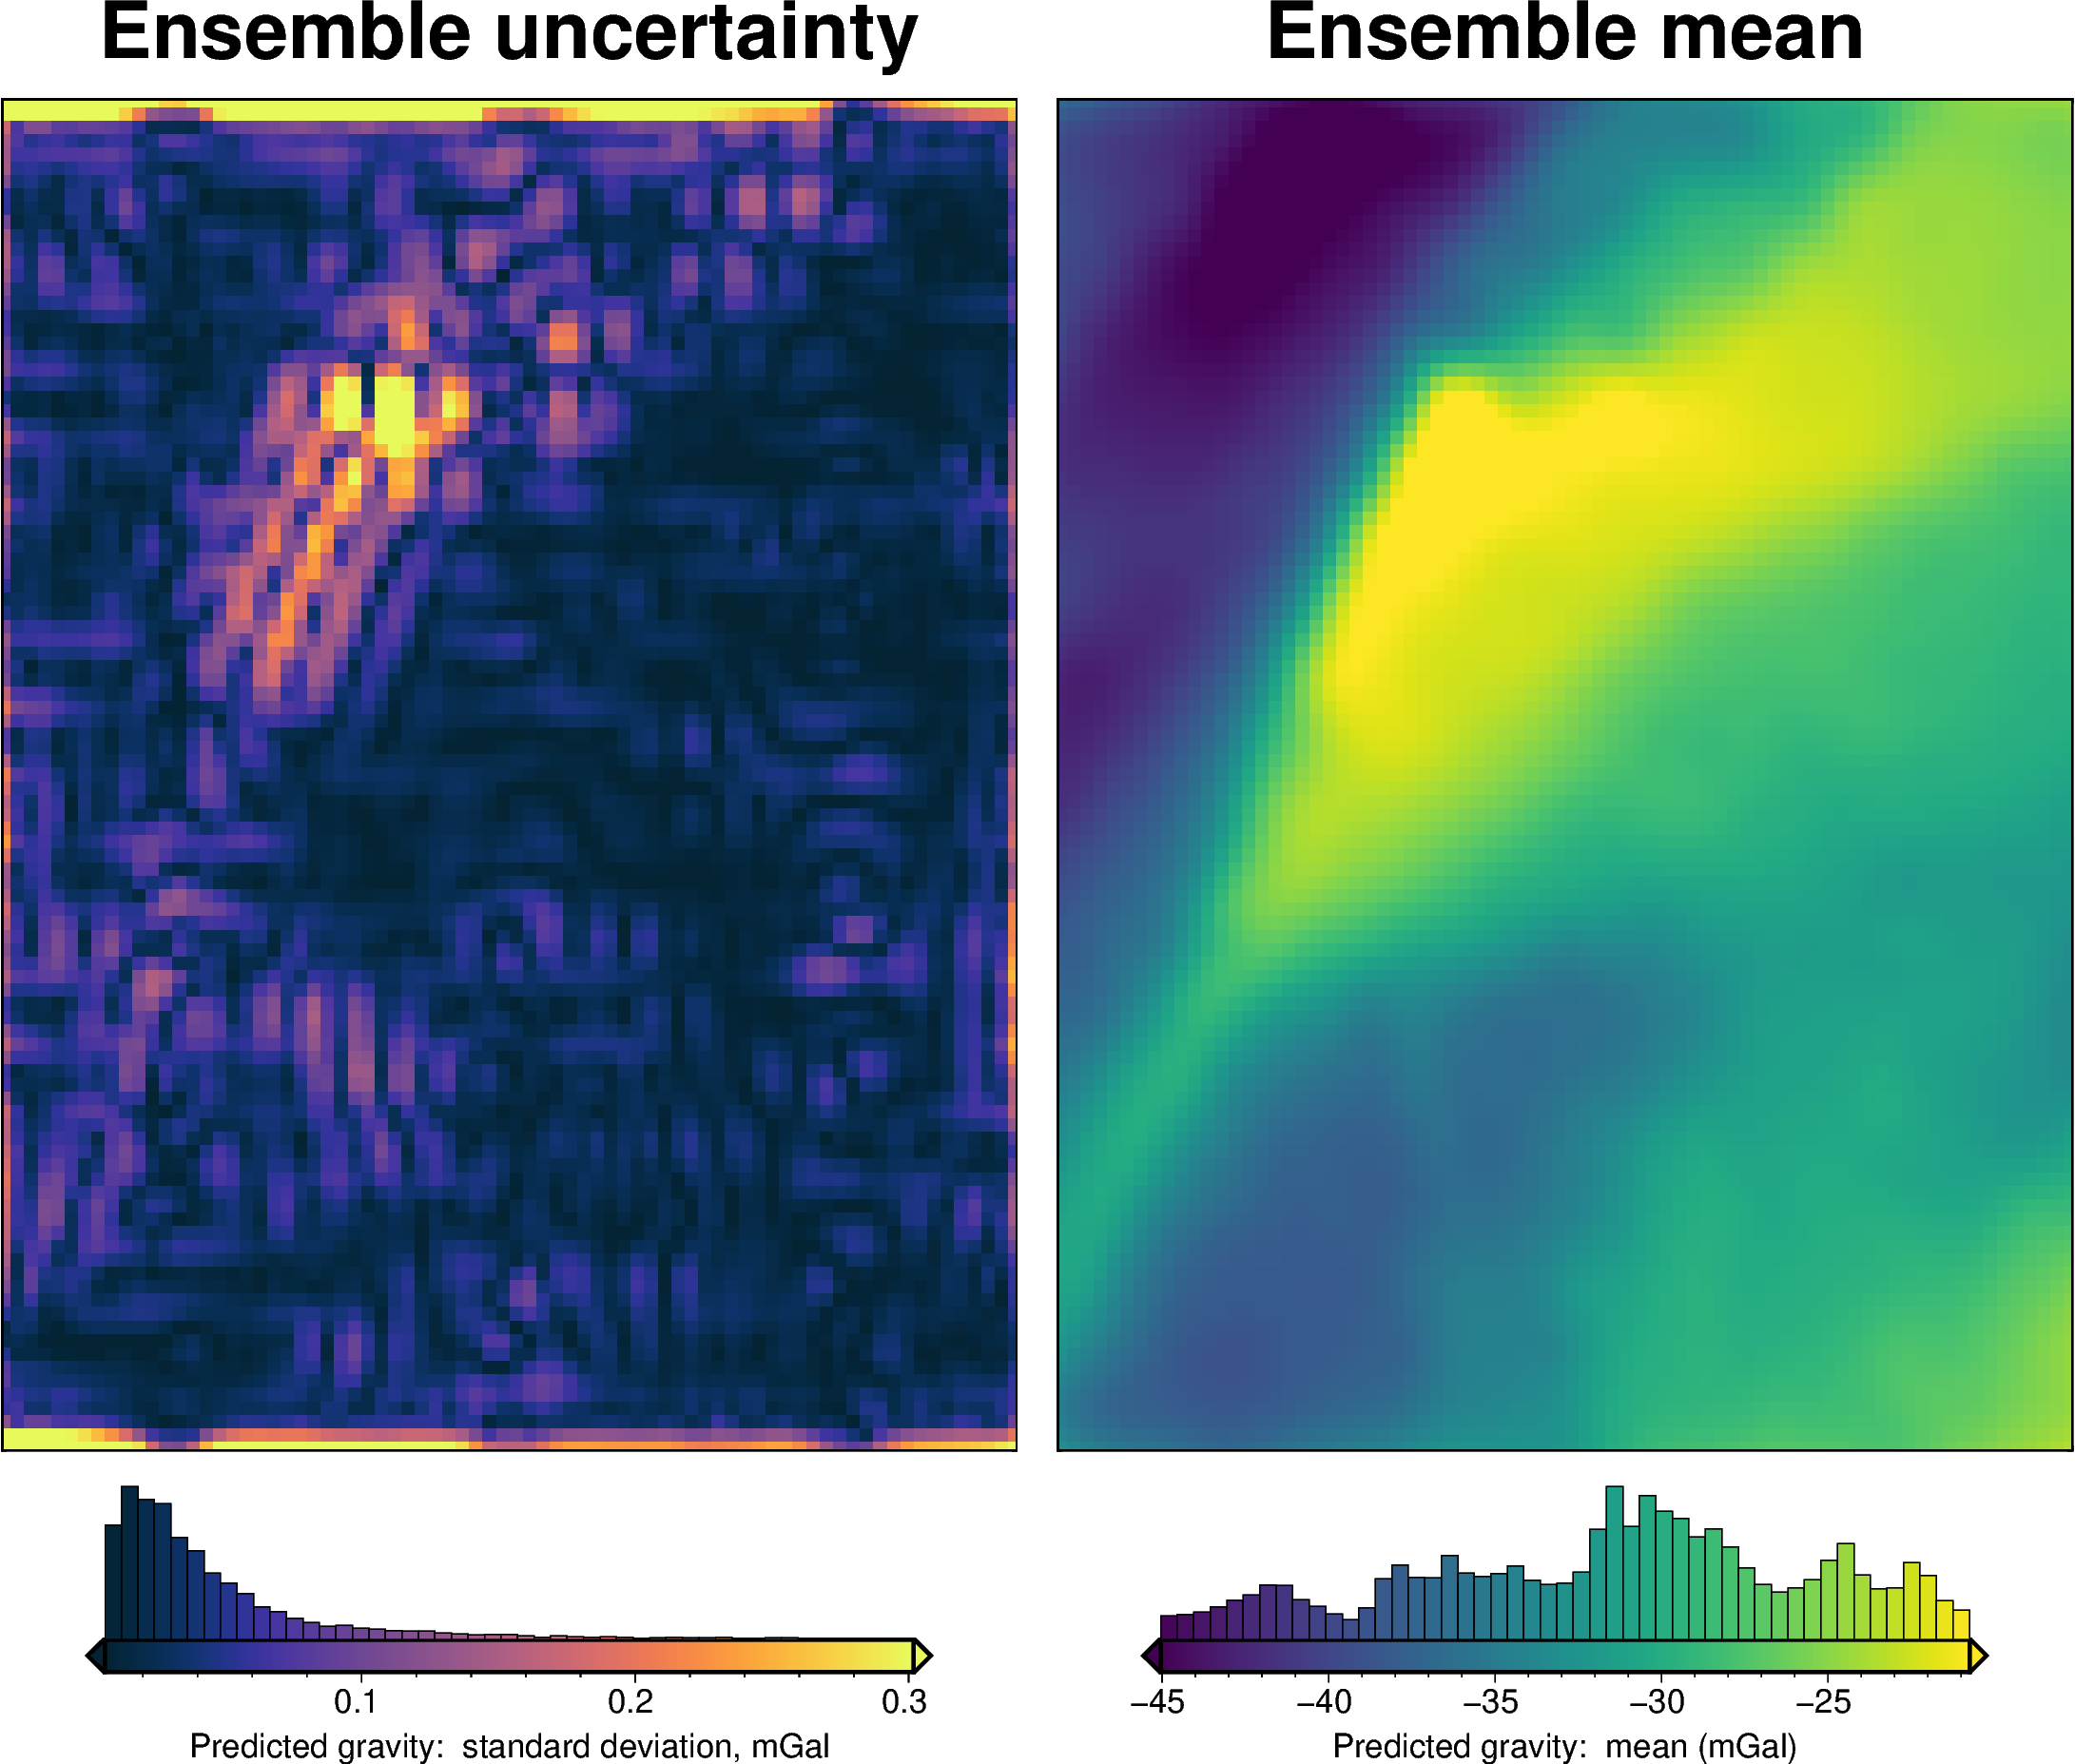
grav_grid = grav_df.set_index(["northing", "easting"]).to_xarray()
_ = polar_utils.grd_compare(
grav_grid.gravity_anomaly,
grav_grid.gravity_anomaly_eqs_mean,
region=inversion_region,
plot=True,
grid1_name="Determinist Equivalent Sources",
grid2_name="Stochastic Equivalent Sources",
robust=True,
hist=True,
inset=False,
verbose="q",
title="difference",
grounding_line=False,
)
maps.plot_grd(
grav_grid.eqs_uncert,
region=inversion_region,
fig_height=10,
title="Stochastic uncertainty",
cmap="thermal",
hist=True,
robust=True,
cbar_label="mGal",
)
[61]:

[62]:
# update grav_df and rename columns
grav_df_eqs = grav_df.copy()
grav_df_eqs = grav_df_eqs.rename(
columns={
"gravity_anomaly": "gravity_anomaly_deterministic",
"uncert": "uncert_constant",
}
)
grav_df_eqs["gravity_anomaly"] = grav_df_eqs.gravity_anomaly_eqs_mean
grav_df_eqs["uncert"] = grav_df_eqs.eqs_uncert
uncert_kwargs["grav_df"] = grav_df_eqs
[63]:
grav_df_eqs.uncert.mean()
[63]:
np.float64(0.05353783539180543)
[64]:
grav_df_eqs = regional.regional_separation(
grav_df=grav_df_eqs,
**regional_grav_kwargs,
)
# kwargs to reuse for all uncertainty analyses
eqs_uncert_kwargs = dict(
grav_df=grav_df_eqs,
density_contrast=best_density_contrast,
zref=zref,
starting_prisms=starting_prisms,
starting_topography=starting_bathymetry,
regional_grav_kwargs=regional_grav_kwargs,
**kwargs,
)
[65]:
# save to csv
grav_df_eqs.to_csv(f"{fpath}_grav_df.csv", index=False)
[66]:
fname = f"{fpath}_uncertainty_eq_sources"
# delete files if already exist
for p in pathlib.Path().glob(f"{fname}*"):
p.unlink(missing_ok=True)
uncert_eq_sources_results = uncertainty.full_workflow_uncertainty_loop(
fname=fname,
runs=10,
sample_gravity=True,
**eqs_uncert_kwargs,
)
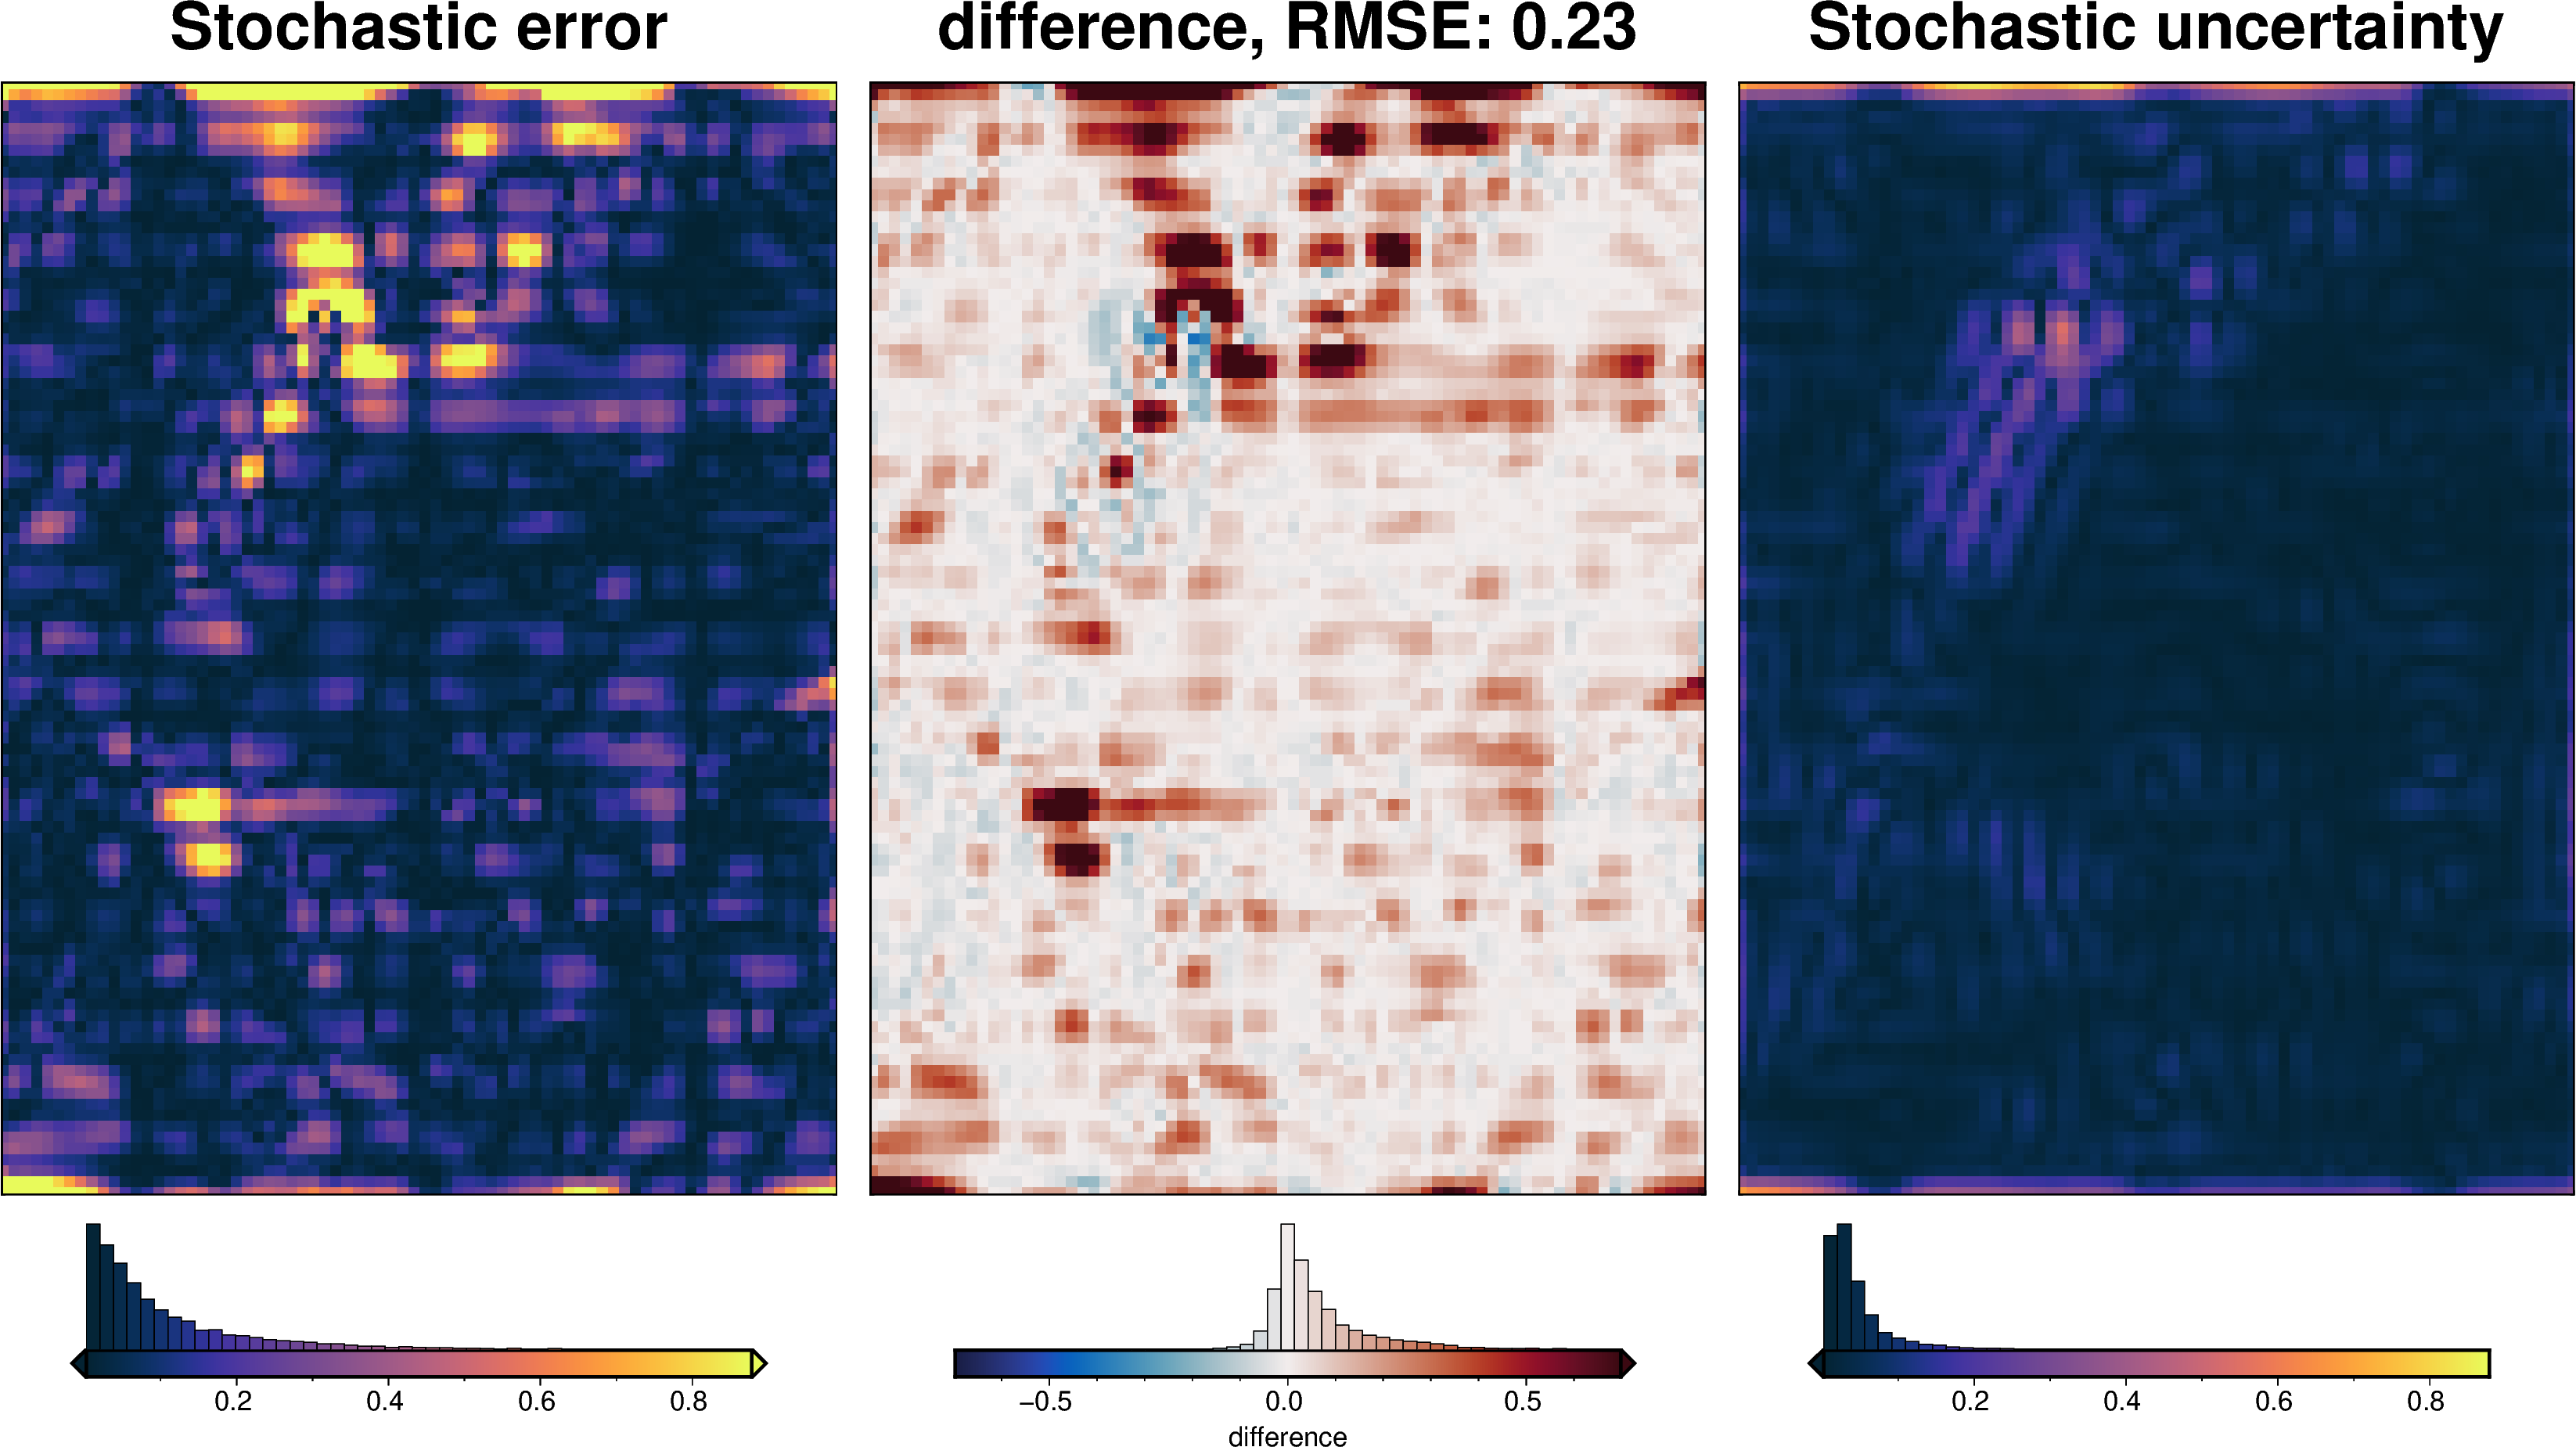
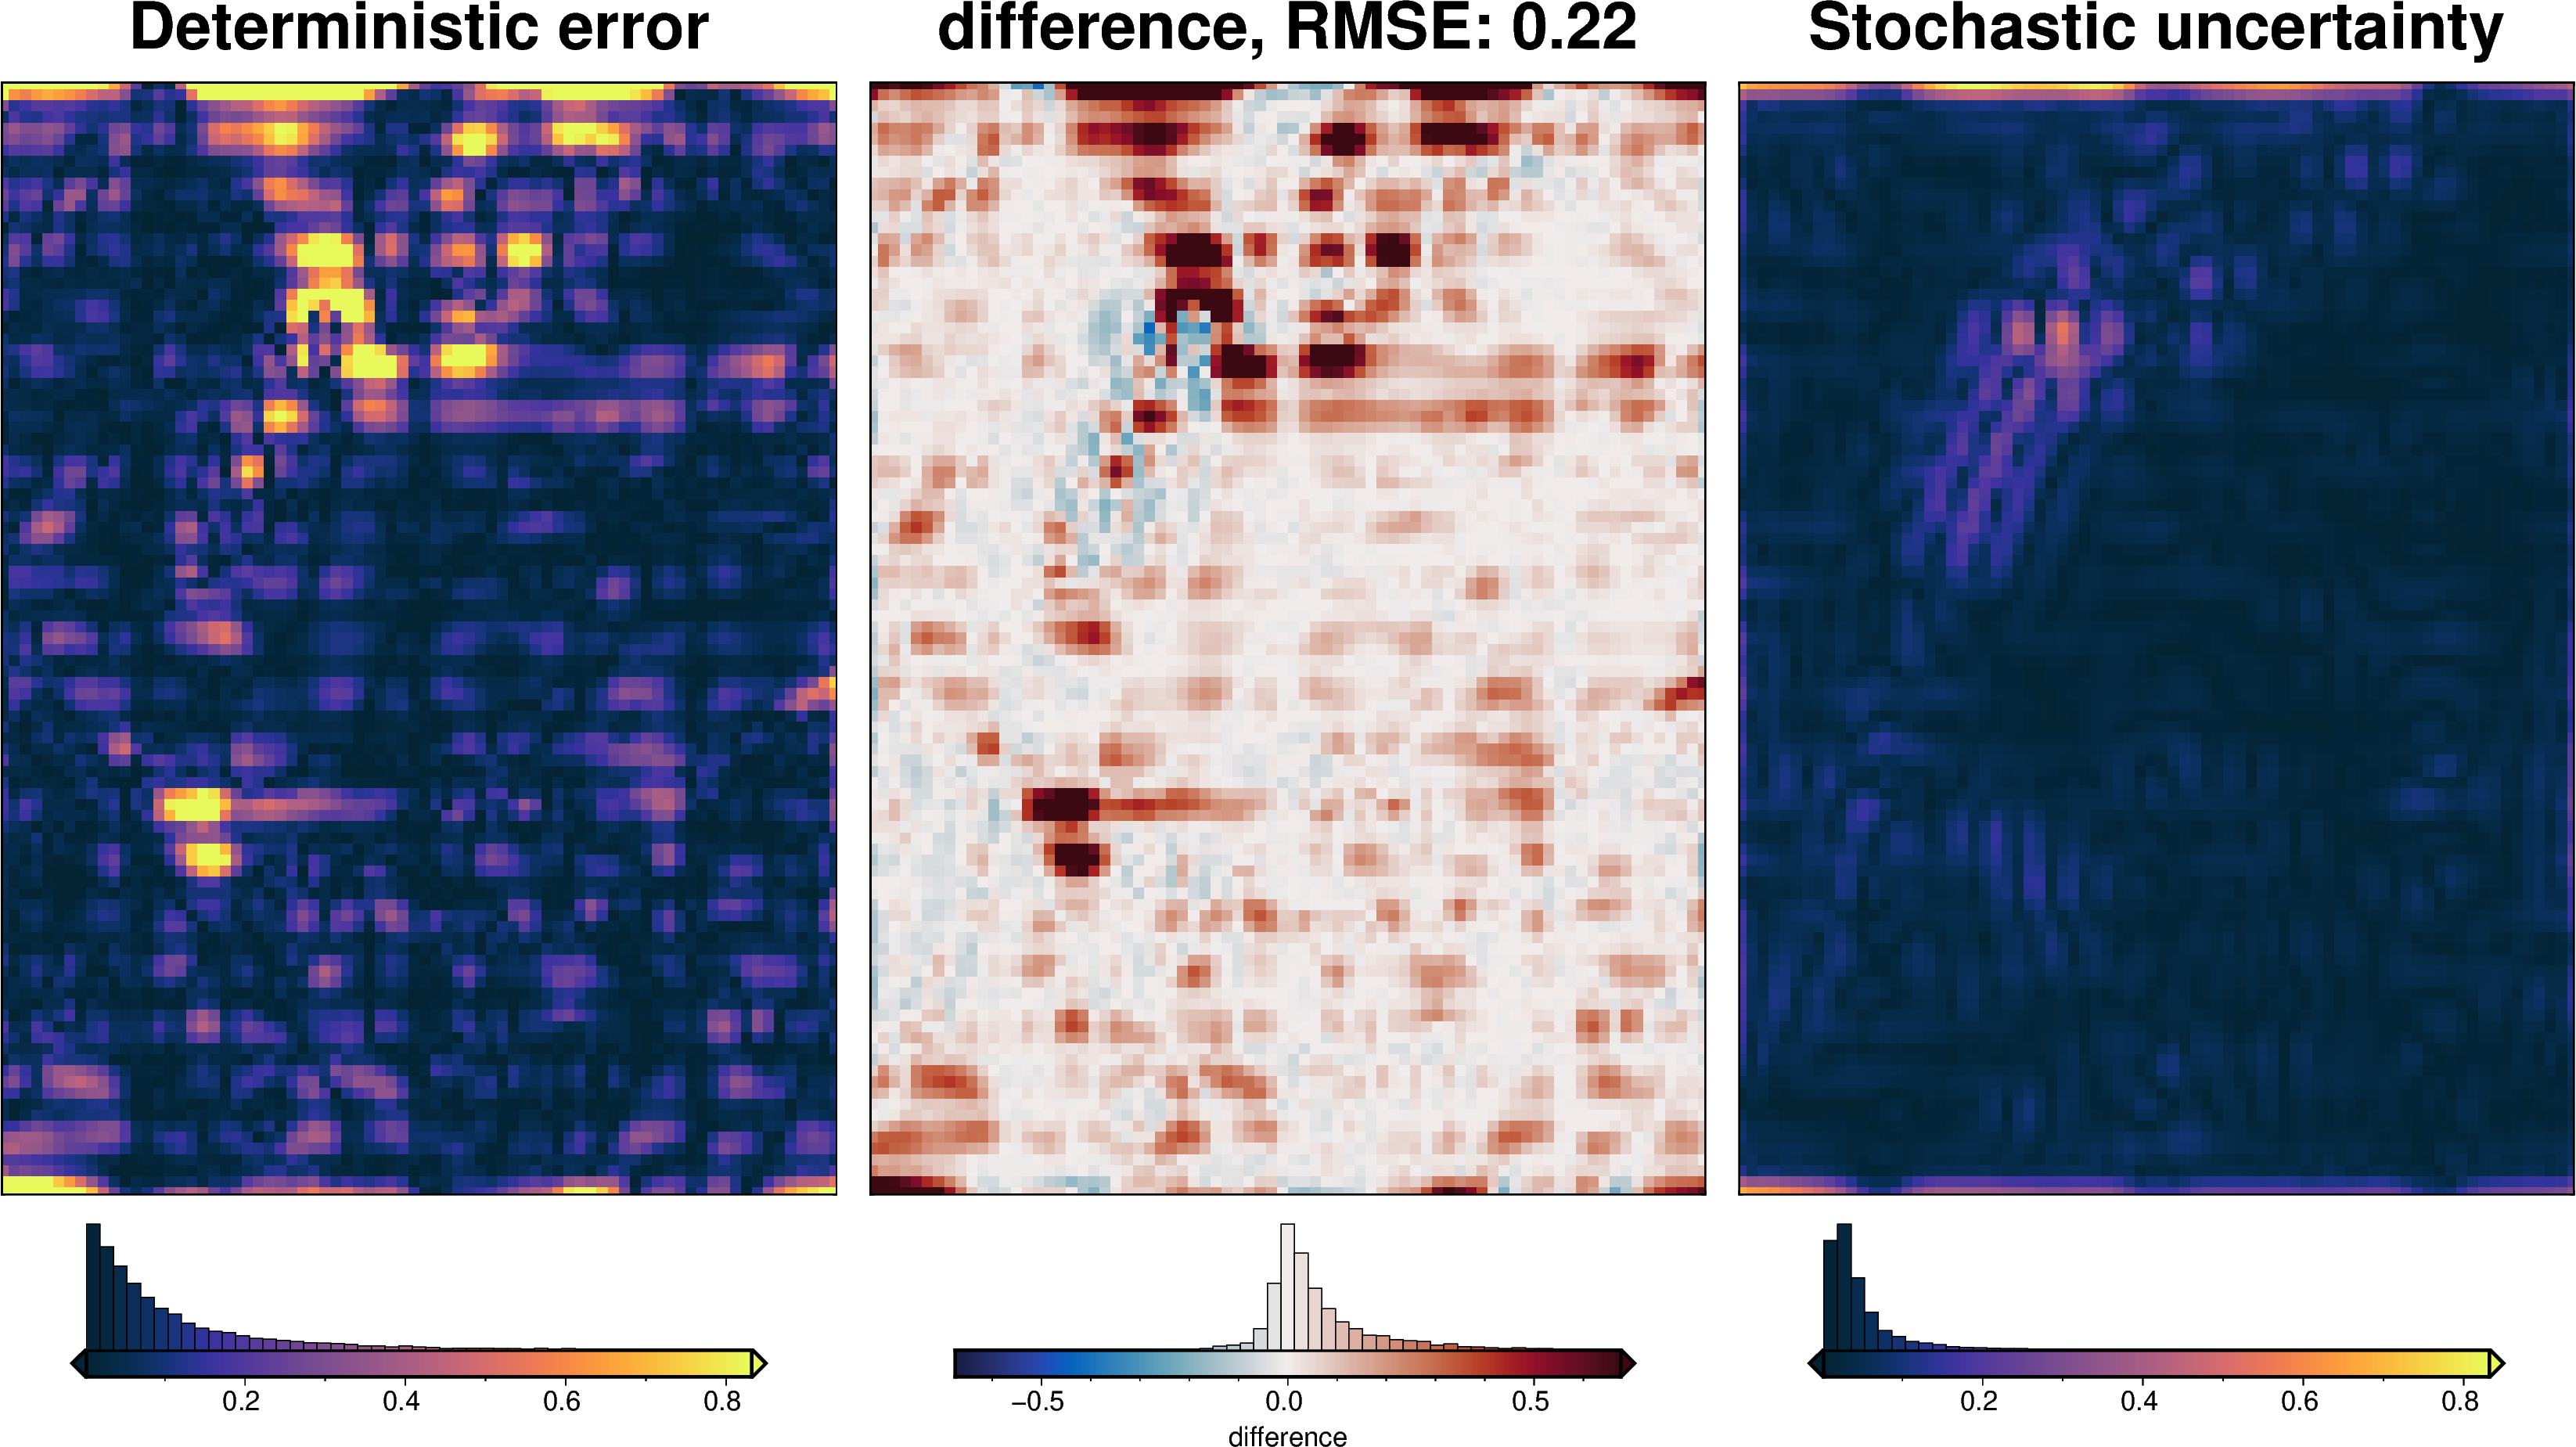
stats_ds = synth_plotting.uncert_plots(
uncert_eq_sources_results,
inversion_region,
bathymetry,
deterministic_bathymetry=final_topography,
constraint_points=constraint_points[constraint_points.inside],
weight_by="constraints",
)

Total uncertainty
[67]:
fname = f"{fpath}_uncertainty_full"
# delete files if already exist
for p in pathlib.Path().glob(f"{fname}*"):
p.unlink(missing_ok=True)
uncert_results = uncertainty.full_workflow_uncertainty_loop(
fname=fname,
runs=20,
sample_gravity=True,
parameter_dict=solver_dict | density_dict,
**eqs_uncert_kwargs,
)
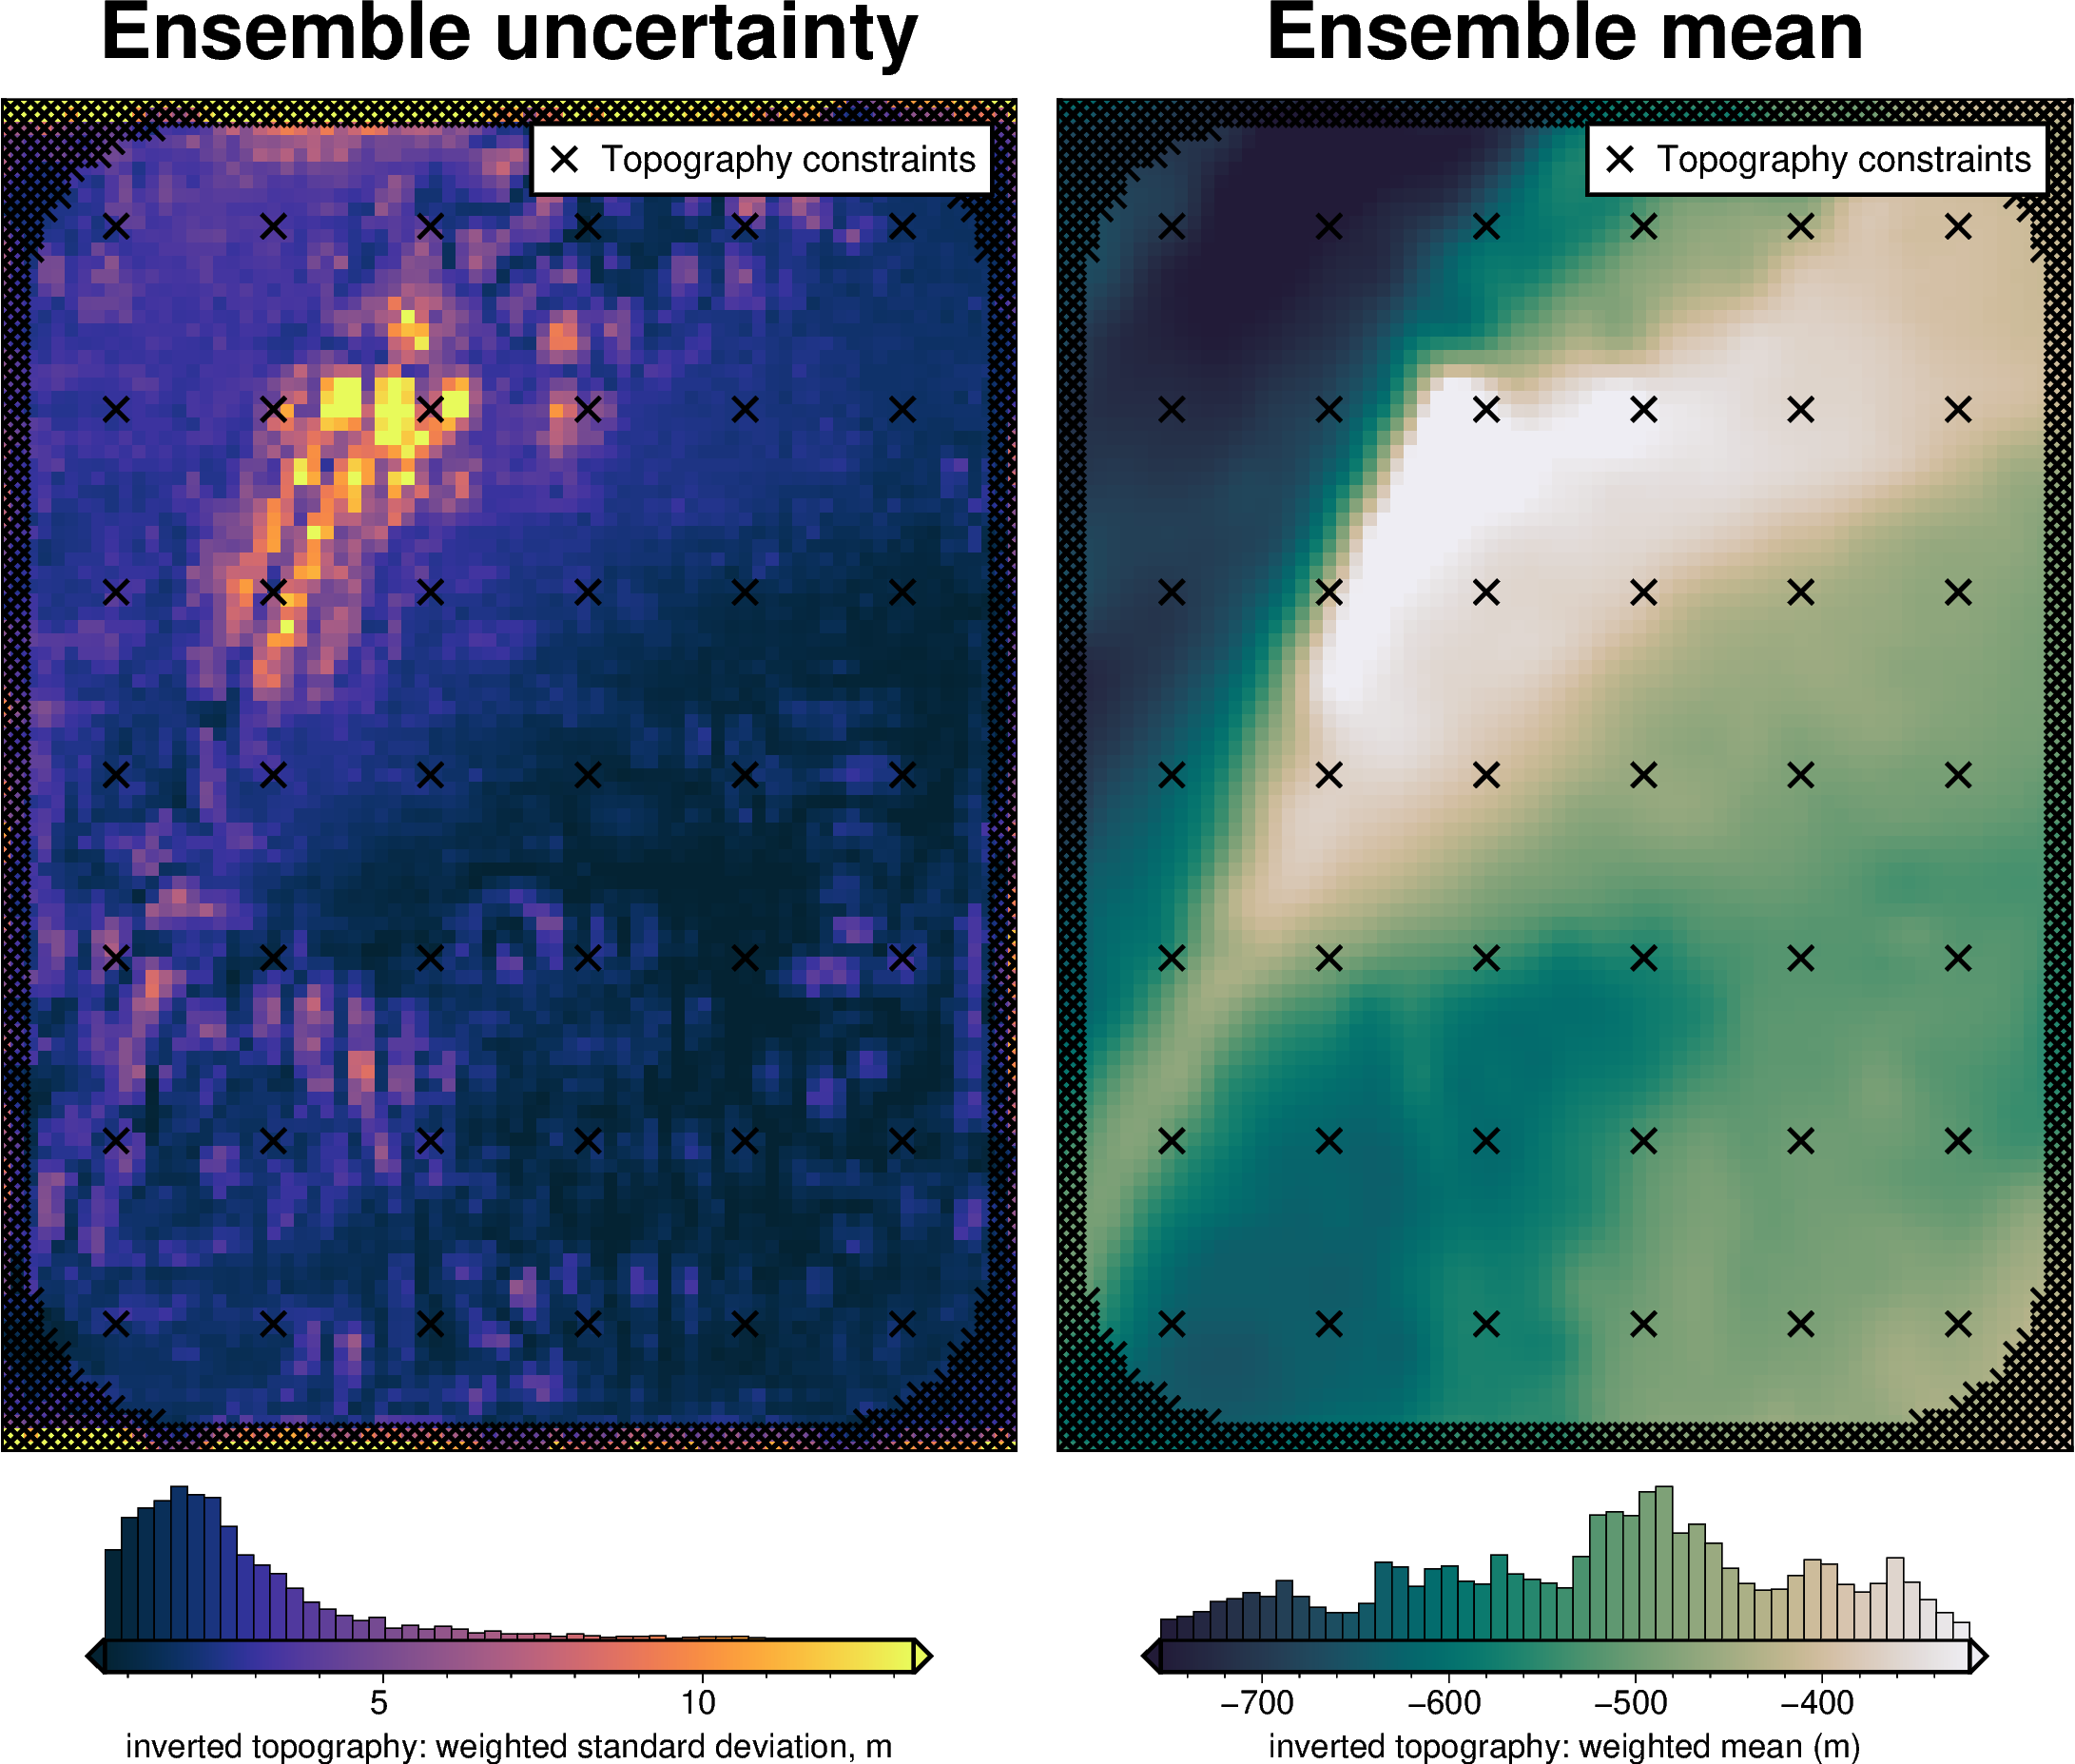
stats_ds = synth_plotting.uncert_plots(
uncert_results,
inversion_region,
bathymetry,
deterministic_bathymetry=final_topography,
constraint_points=constraint_points,
weight_by="constraints",
)

Comparing results
[68]:
results = [
uncert_results,
uncert_eq_sources_results,
uncert_density_results,
uncert_damping_results,
]
# get cell-wise stats for each ensemble
stats = []
for r in results:
ds = uncertainty.merged_stats(
results=r,
plot=False,
constraints_df=constraint_points,
weight_by="constraints",
region=inversion_region,
)
stats.append(ds)
[69]:
names = [
"full",
"equivalent source gridding",
"density",
"damping",
]
# get the standard deviation of the ensemble of ensembles
stdevs = []
for i, s in enumerate(stats):
stdevs.append(s.weighted_stdev.rename(f"{names[i]}_stdev"))
merged = xr.merge(stdevs)
merged
[69]:
<xarray.Dataset> Size: 247kB
Dimensions: (northing: 101, easting: 76)
Coordinates:
* northing (northing) float64 808B -1.6e+06 ... -1...
* easting (easting) float64 608B -4e+04 ... 1.1e+05
Data variables:
full_stdev (northing, easting) float64 61kB 36.93 ...
equivalent source gridding_stdev (northing, easting) float64 61kB 28.56 ...
density_stdev (northing, easting) float64 61kB 0.6489...
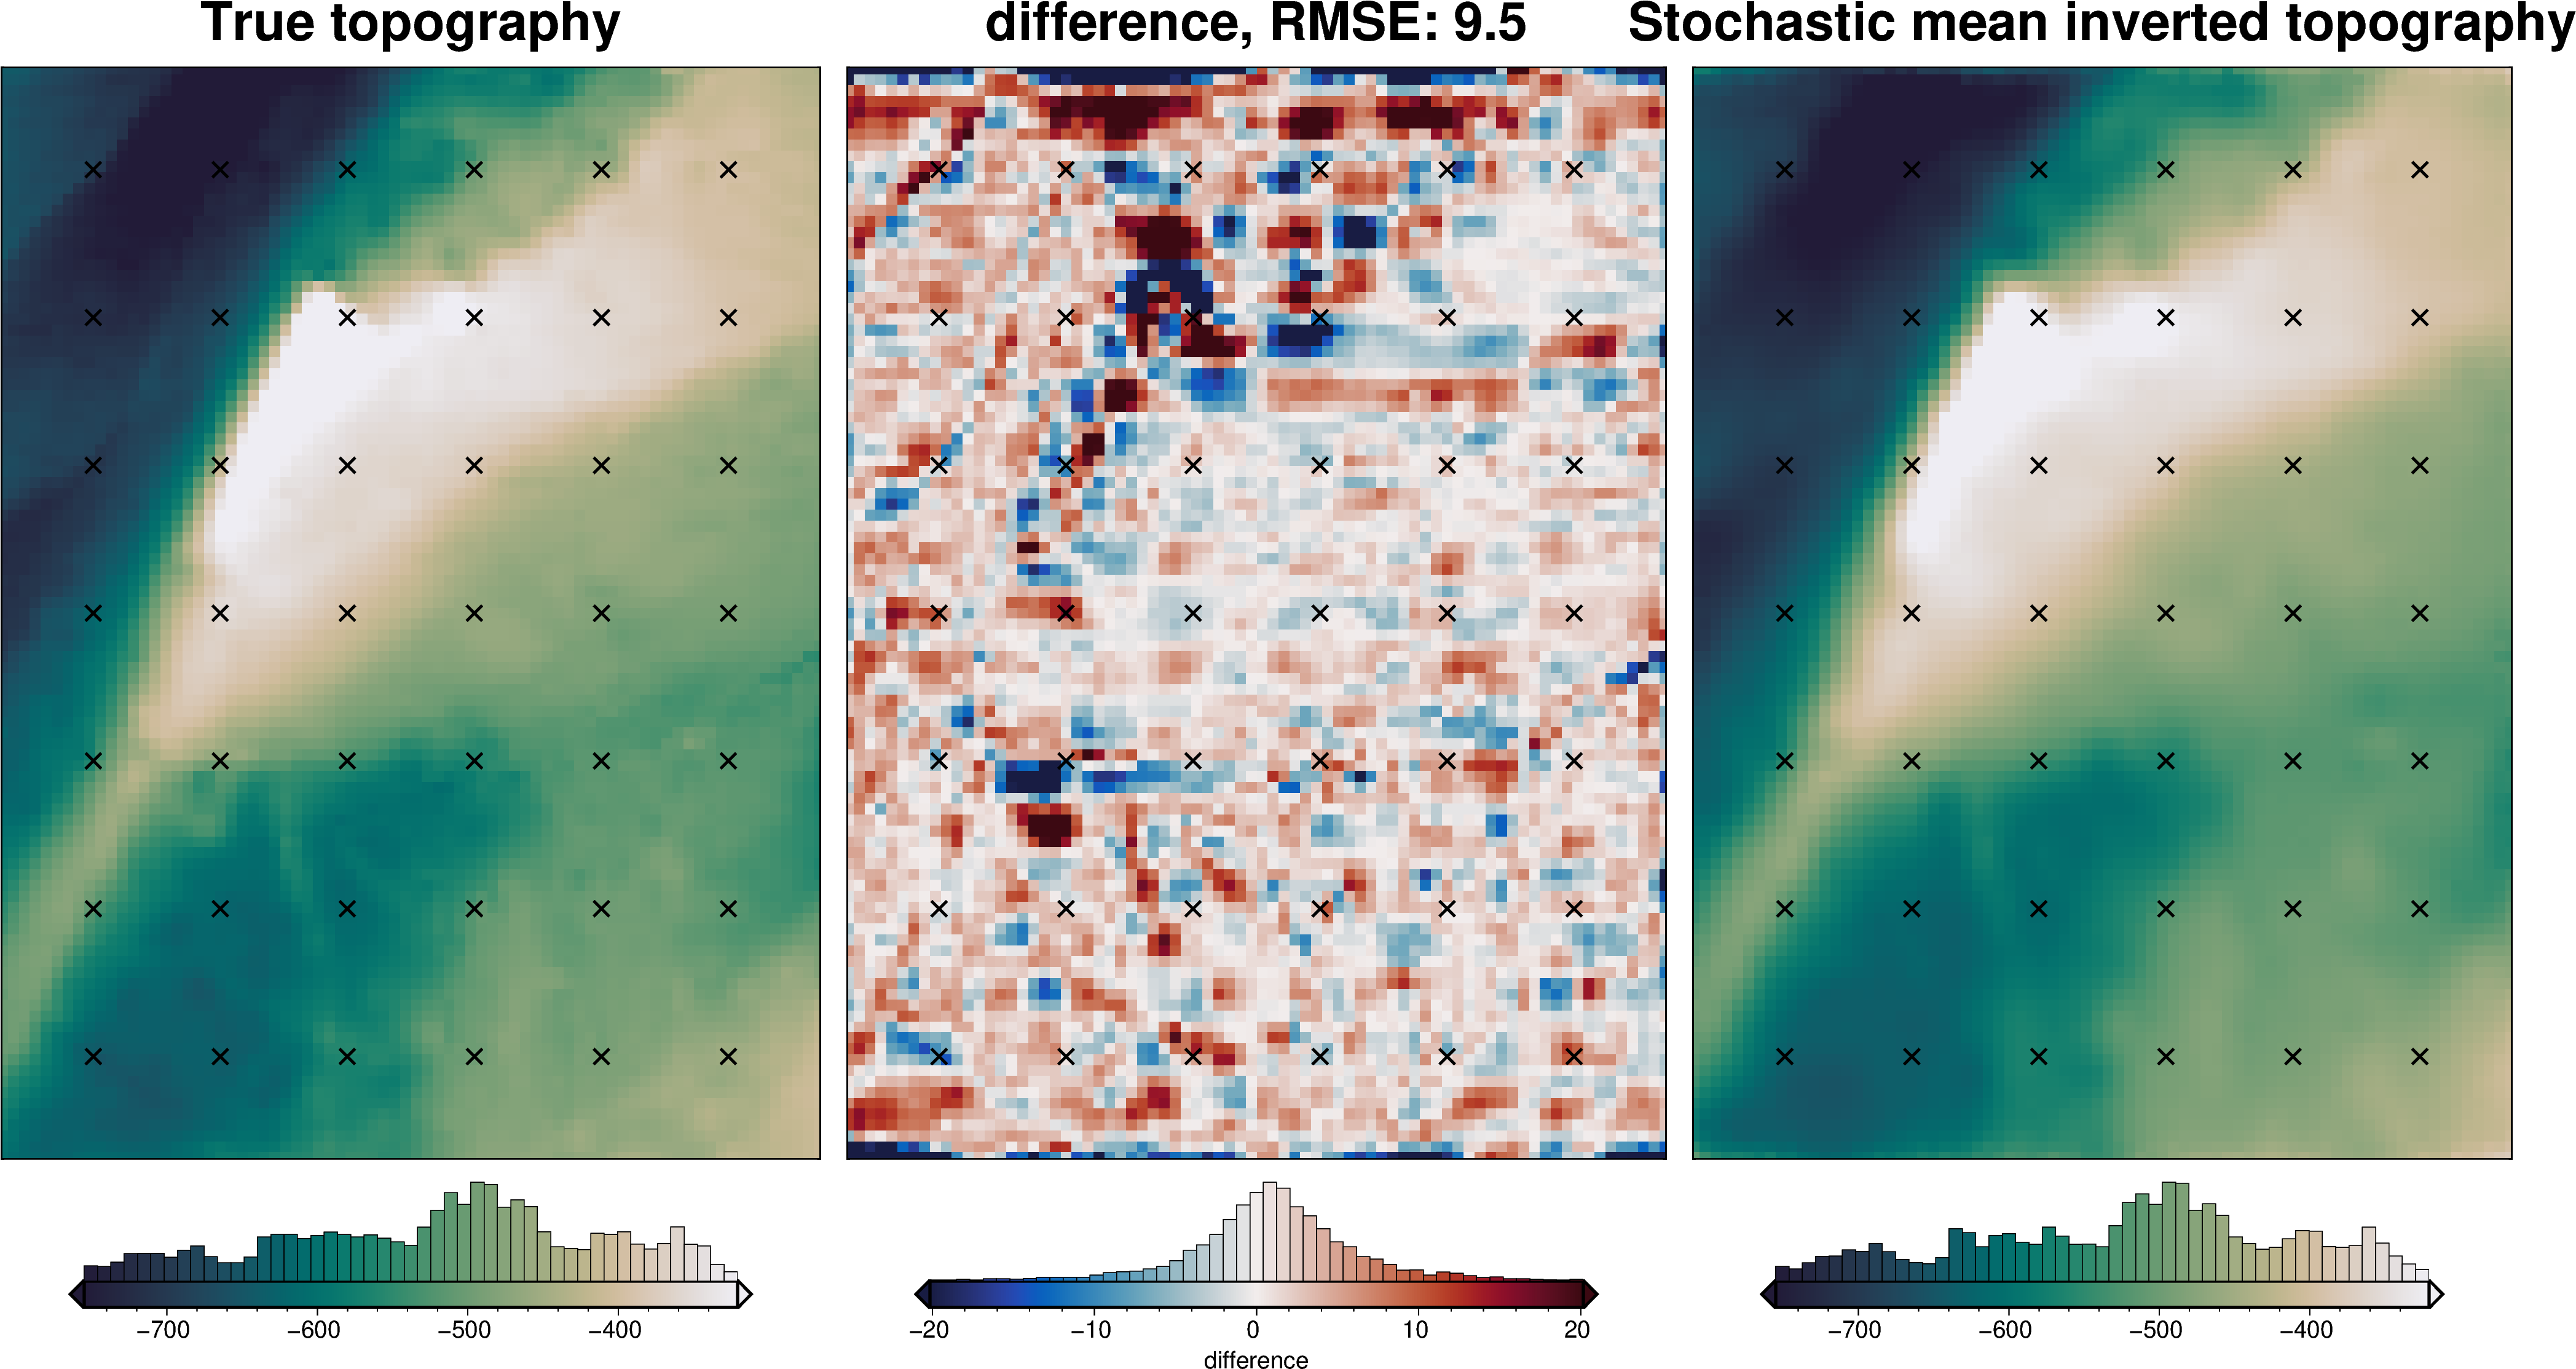
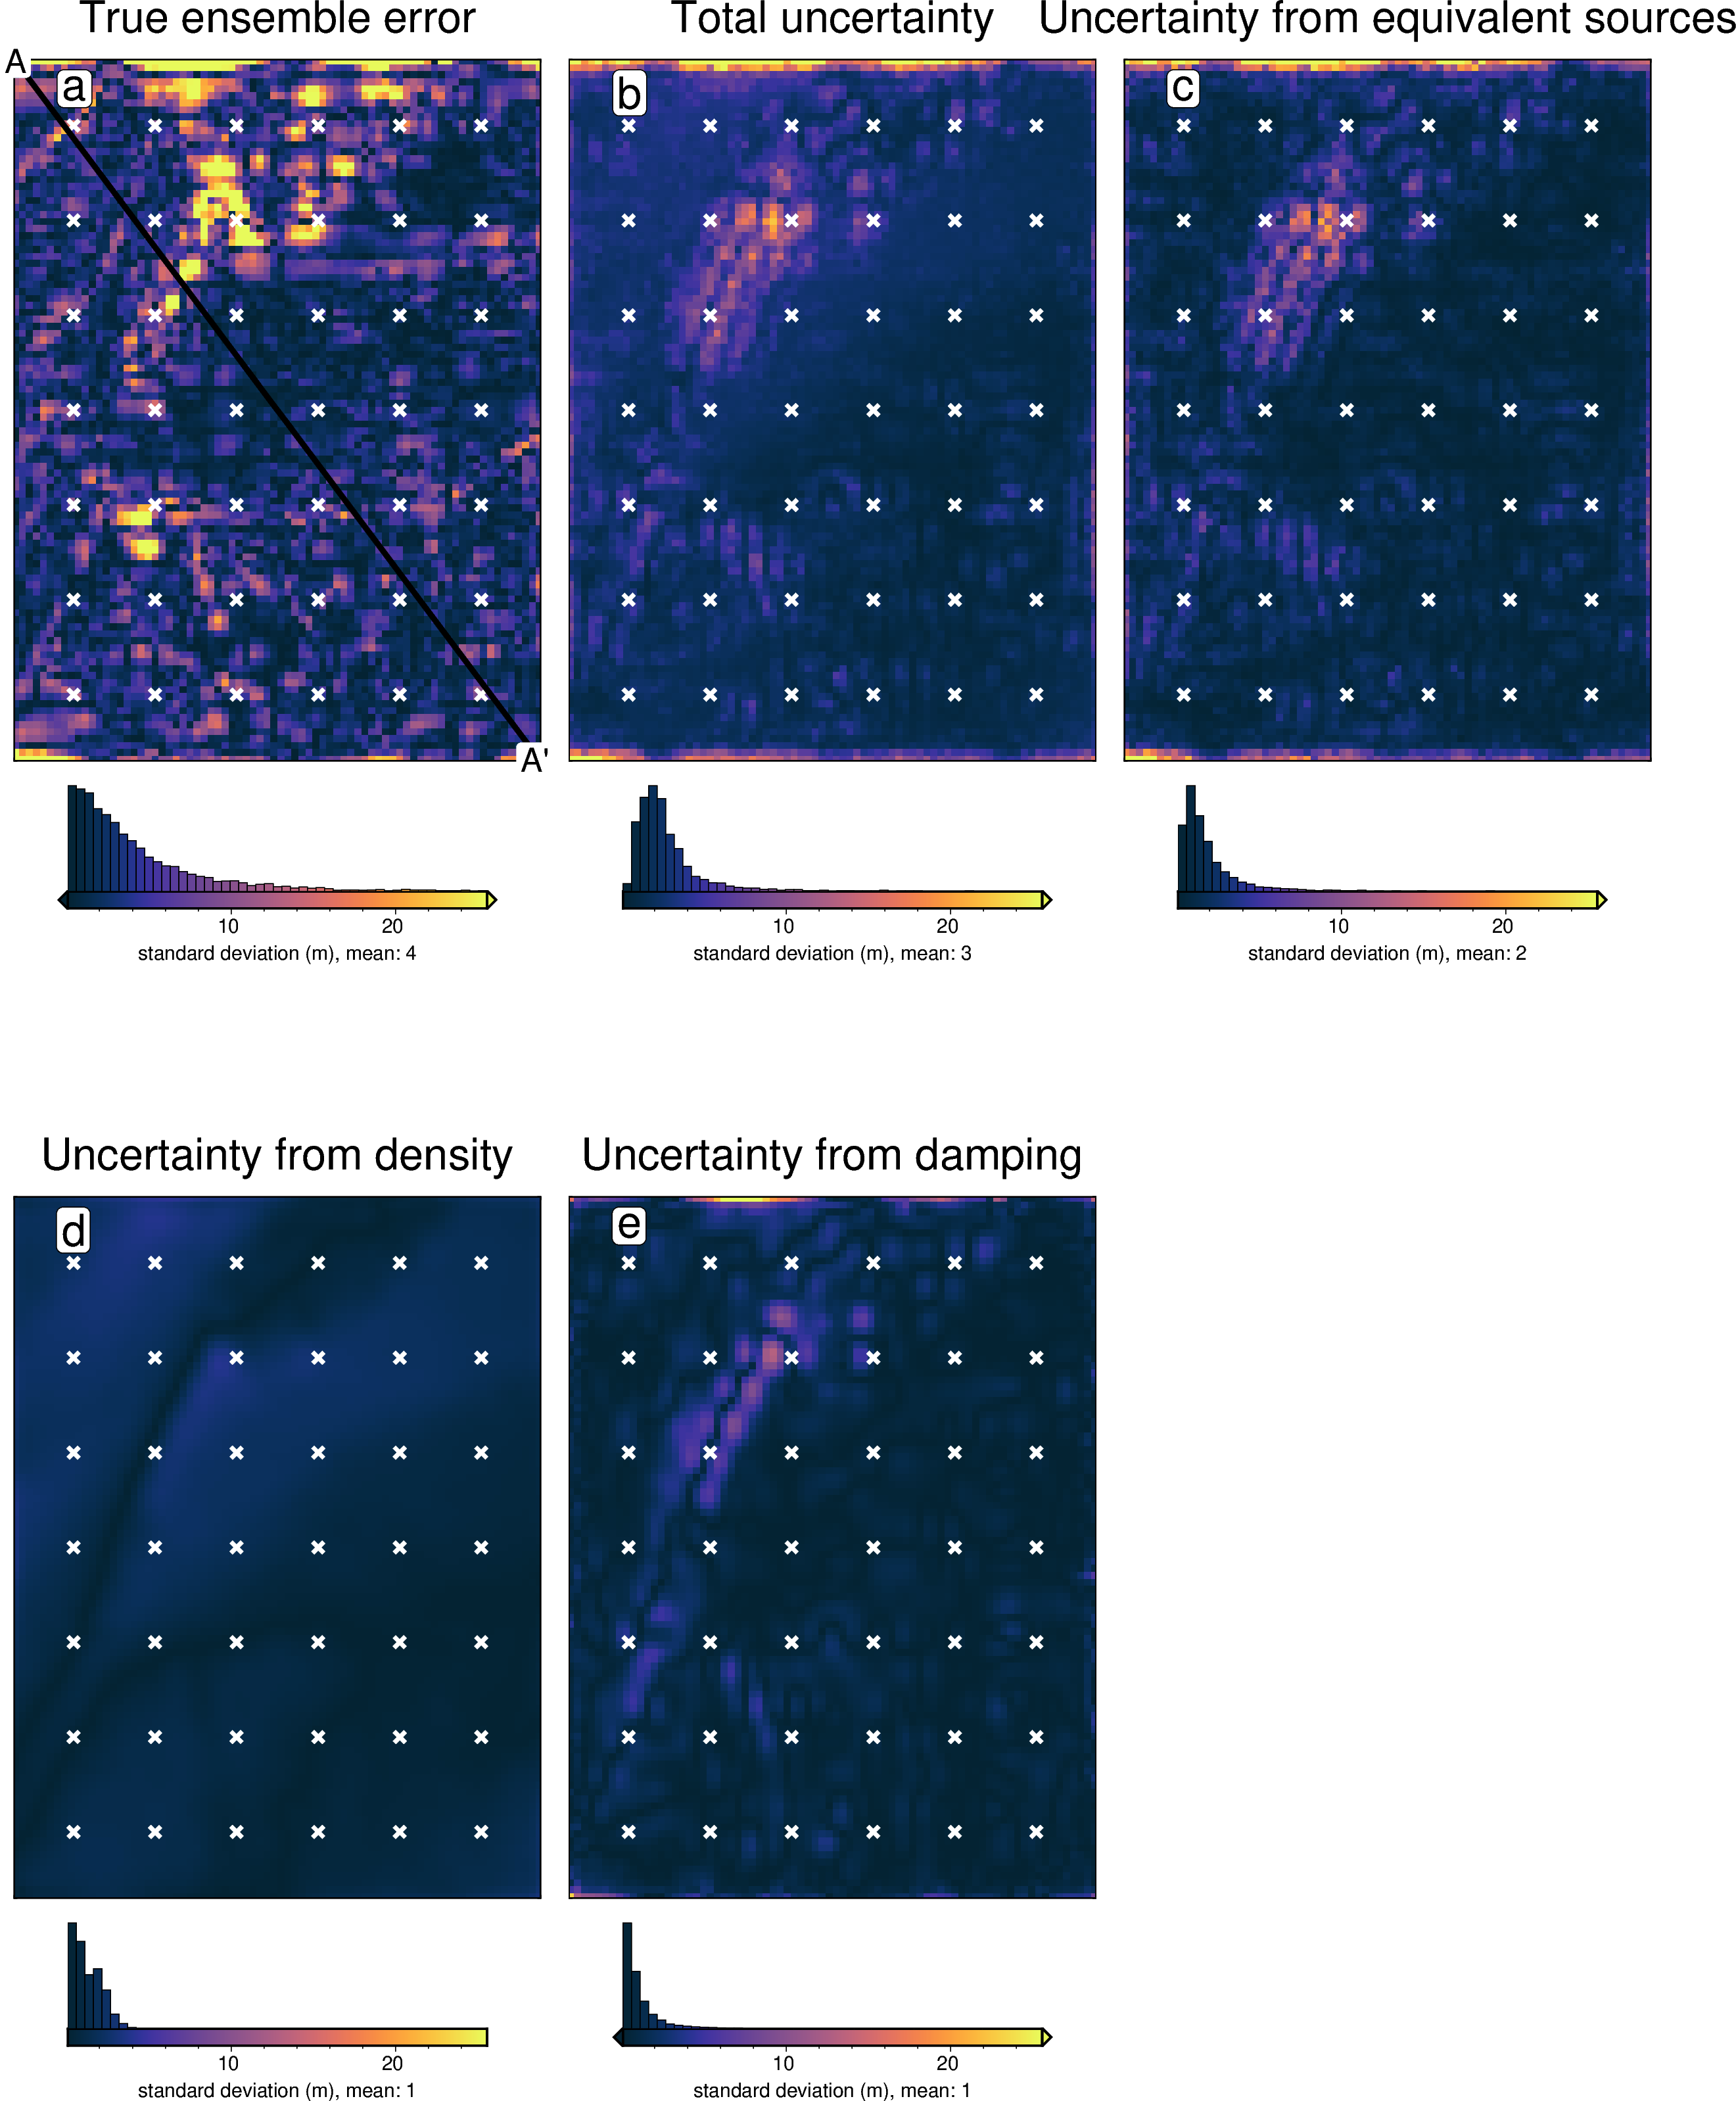
damping_stdev (northing, easting) float64 61kB 23.12 ...[70]:
titles = [
"True ensemble error",
"Total uncertainty",
"Uncertainty from equivalent sources",
"Uncertainty from density",
"Uncertainty from damping",
]
grids = list(merged.data_vars.values())
grids.insert(0, np.abs(stats[0].weighted_mean - bathymetry))
cpt_lims = polar_utils.get_combined_min_max(grids, robust=True)
fig_height = 9
for i, g in enumerate(grids):
xshift_amount = 1
if i == 0:
fig = None
origin_shift = "initialize"
elif i == 3:
origin_shift = "both_shift"
xshift_amount = -2
else:
origin_shift = "xshift"
fig = maps.plot_grd(
grid=g,
fig_height=fig_height,
title=titles[i],
title_font="16p,Helvetica,black",
cmap="thermal",
cpt_lims=cpt_lims,
robust=True,
cbar_label=f"standard deviation (m), mean: {int(np.nanmean(g))}",
hist=True,
hist_bin_num=50,
fig=fig,
origin_shift=origin_shift,
xshift_amount=xshift_amount,
yshift_amount=-1.1,
)
fig.plot(
x=constraint_points[constraint_points.inside].easting,
y=constraint_points[constraint_points.inside].northing,
style="x.2c",
fill="white",
pen="1.5p,white",
)
fig.text(
position="TL",
text=f"{string.ascii_lowercase[i]}",
fill="white",
pen=True,
font="16p,Helvetica,black",
offset="j.6/.2",
clearance="+tO",
no_clip=True,
)
if i == 0:
# plot profiles location, and endpoints on map
start = [inversion_region[0], inversion_region[3]]
stop = [inversion_region[1], inversion_region[2]]
fig.plot(
vd.line_coordinates(start, stop, size=100),
pen="2p,black",
)
fig.text(
x=start[0],
y=start[1],
text="A",
fill="white",
font="12p,Helvetica,black",
justify="CM",
clearance="+tO",
no_clip=True,
)
fig.text(
x=stop[0],
y=stop[1],
text="A' ",
fill="white",
font="12p,Helvetica,black",
justify="CM",
clearance="+tO",
no_clip=True,
)
fig.show()
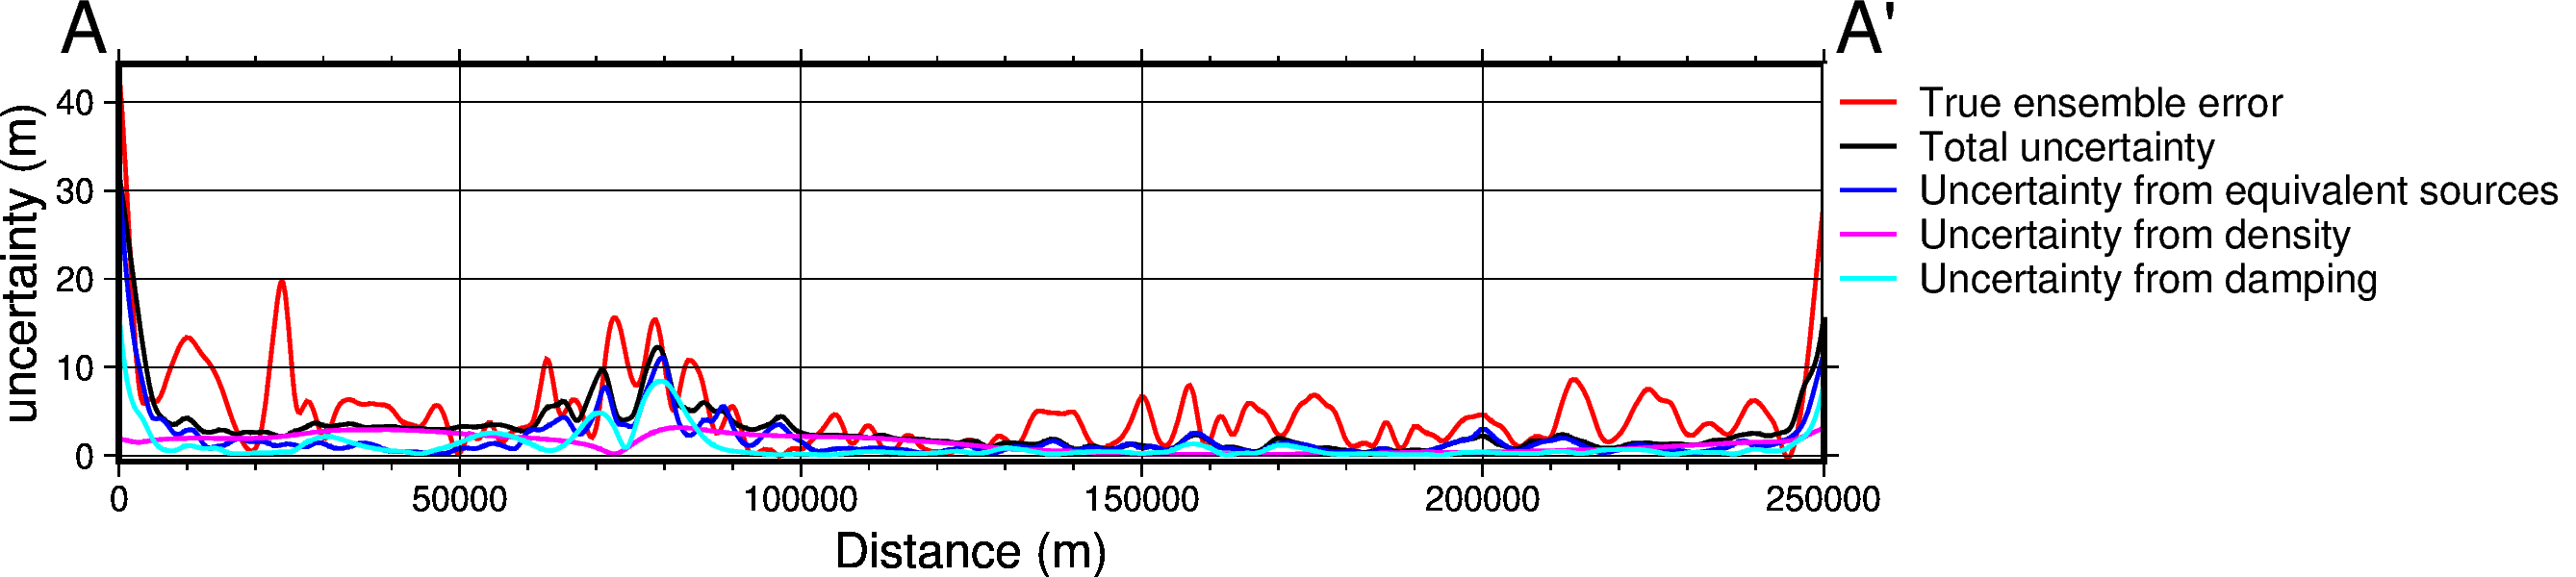
[71]:
data_dict = profiles.make_data_dict(
names=titles,
grids=grids,
colors=[
"red",
"black",
"blue",
"magenta",
"cyan",
"green",
"purple",
],
)
fig, df_data = profiles.plot_data(
"points",
start=[inversion_region[0], inversion_region[3]],
stop=[inversion_region[1], inversion_region[2]],
num=10000,
fig_height=4,
fig_width=15,
data_dict=data_dict,
data_legend_loc="jTR+jTL",
data_legend_box="+gwhite",
data_buffer=0.01,
data_frame=["neSW", "xafg+lDistance (m)", "yag+luncertainty (m)"],
share_yaxis=True,
start_label="A",
end_label="A' ",
)
fig.show()
grdtrack [WARNING]: Some input points were outside the grid domain(s).
grdtrack [WARNING]: Some input points were outside the grid domain(s).
grdtrack [WARNING]: Some input points were outside the grid domain(s).
grdtrack [WARNING]: Some input points were outside the grid domain(s).
grdtrack [WARNING]: Some input points were outside the grid domain(s).
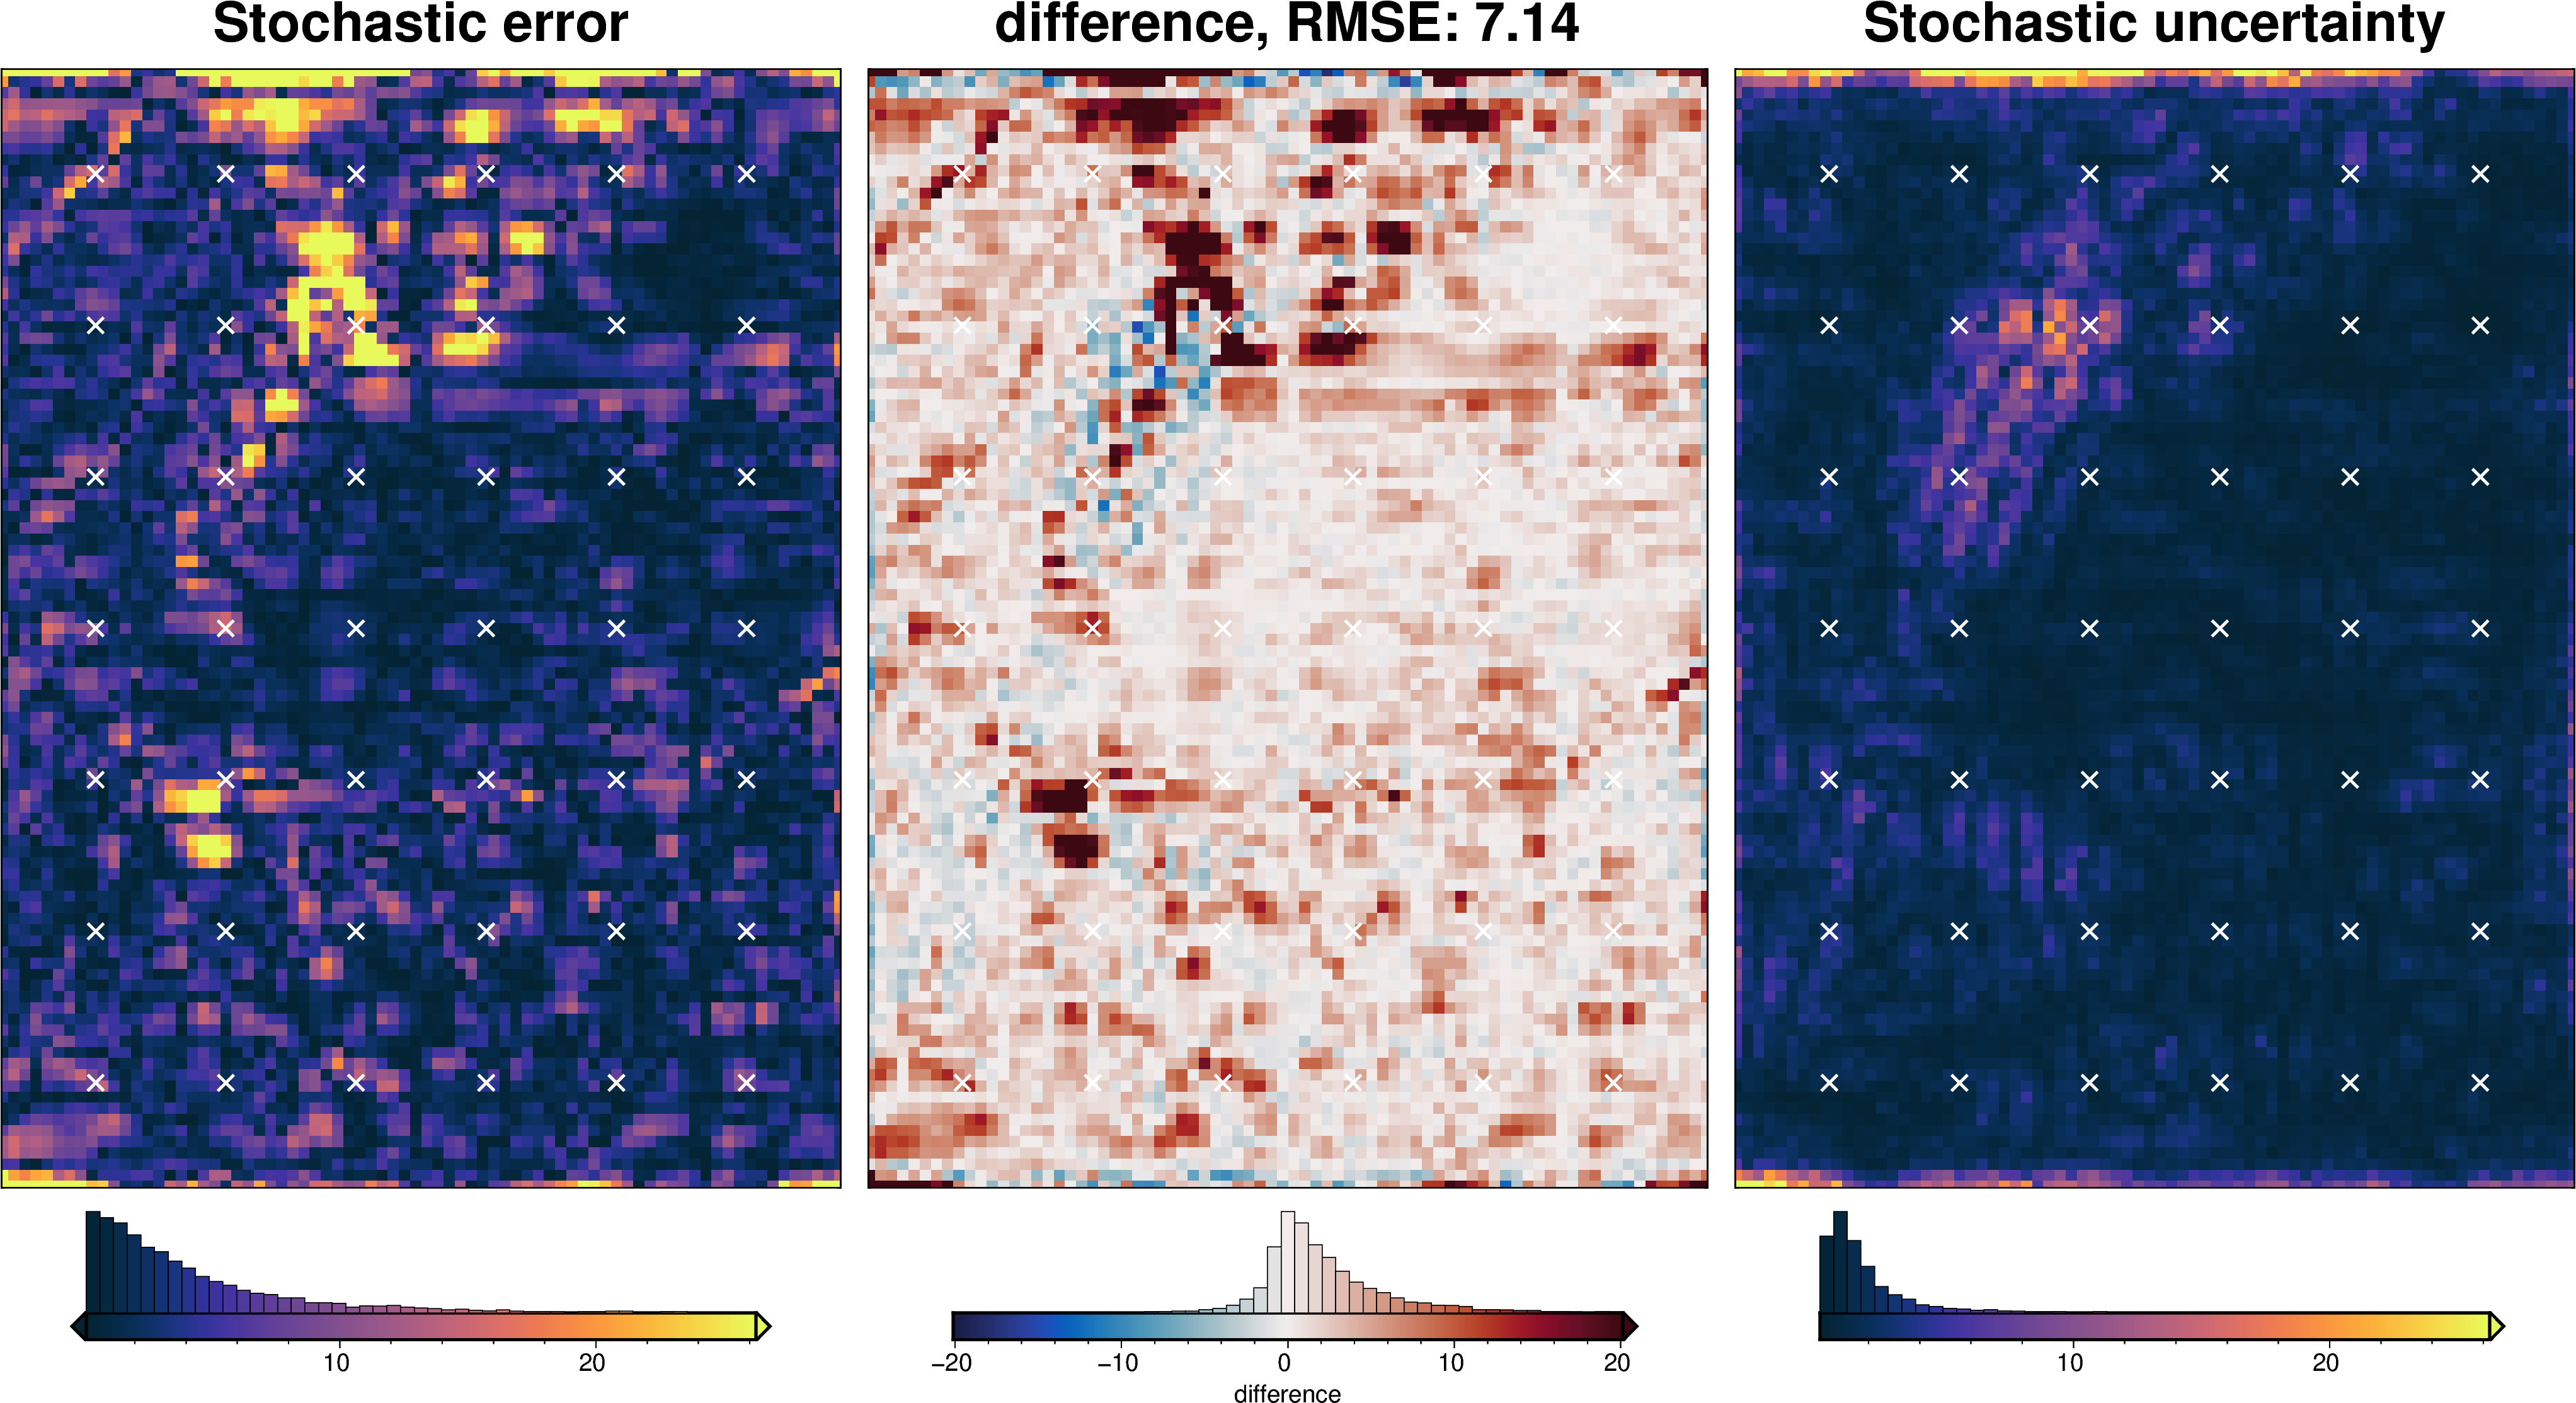
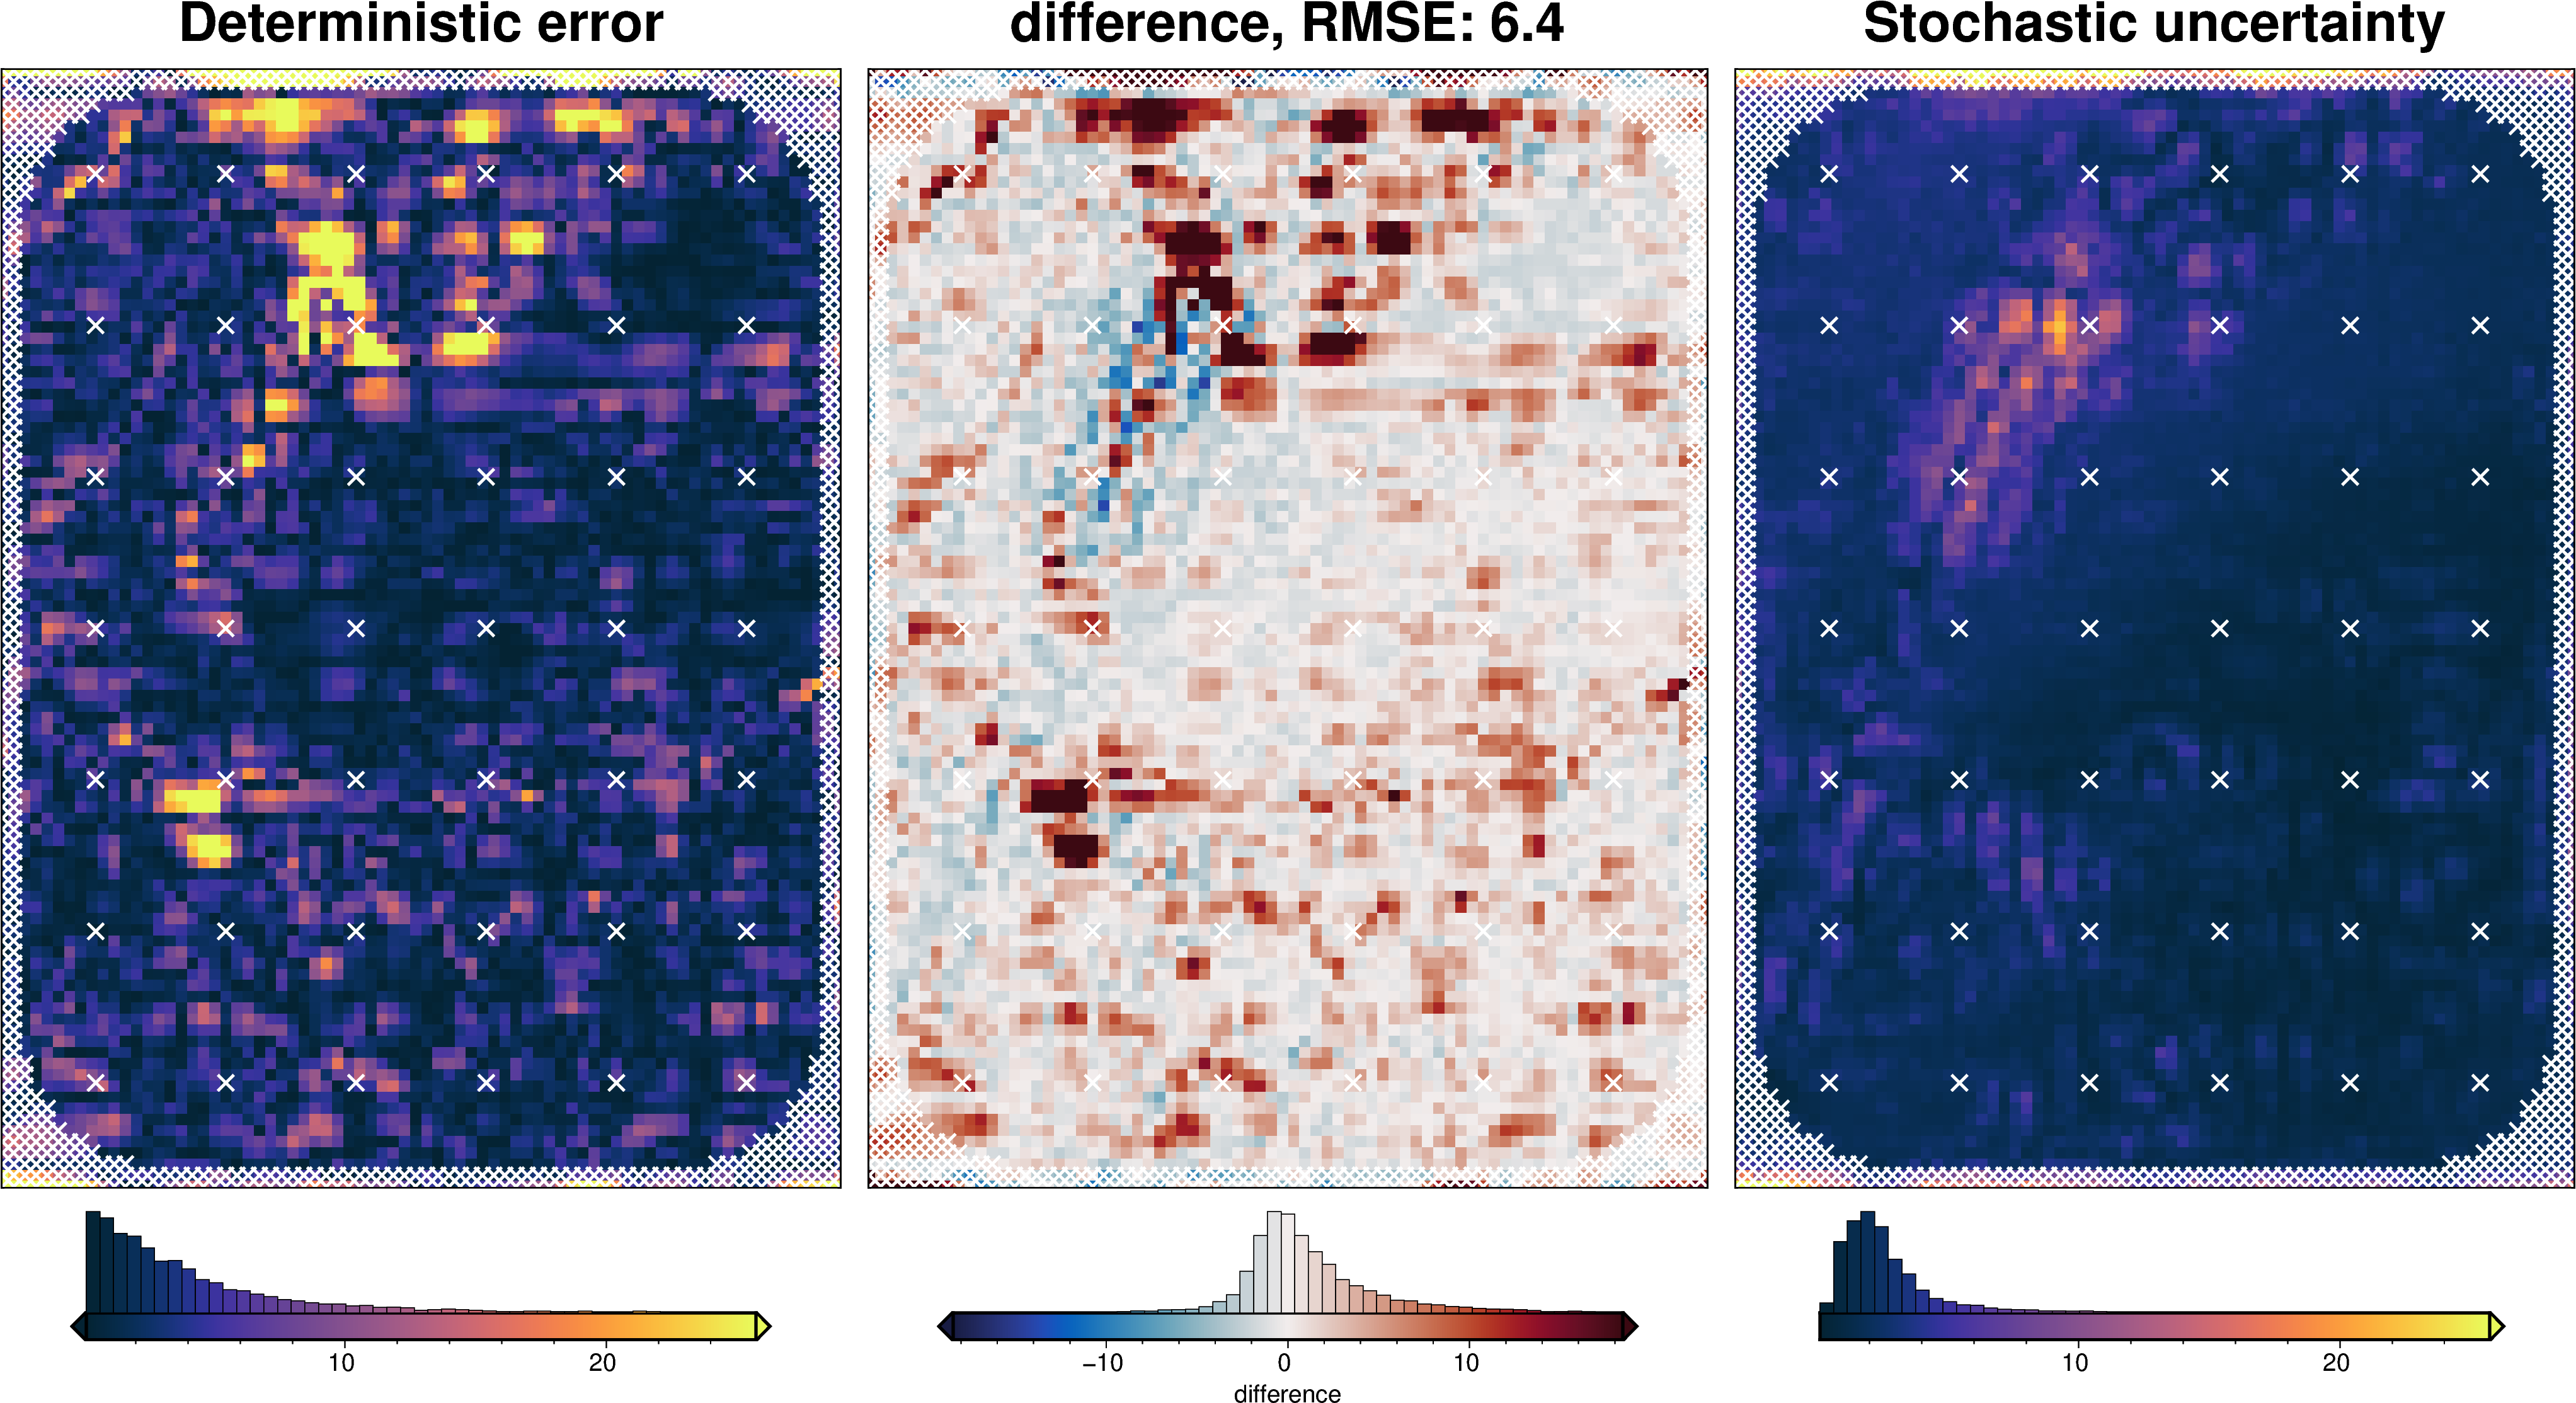
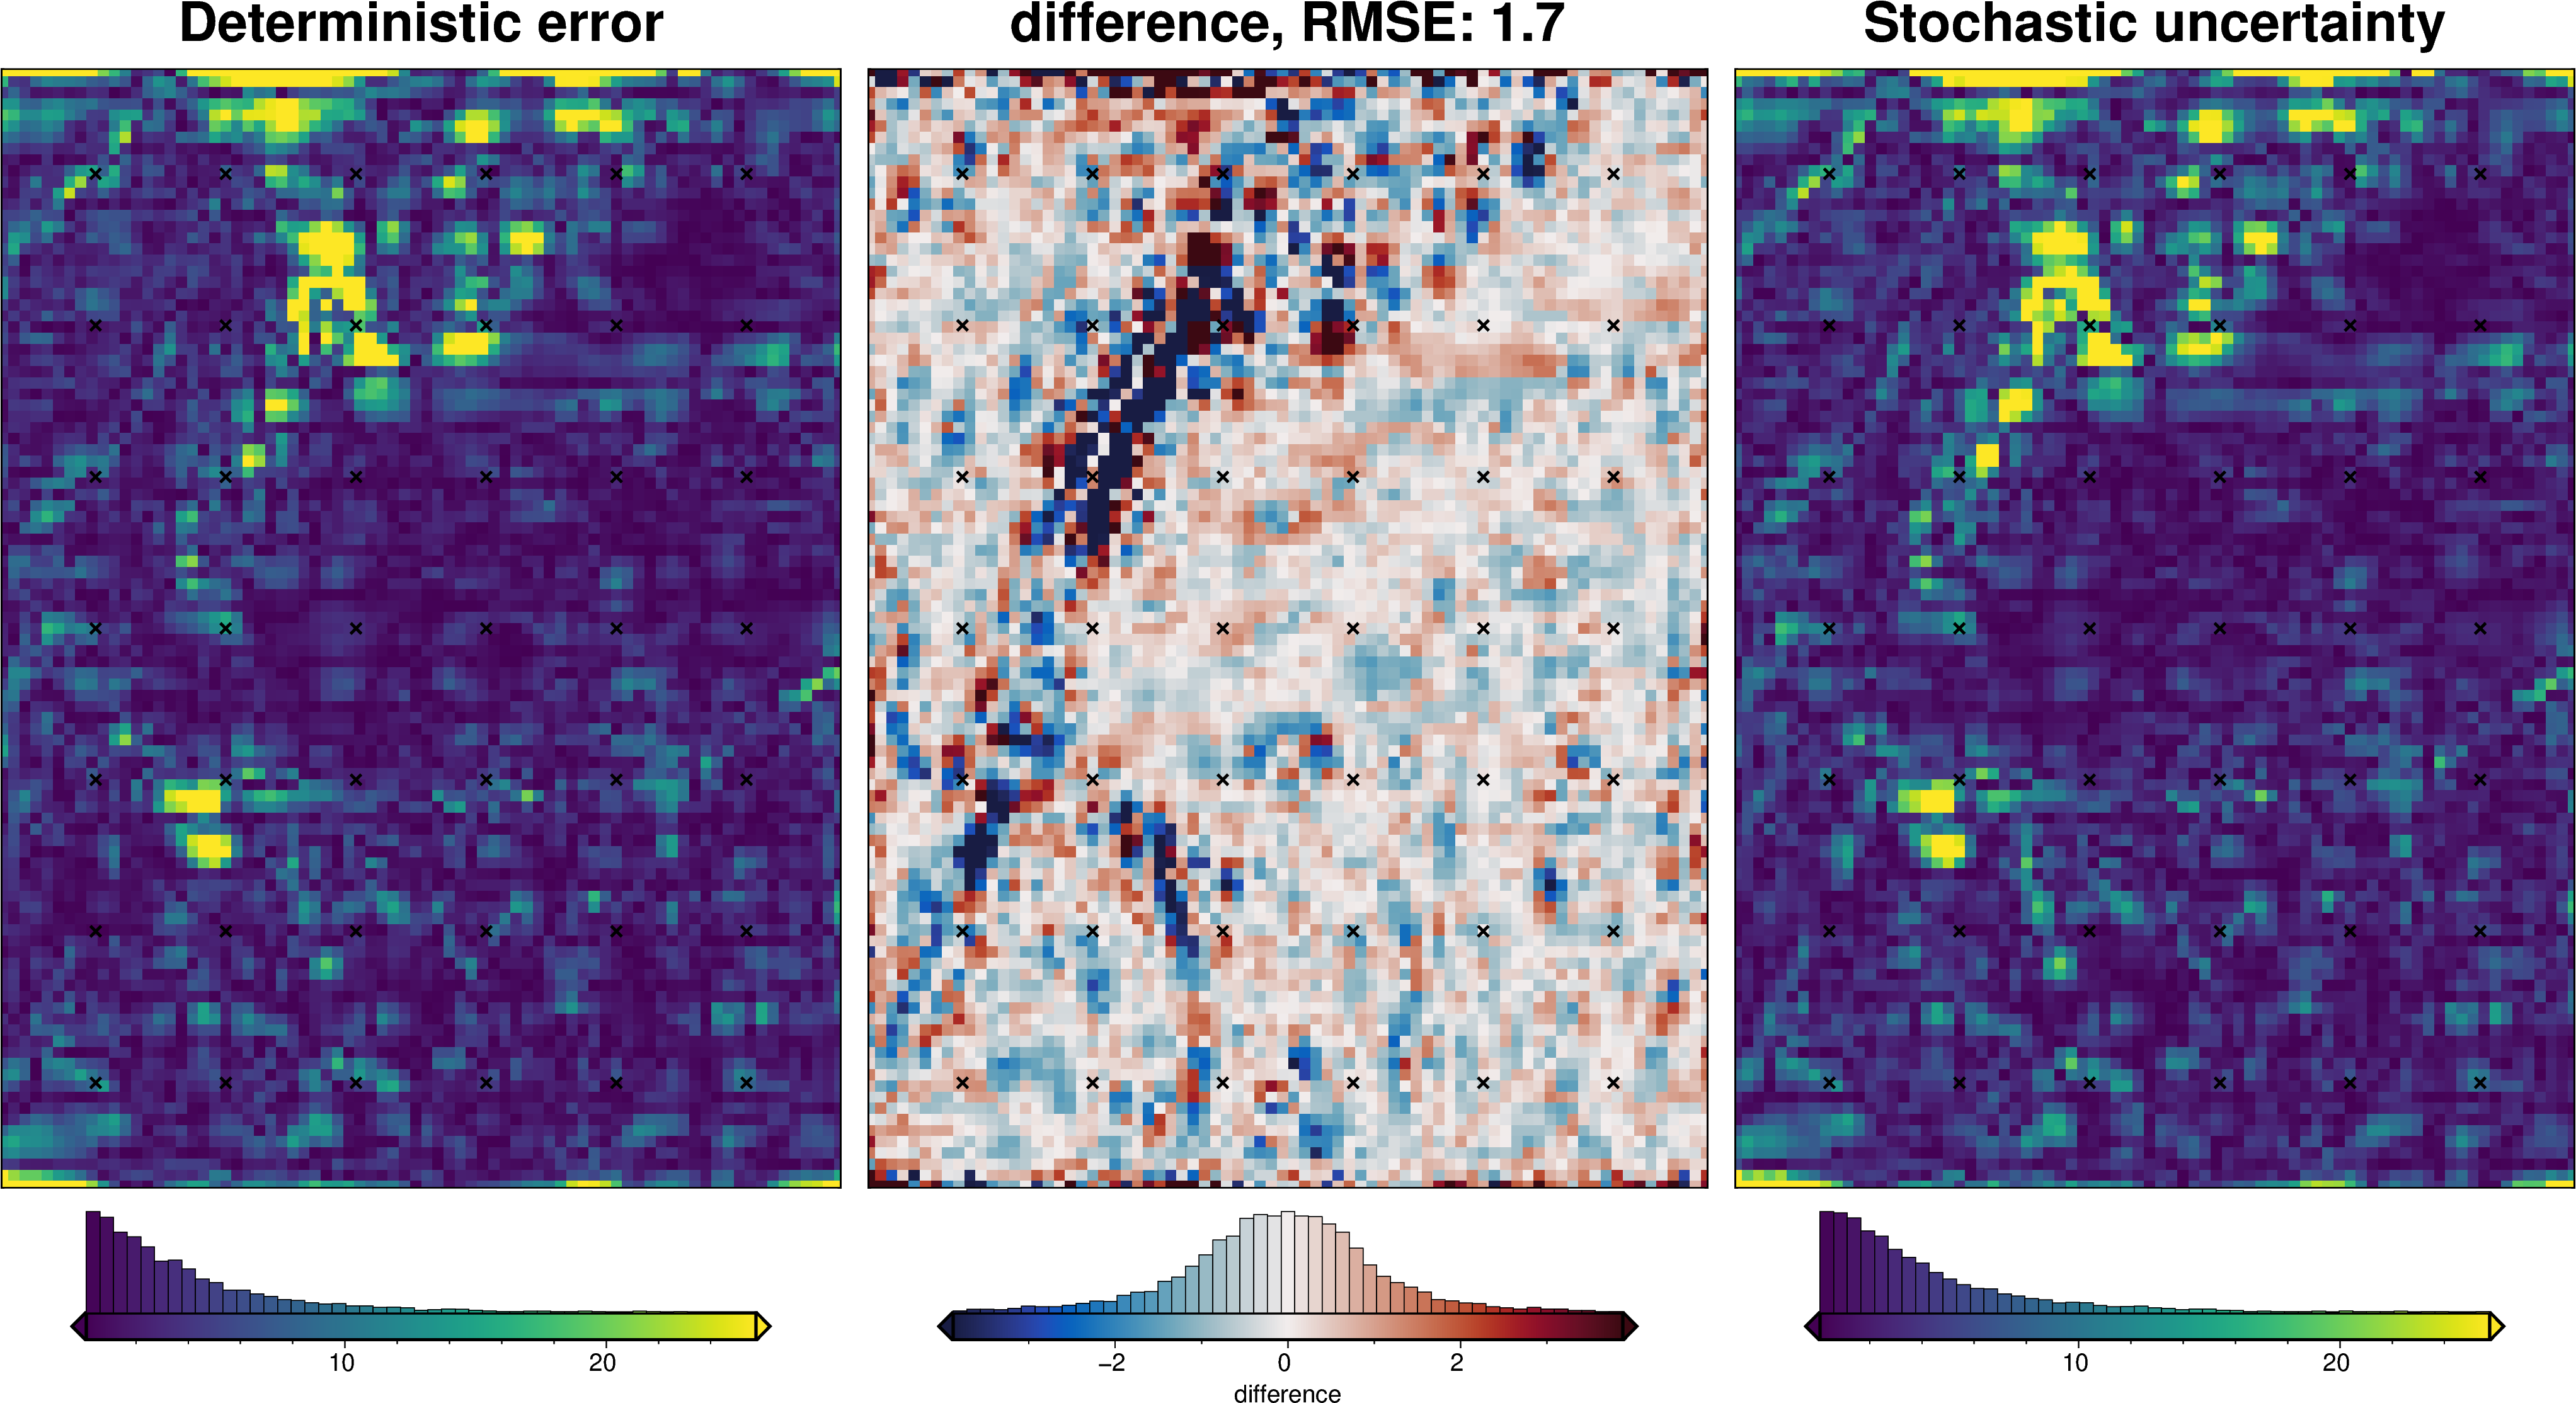
[72]:
_ = polar_utils.grd_compare(
inversion_error,
np.abs(stats[0].weighted_mean - bathymetry),
region=inversion_region,
plot=True,
grid1_name="Deterministic error",
grid2_name="Stochastic uncertainty",
robust=True,
hist=True,
inset=False,
verbose="q",
title="difference",
grounding_line=False,
points=constraint_points[constraint_points.inside],
points_style="x.2c",
)
[73]:
# save results
merged.to_netcdf(f"{fpath}_sensitivity.nc")
[74]:
stats_ds.to_netcdf(f"{fpath}_uncertainty.nc")
[ ]: