Test 5; realistic scenario
import packages
[1]:
%load_ext autoreload
%autoreload 2
import copy
import logging
import os
import pathlib
import pickle
import string
import matplotlib.pyplot as plt
import numpy as np
import pandas as pd
import scipy as sp
import verde as vd
import xarray as xr
from invert4geom import (
inversion,
optimization,
plotting,
regional,
uncertainty,
utils,
)
from invert4geom import synthetic as inv_synthetic
from polartoolkit import maps, profiles
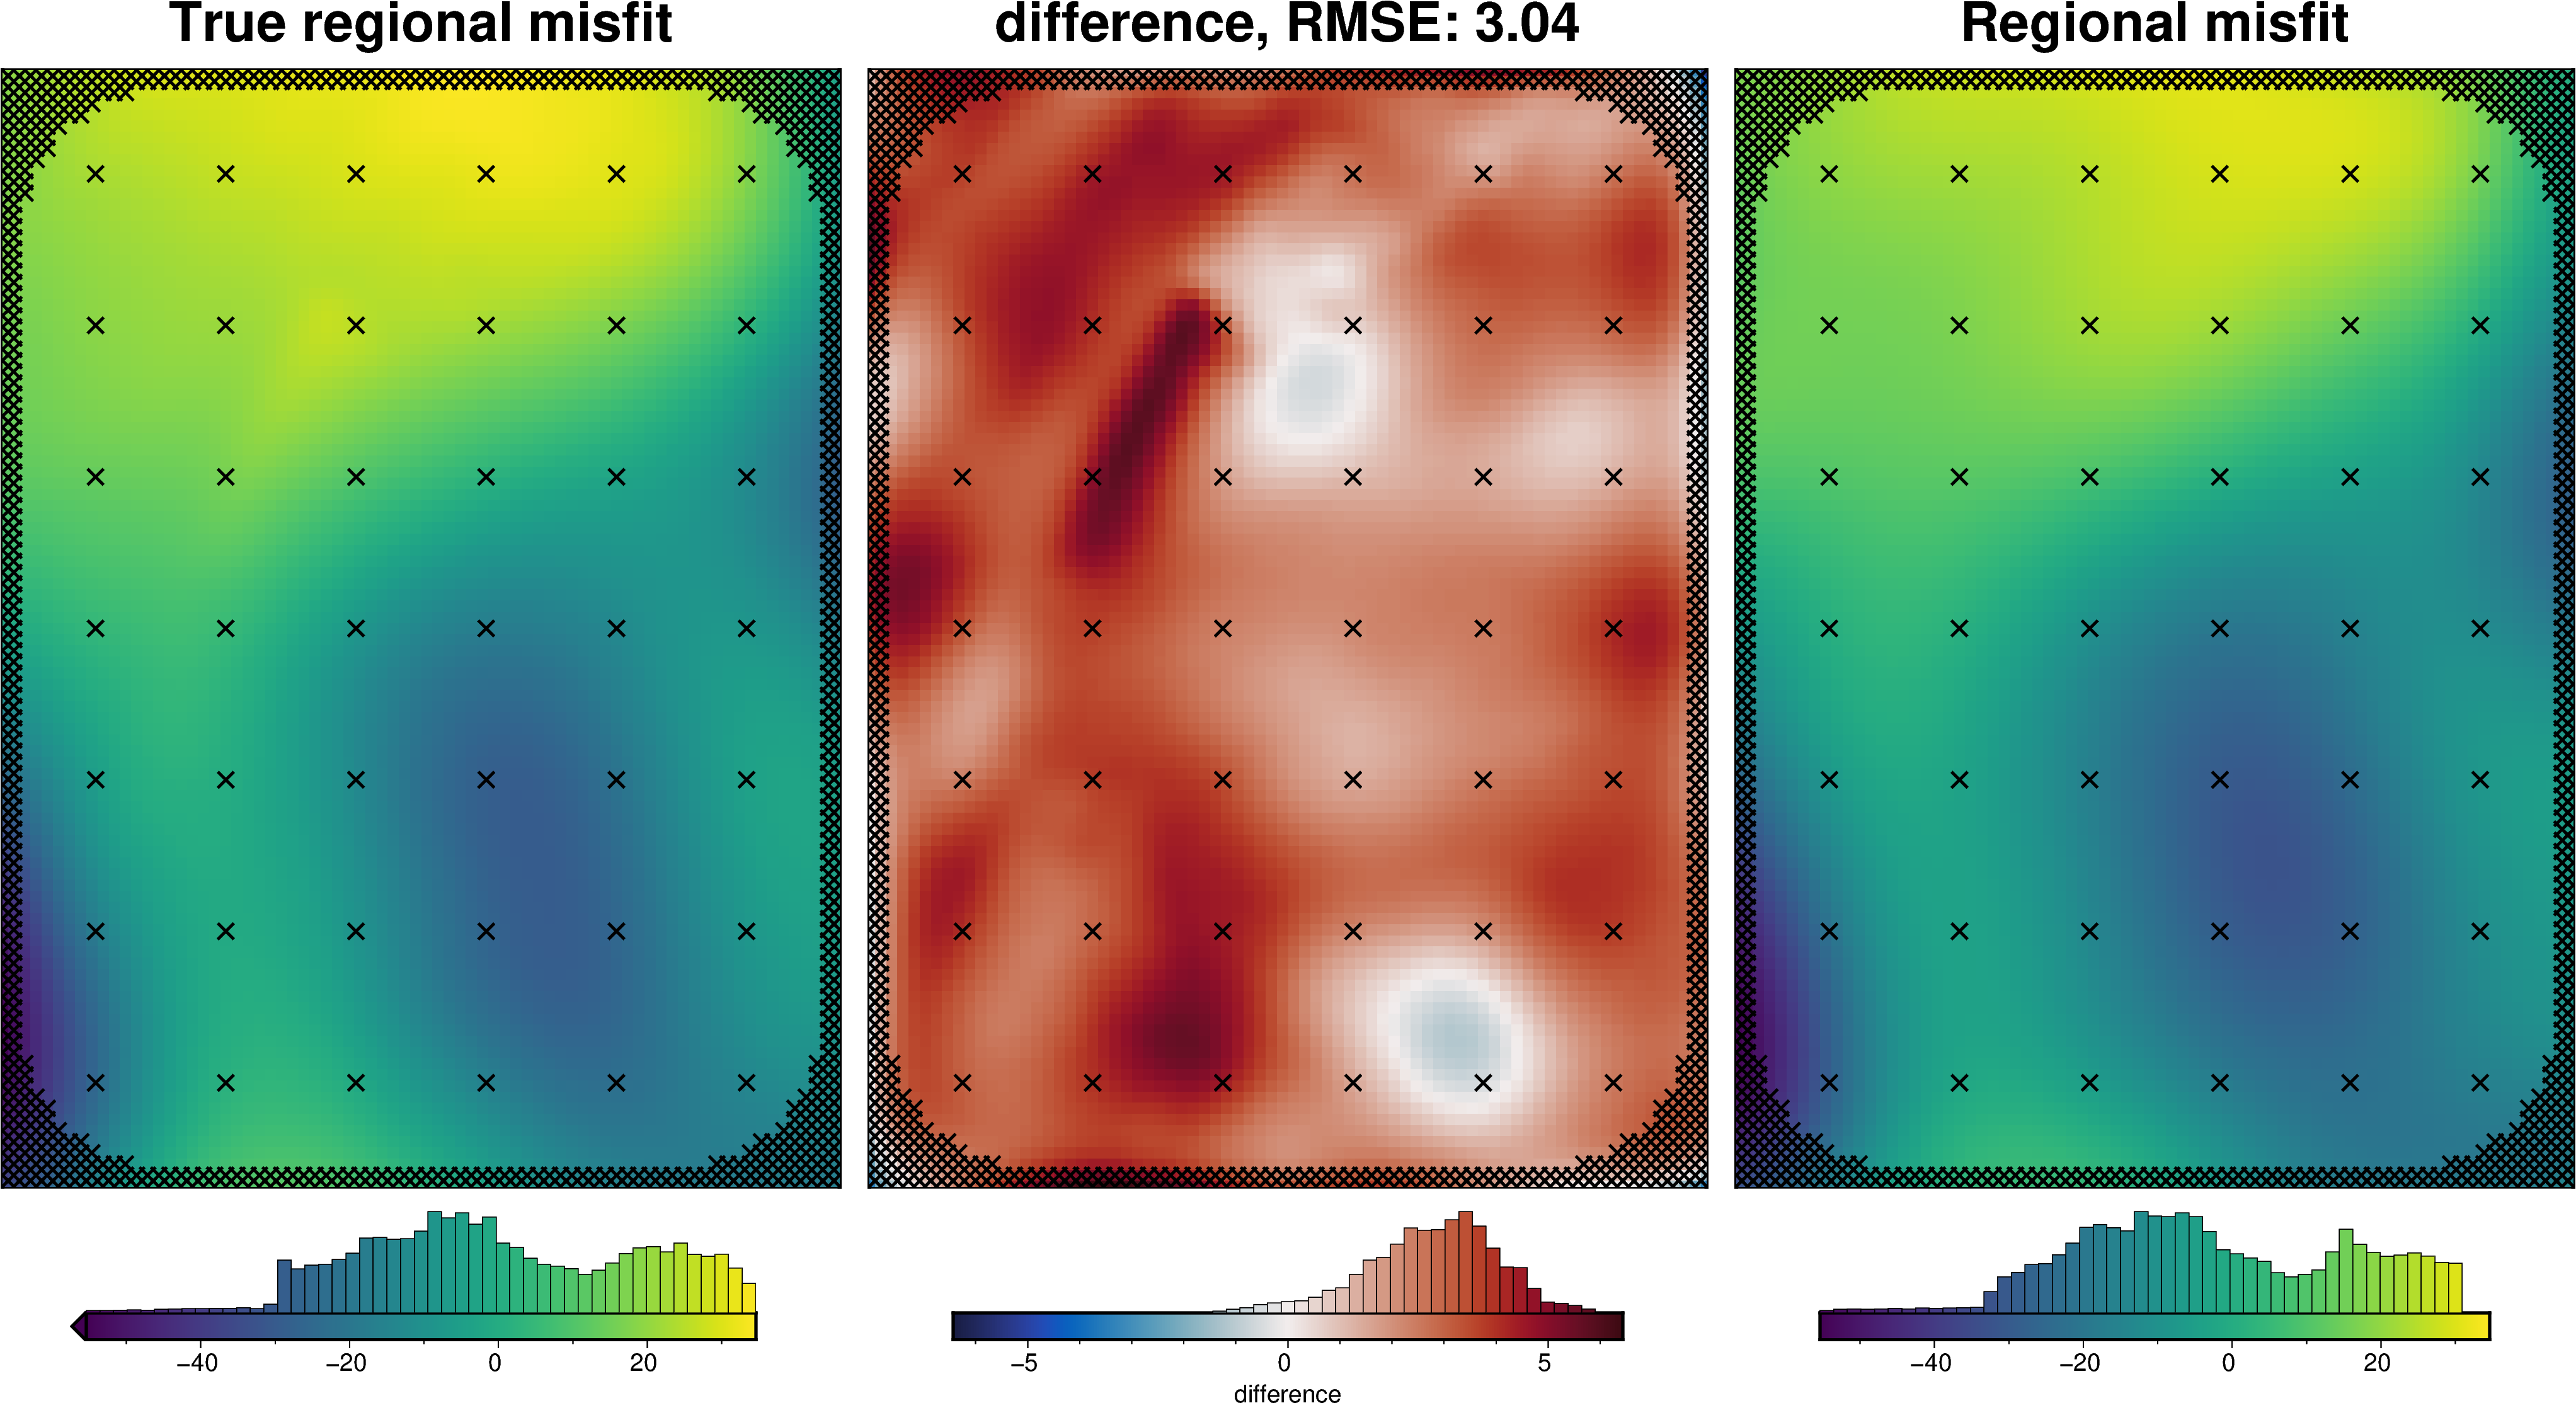
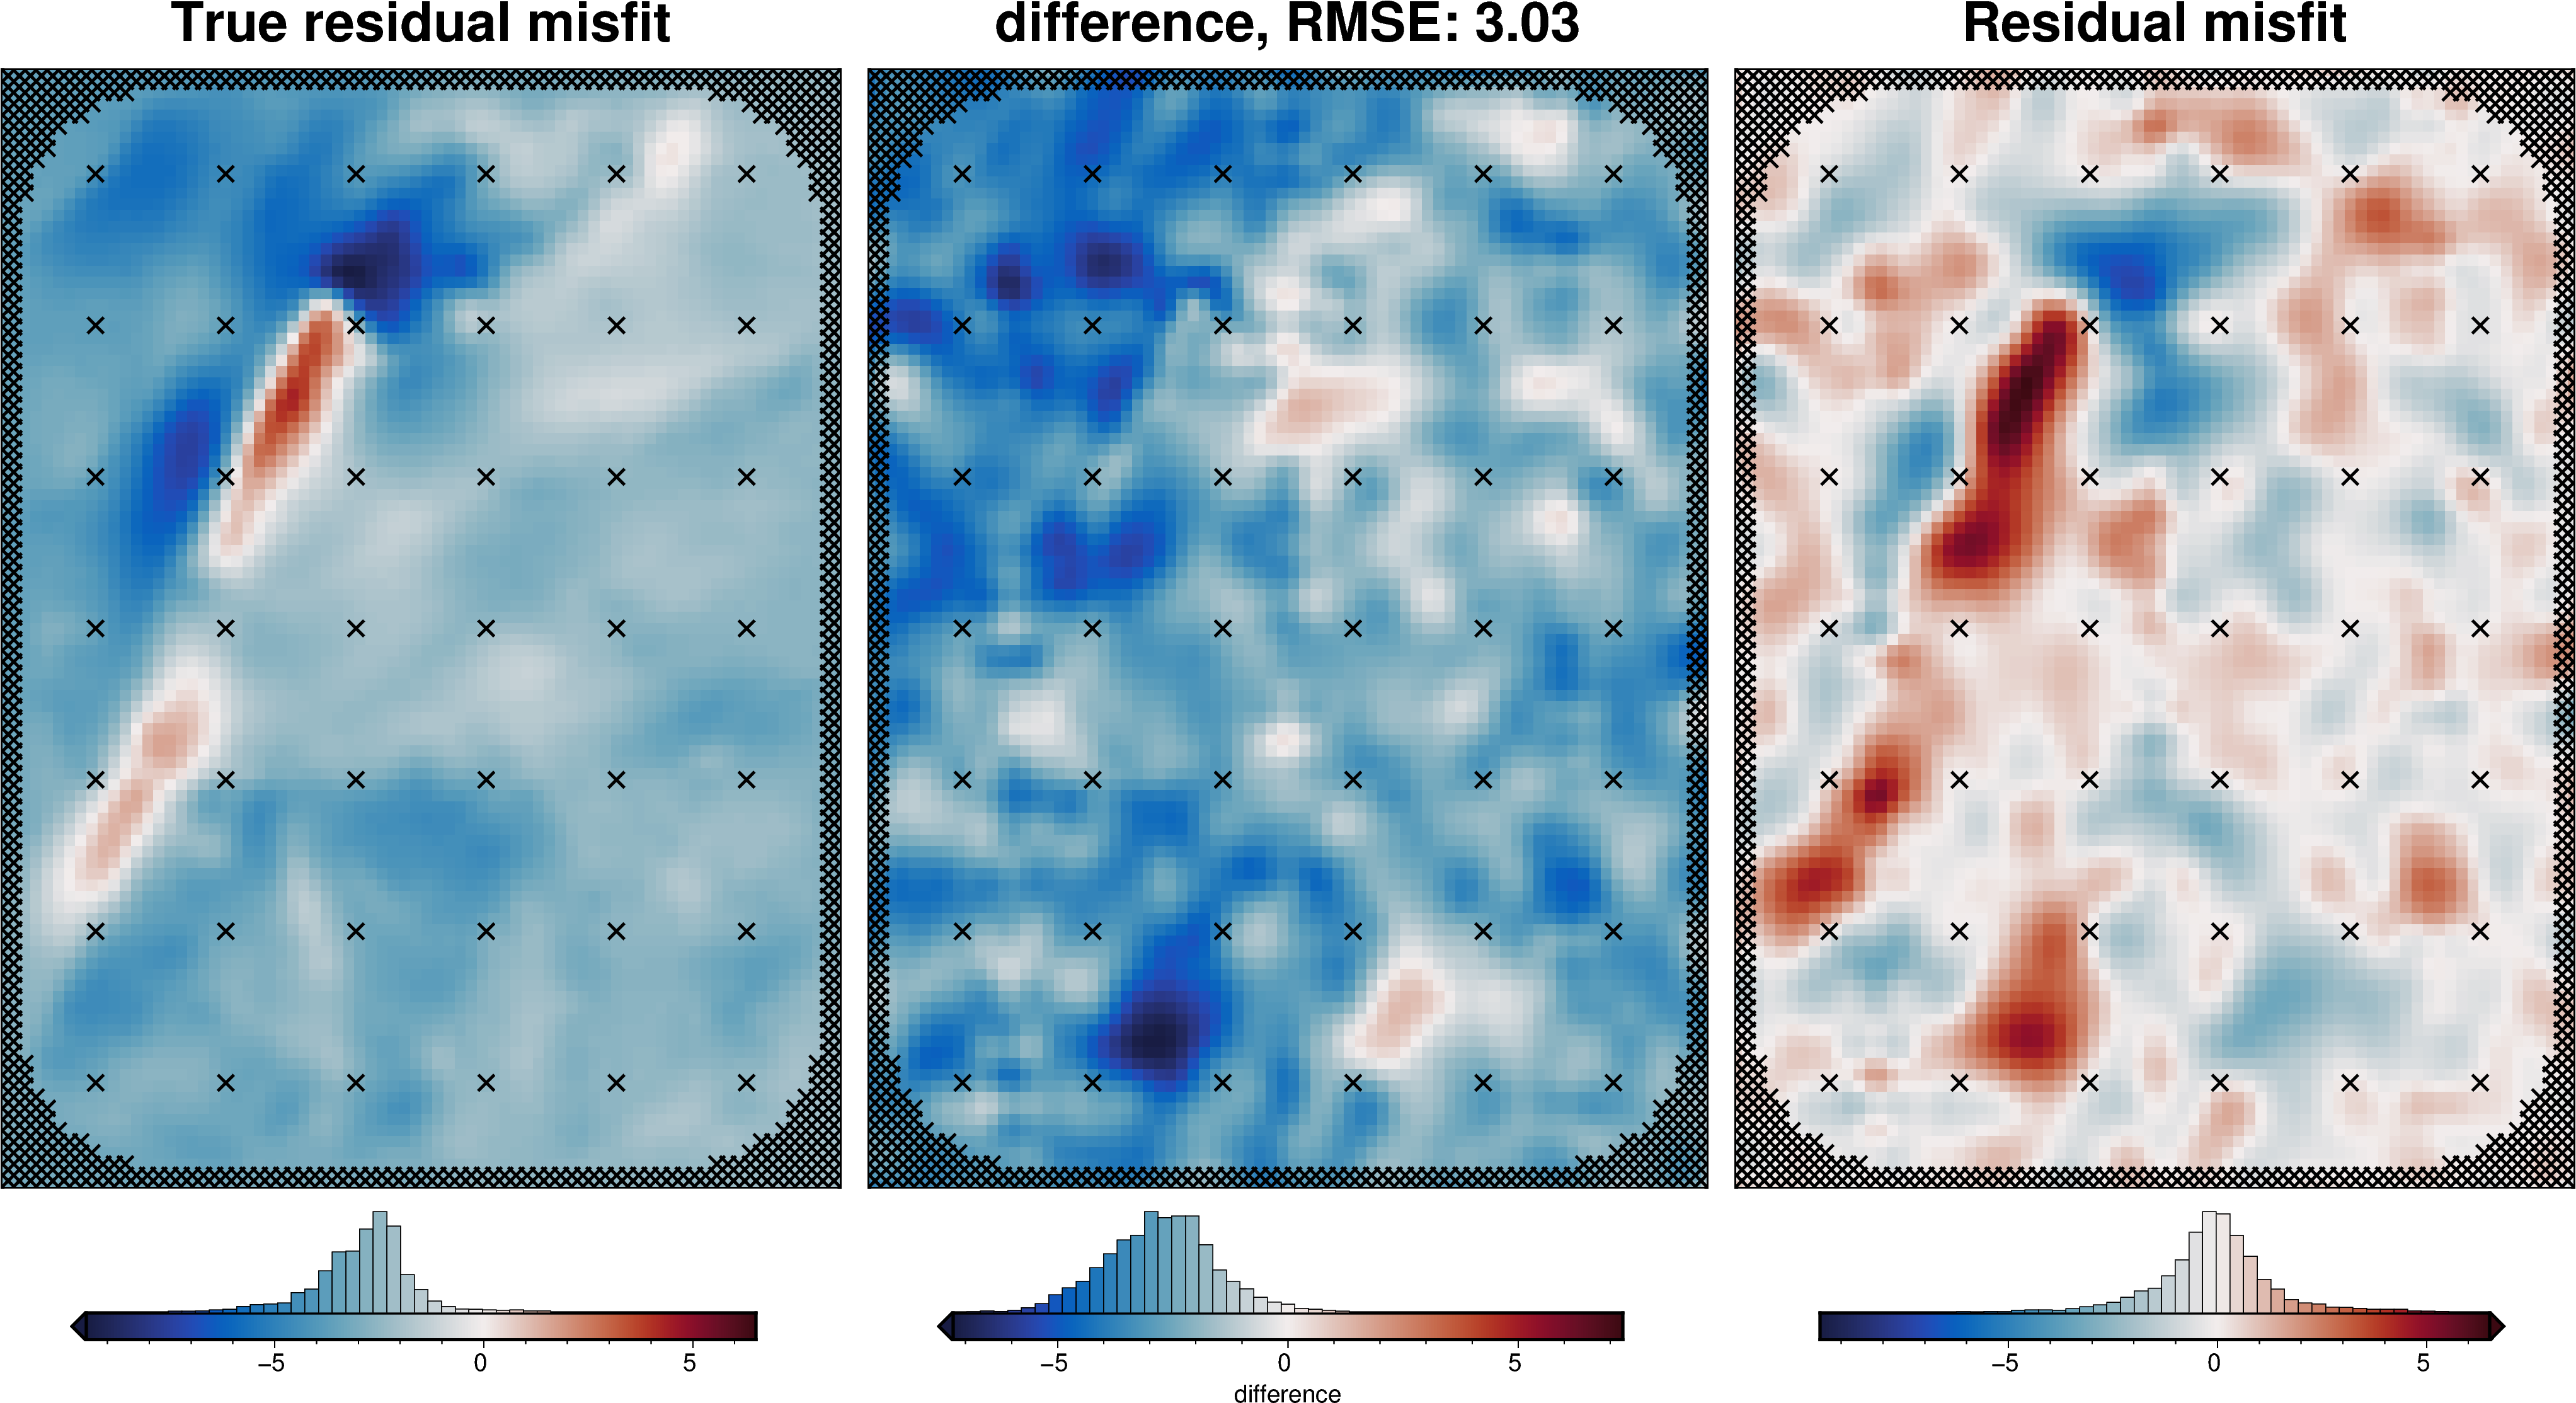
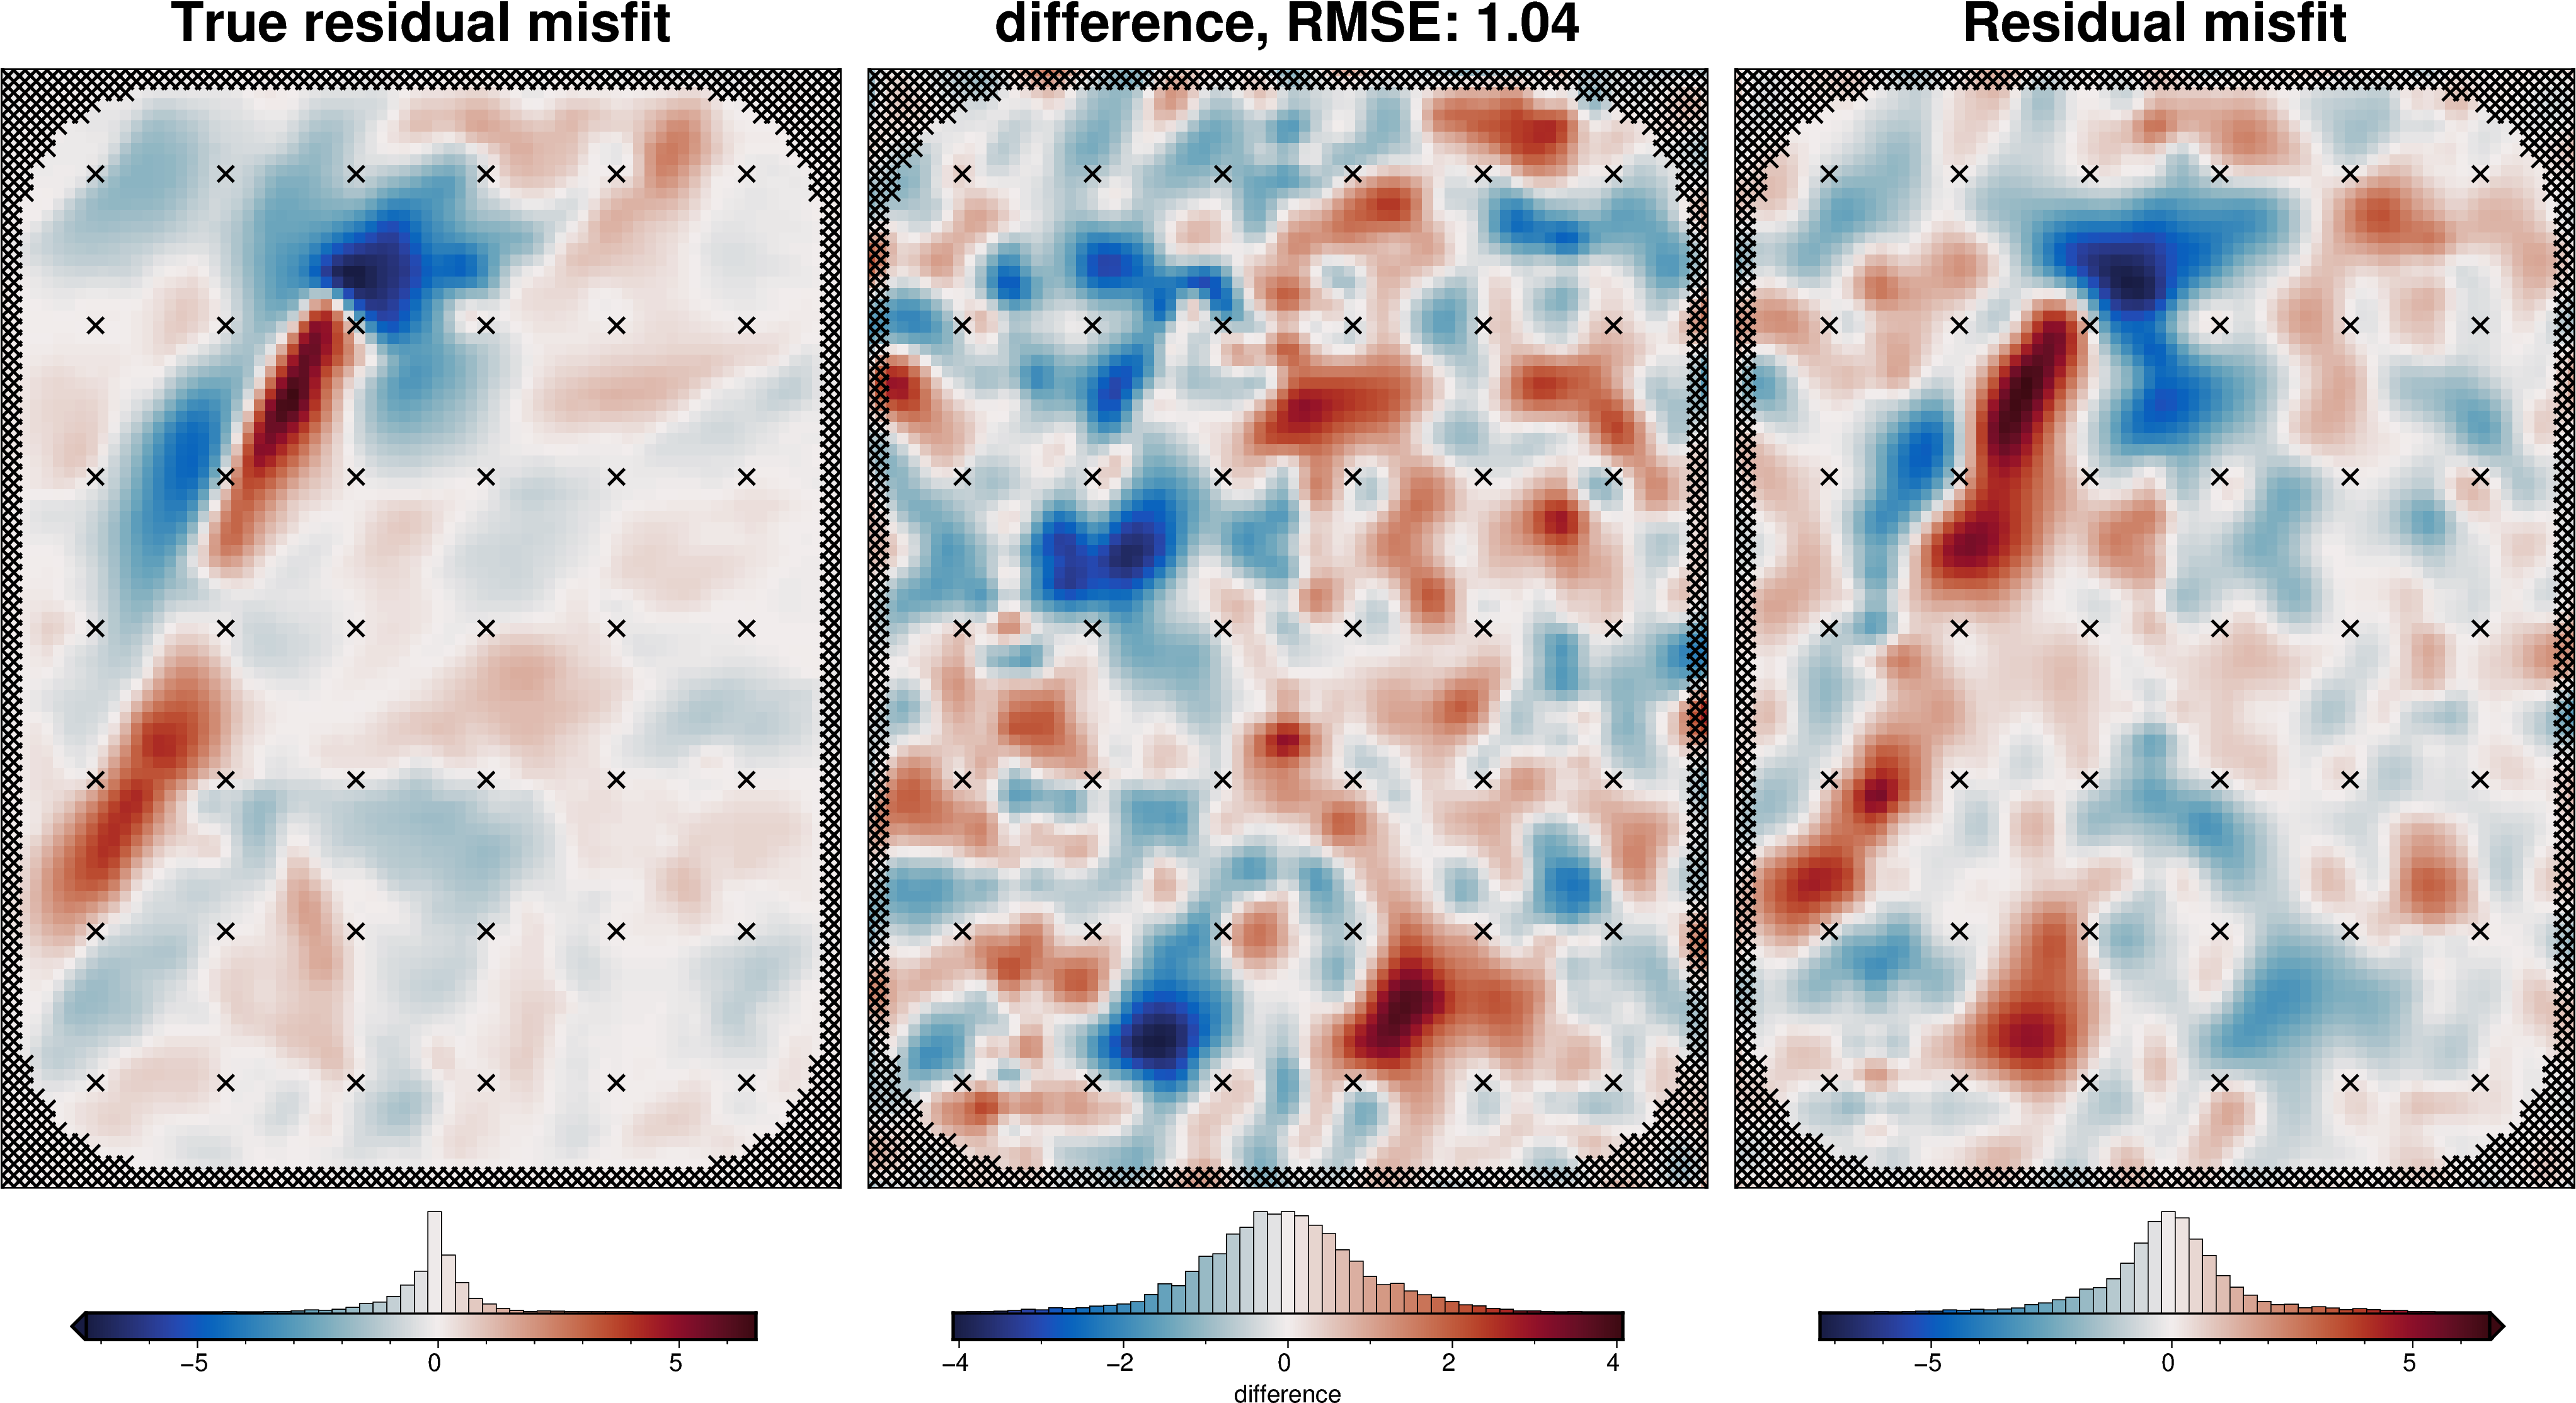
from polartoolkit import utils as polar_utils
import synthetic_bathymetry_inversion.plotting as synth_plotting
from synthetic_bathymetry_inversion import synthetic
os.environ["POLARTOOLKIT_HEMISPHERE"] = "south"
logging.getLogger().setLevel(logging.INFO)
/home/sungw937/miniforge3/envs/synthetic_bathymetry_inversion/lib/python3.12/site-packages/UQpy/__init__.py:6: UserWarning:
pkg_resources is deprecated as an API. See https://setuptools.pypa.io/en/latest/pkg_resources.html. The pkg_resources package is slated for removal as early as 2025-11-30. Refrain from using this package or pin to Setuptools<81.
[2]:
fpath = "../results/Ross_Sea/Ross_Sea_05"
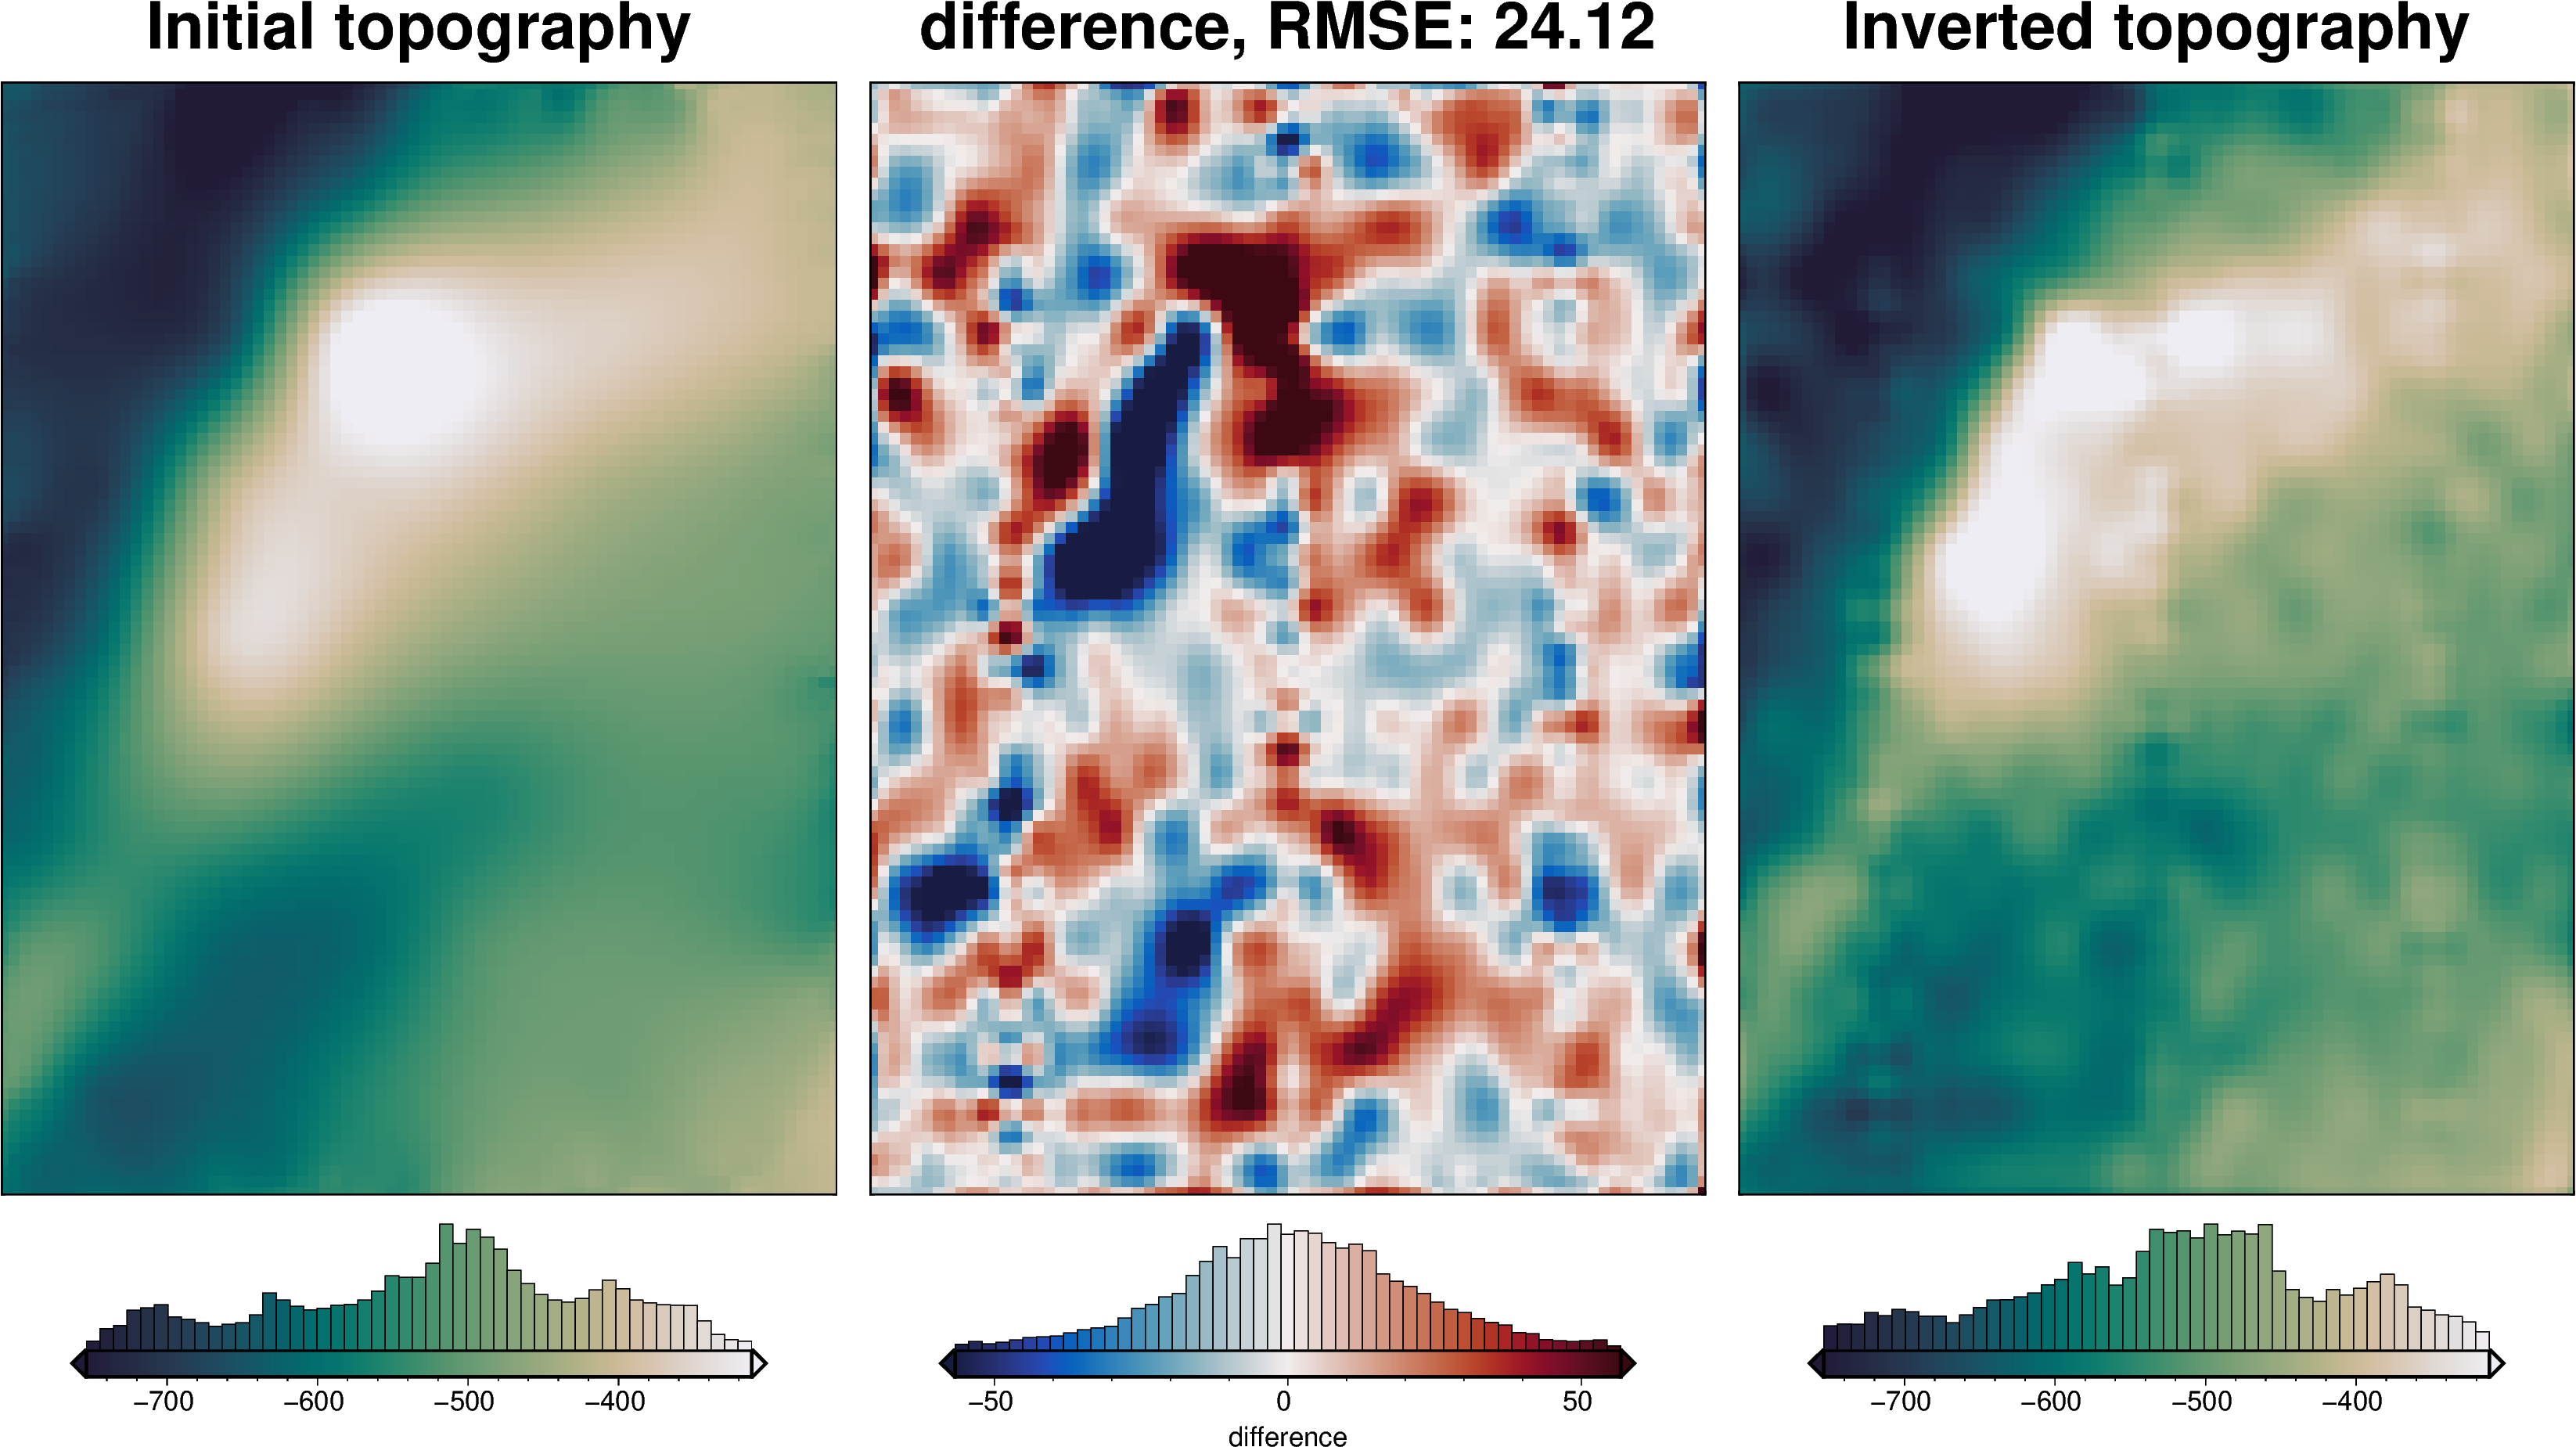
Get synthetic model data
[3]:
# set grid parameters
spacing = 2e3
inversion_region = (-40e3, 110e3, -1600e3, -1400e3)
true_density_contrast = 1476
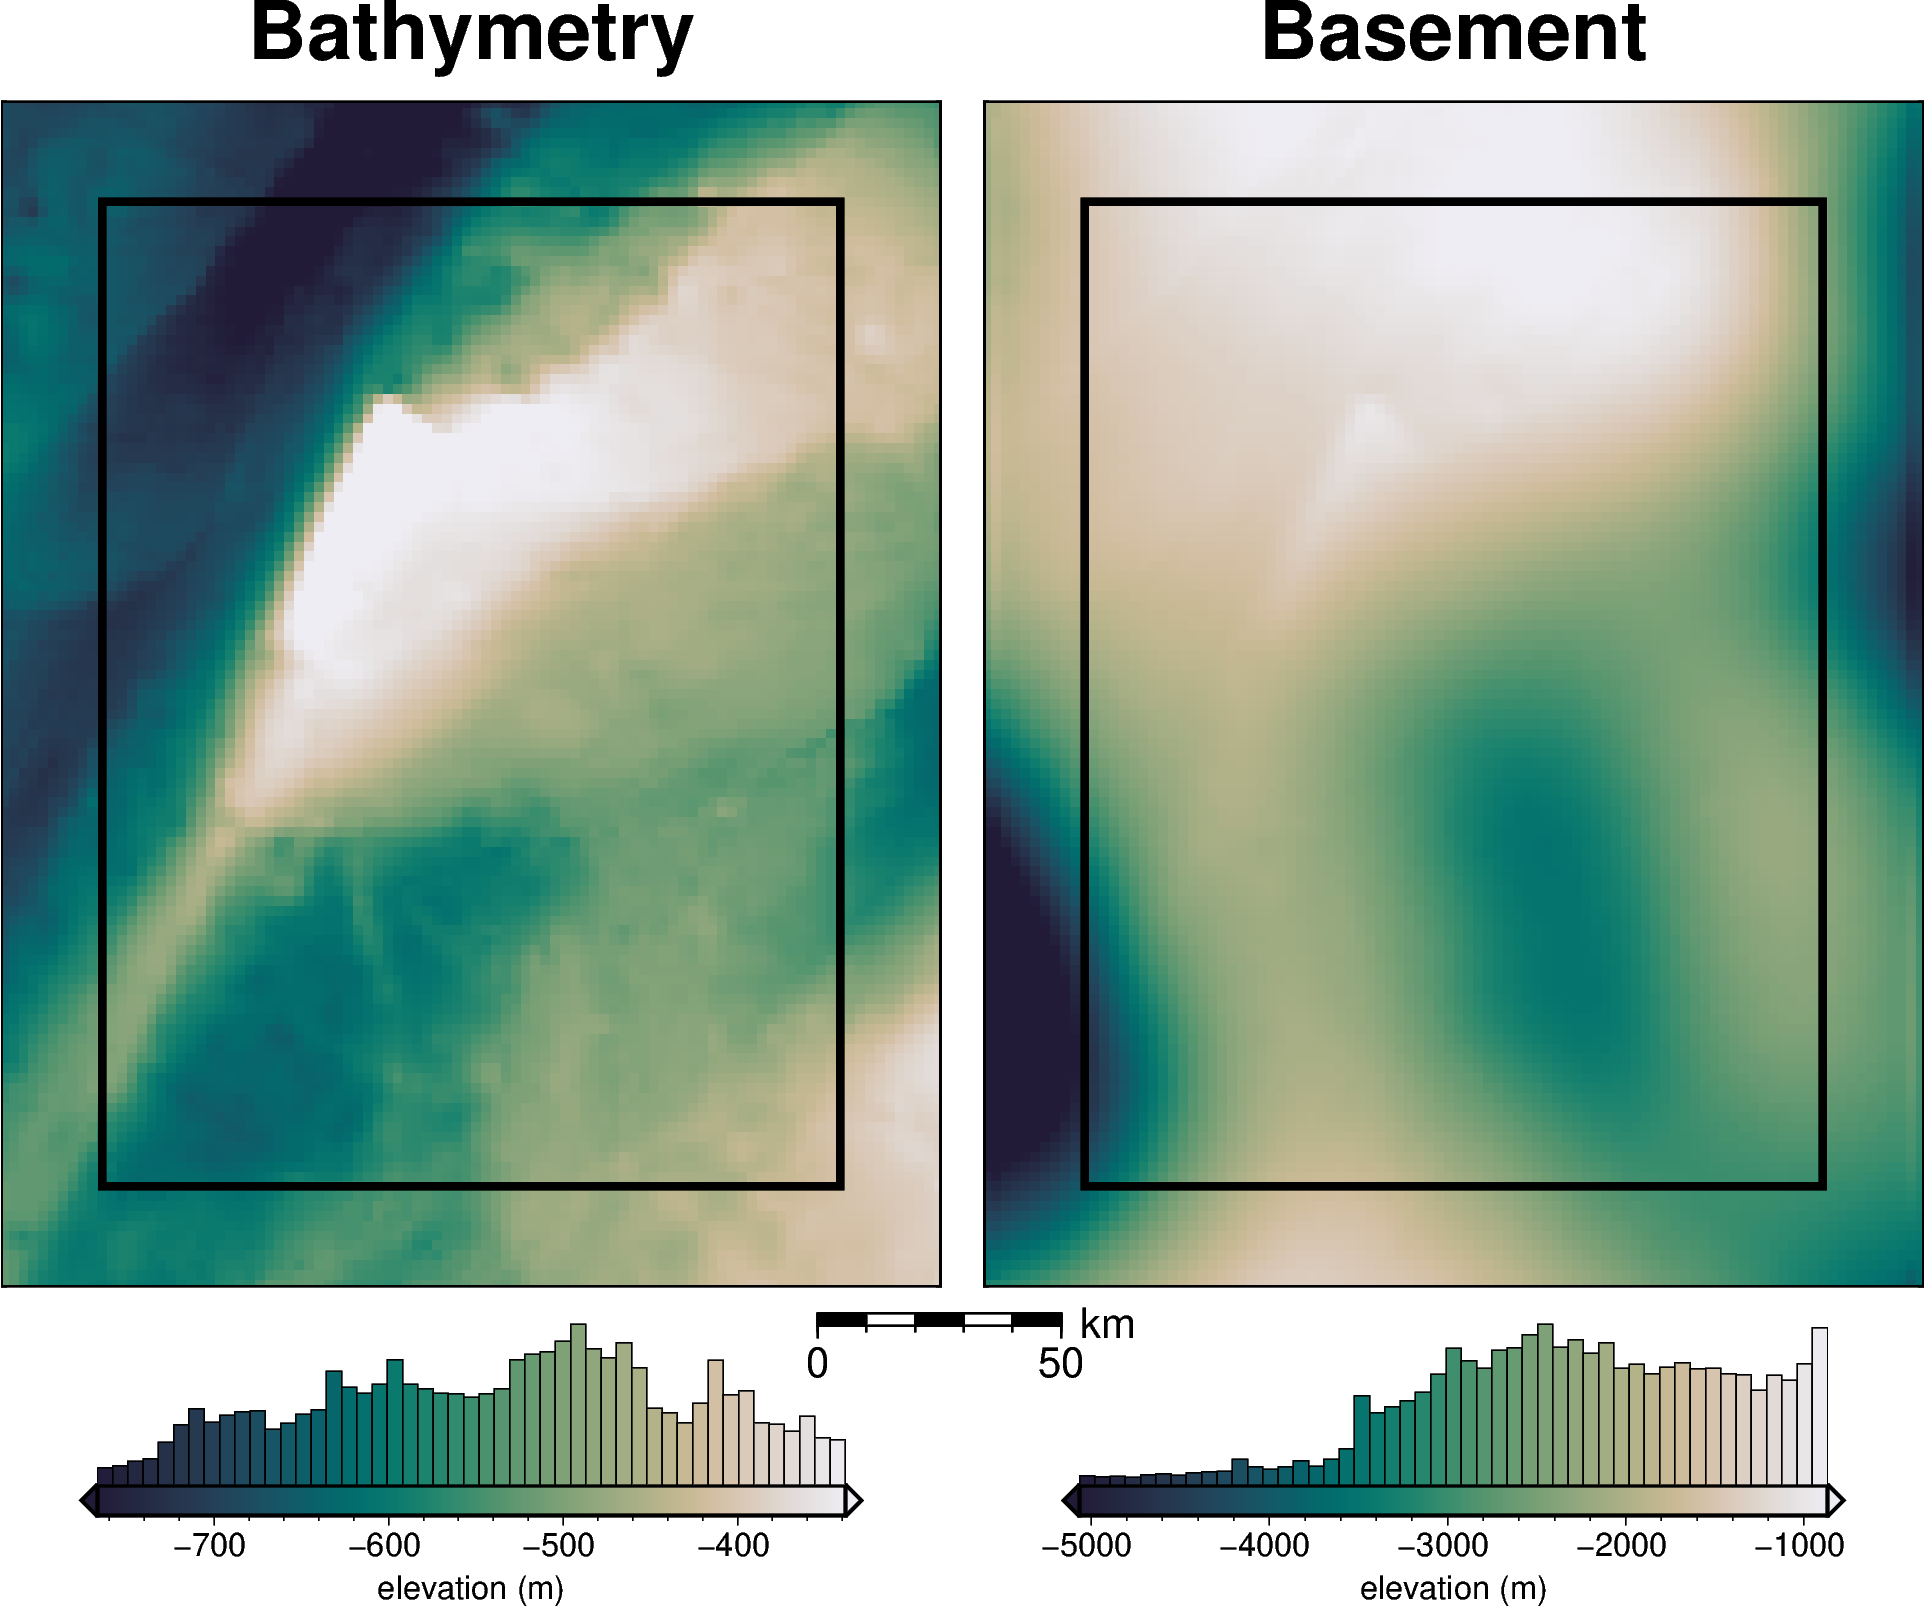
bathymetry, basement, grav_df = synthetic.load_synthetic_model(
spacing=spacing,
inversion_region=inversion_region,
buffer=spacing * 10,
basement=True,
zref=0,
bathymetry_density_contrast=true_density_contrast,
)
buffer_region = polar_utils.get_grid_info(bathymetry)[1]
grav_df.head()
requested spacing (2000.0) is smaller than the original (5000.0).
requested spacing (2000.0) is smaller than the original (5000.0).

[3]:
| northing | easting | upward | bathymetry_grav | basement_grav | disturbance | gravity_anomaly | |
|---|---|---|---|---|---|---|---|
| 0 | -1600000.0 | -40000.0 | 1000.0 | -35.551085 | -5.845685 | -41.396770 | -41.396770 |
| 1 | -1600000.0 | -38000.0 | 1000.0 | -36.054683 | -5.465801 | -41.520485 | -41.520485 |
| 2 | -1600000.0 | -36000.0 | 1000.0 | -36.473168 | -5.053773 | -41.526941 | -41.526941 |
| 3 | -1600000.0 | -34000.0 | 1000.0 | -36.755627 | -4.616487 | -41.372114 | -41.372114 |
| 4 | -1600000.0 | -32000.0 | 1000.0 | -36.951045 | -4.160973 | -41.112018 | -41.112018 |
[4]:
reg = grav_df.basement_grav
reg -= reg.mean()
utils.rmse(reg)
[4]:
np.float64(2.9630305782710358)
[5]:
# normalize regional gravity between -1 and 1
grav_df["basement_grav_normalized"] = (
vd.grid_to_table(
utils.normalize_xarray(
grav_df.set_index(["northing", "easting"]).to_xarray().basement_grav,
low=-1,
high=1,
)
)
.reset_index()
.basement_grav
)
grav_df = grav_df.drop(columns=["basement_grav", "disturbance", "gravity_anomaly"])
[6]:
# re-scale the regional gravity
regional_grav = utils.normalize_xarray(
grav_df.set_index(["northing", "easting"]).to_xarray().basement_grav_normalized,
low=0,
high=90,
).rename("basement_grav")
regional_grav -= regional_grav.mean()
# add to dataframe
grav_df["basement_grav"] = vd.grid_to_table(regional_grav).reset_index().basement_grav
# add basement and bathymetry forward gravities together to make observed gravity
grav_df["gravity_anomaly_full_res_no_noise"] = (
grav_df.bathymetry_grav + grav_df.basement_grav
)
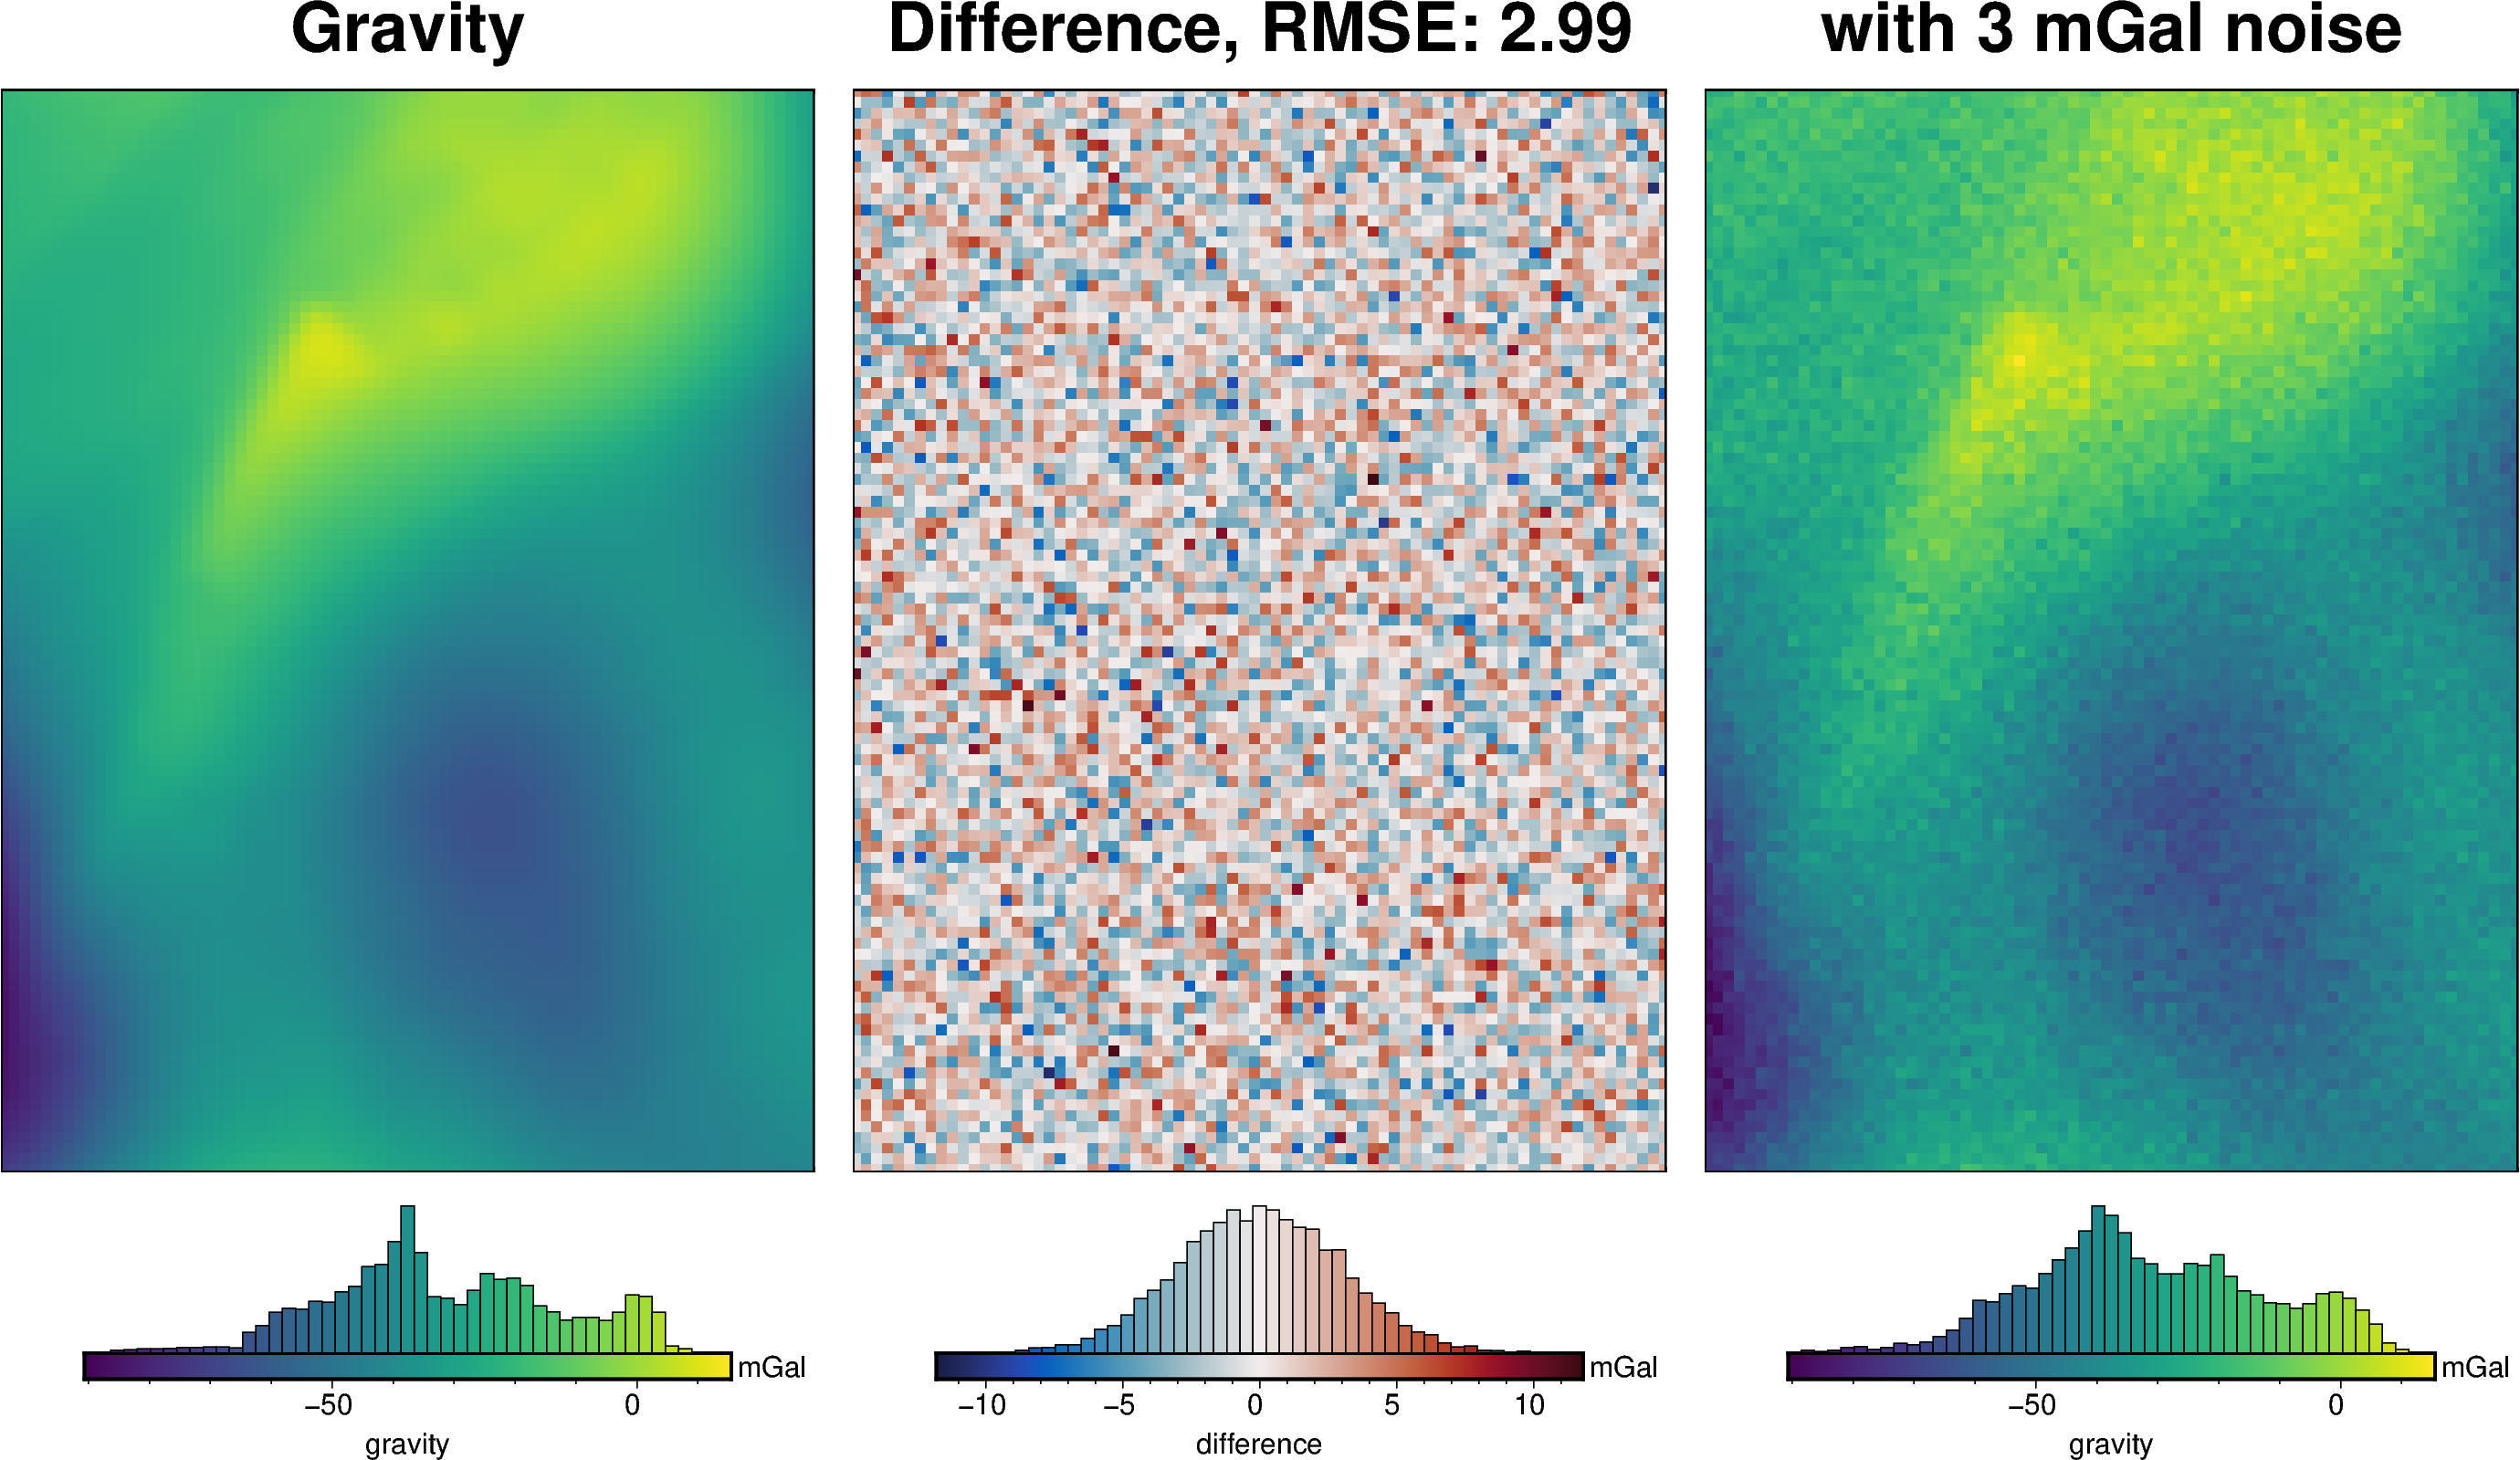
# add long-wavelength noise to the gravity anomaly
gravity_noise = 3 # 3 mGal after filtering gives 1 mGal RMSE
grav_df["gravity_anomaly_full_res"] = grav_df.gravity_anomaly_full_res_no_noise
cont = inv_synthetic.contaminate_with_long_wavelength_noise(
grav_df.set_index(["northing", "easting"])
.to_xarray()
.gravity_anomaly_full_res_no_noise,
coarsen_factor=None,
spacing=2e3,
noise_as_percent=False,
noise=gravity_noise,
)
df = vd.grid_to_table(cont.rename("gravity_anomaly_full_res")).reset_index(drop=True)
grav_df = pd.merge( # noqa: PD015
grav_df.drop(columns=["gravity_anomaly_full_res"], errors="ignore"),
df,
on=["easting", "northing"],
)
grav_df["uncert"] = gravity_noise
new_reg = grav_df.set_index(["northing", "easting"]).to_xarray().basement_grav
new_reg -= new_reg.mean()
print(utils.rmse(new_reg))
grav_df
18.399757267227116
[6]:
| northing | easting | upward | bathymetry_grav | basement_grav_normalized | basement_grav | gravity_anomaly_full_res_no_noise | gravity_anomaly_full_res | uncert | |
|---|---|---|---|---|---|---|---|---|---|
| 0 | -1600000.0 | -40000.0 | 1000.0 | -35.551085 | -0.575645 | -36.300394 | -71.851479 | -72.911198 | 3 |
| 1 | -1600000.0 | -38000.0 | 1000.0 | -36.054683 | -0.523223 | -33.941405 | -69.996088 | -72.483909 | 3 |
| 2 | -1600000.0 | -36000.0 | 1000.0 | -36.473168 | -0.466365 | -31.382798 | -67.855967 | -68.870245 | 3 |
| 3 | -1600000.0 | -34000.0 | 1000.0 | -36.755627 | -0.406022 | -28.667352 | -65.422980 | -61.536475 | 3 |
| 4 | -1600000.0 | -32000.0 | 1000.0 | -36.951045 | -0.343163 | -25.838709 | -62.789754 | -65.528788 | 3 |
| ... | ... | ... | ... | ... | ... | ... | ... | ... | ... |
| 7671 | -1400000.0 | 102000.0 | 1000.0 | -25.760090 | 0.399167 | 7.566127 | -18.193963 | -19.271274 | 3 |
| 7672 | -1400000.0 | 104000.0 | 1000.0 | -25.911429 | 0.334798 | 4.669511 | -21.241918 | -24.226858 | 3 |
| 7673 | -1400000.0 | 106000.0 | 1000.0 | -26.032814 | 0.268741 | 1.696963 | -24.335851 | -19.966292 | 3 |
| 7674 | -1400000.0 | 108000.0 | 1000.0 | -26.121903 | 0.201716 | -1.319170 | -27.441073 | -21.510609 | 3 |
| 7675 | -1400000.0 | 110000.0 | 1000.0 | -26.206160 | 0.134418 | -4.347560 | -30.553720 | -34.929273 | 3 |
7676 rows × 9 columns
[7]:
grav_grid = grav_df.set_index(["northing", "easting"]).to_xarray()
_ = polar_utils.grd_compare(
grav_grid.gravity_anomaly_full_res_no_noise,
grav_grid.gravity_anomaly_full_res,
fig_height=10,
plot=True,
grid1_name="Gravity",
grid2_name=f"with {gravity_noise} mGal noise",
title="Difference",
title_font="18p,Helvetica-Bold,black",
cbar_unit="mGal",
cbar_label="gravity",
region=inversion_region,
inset=False,
hist=True,
label_font="16p,Helvetica,black",
)
Create synthetic airborne survey
[8]:
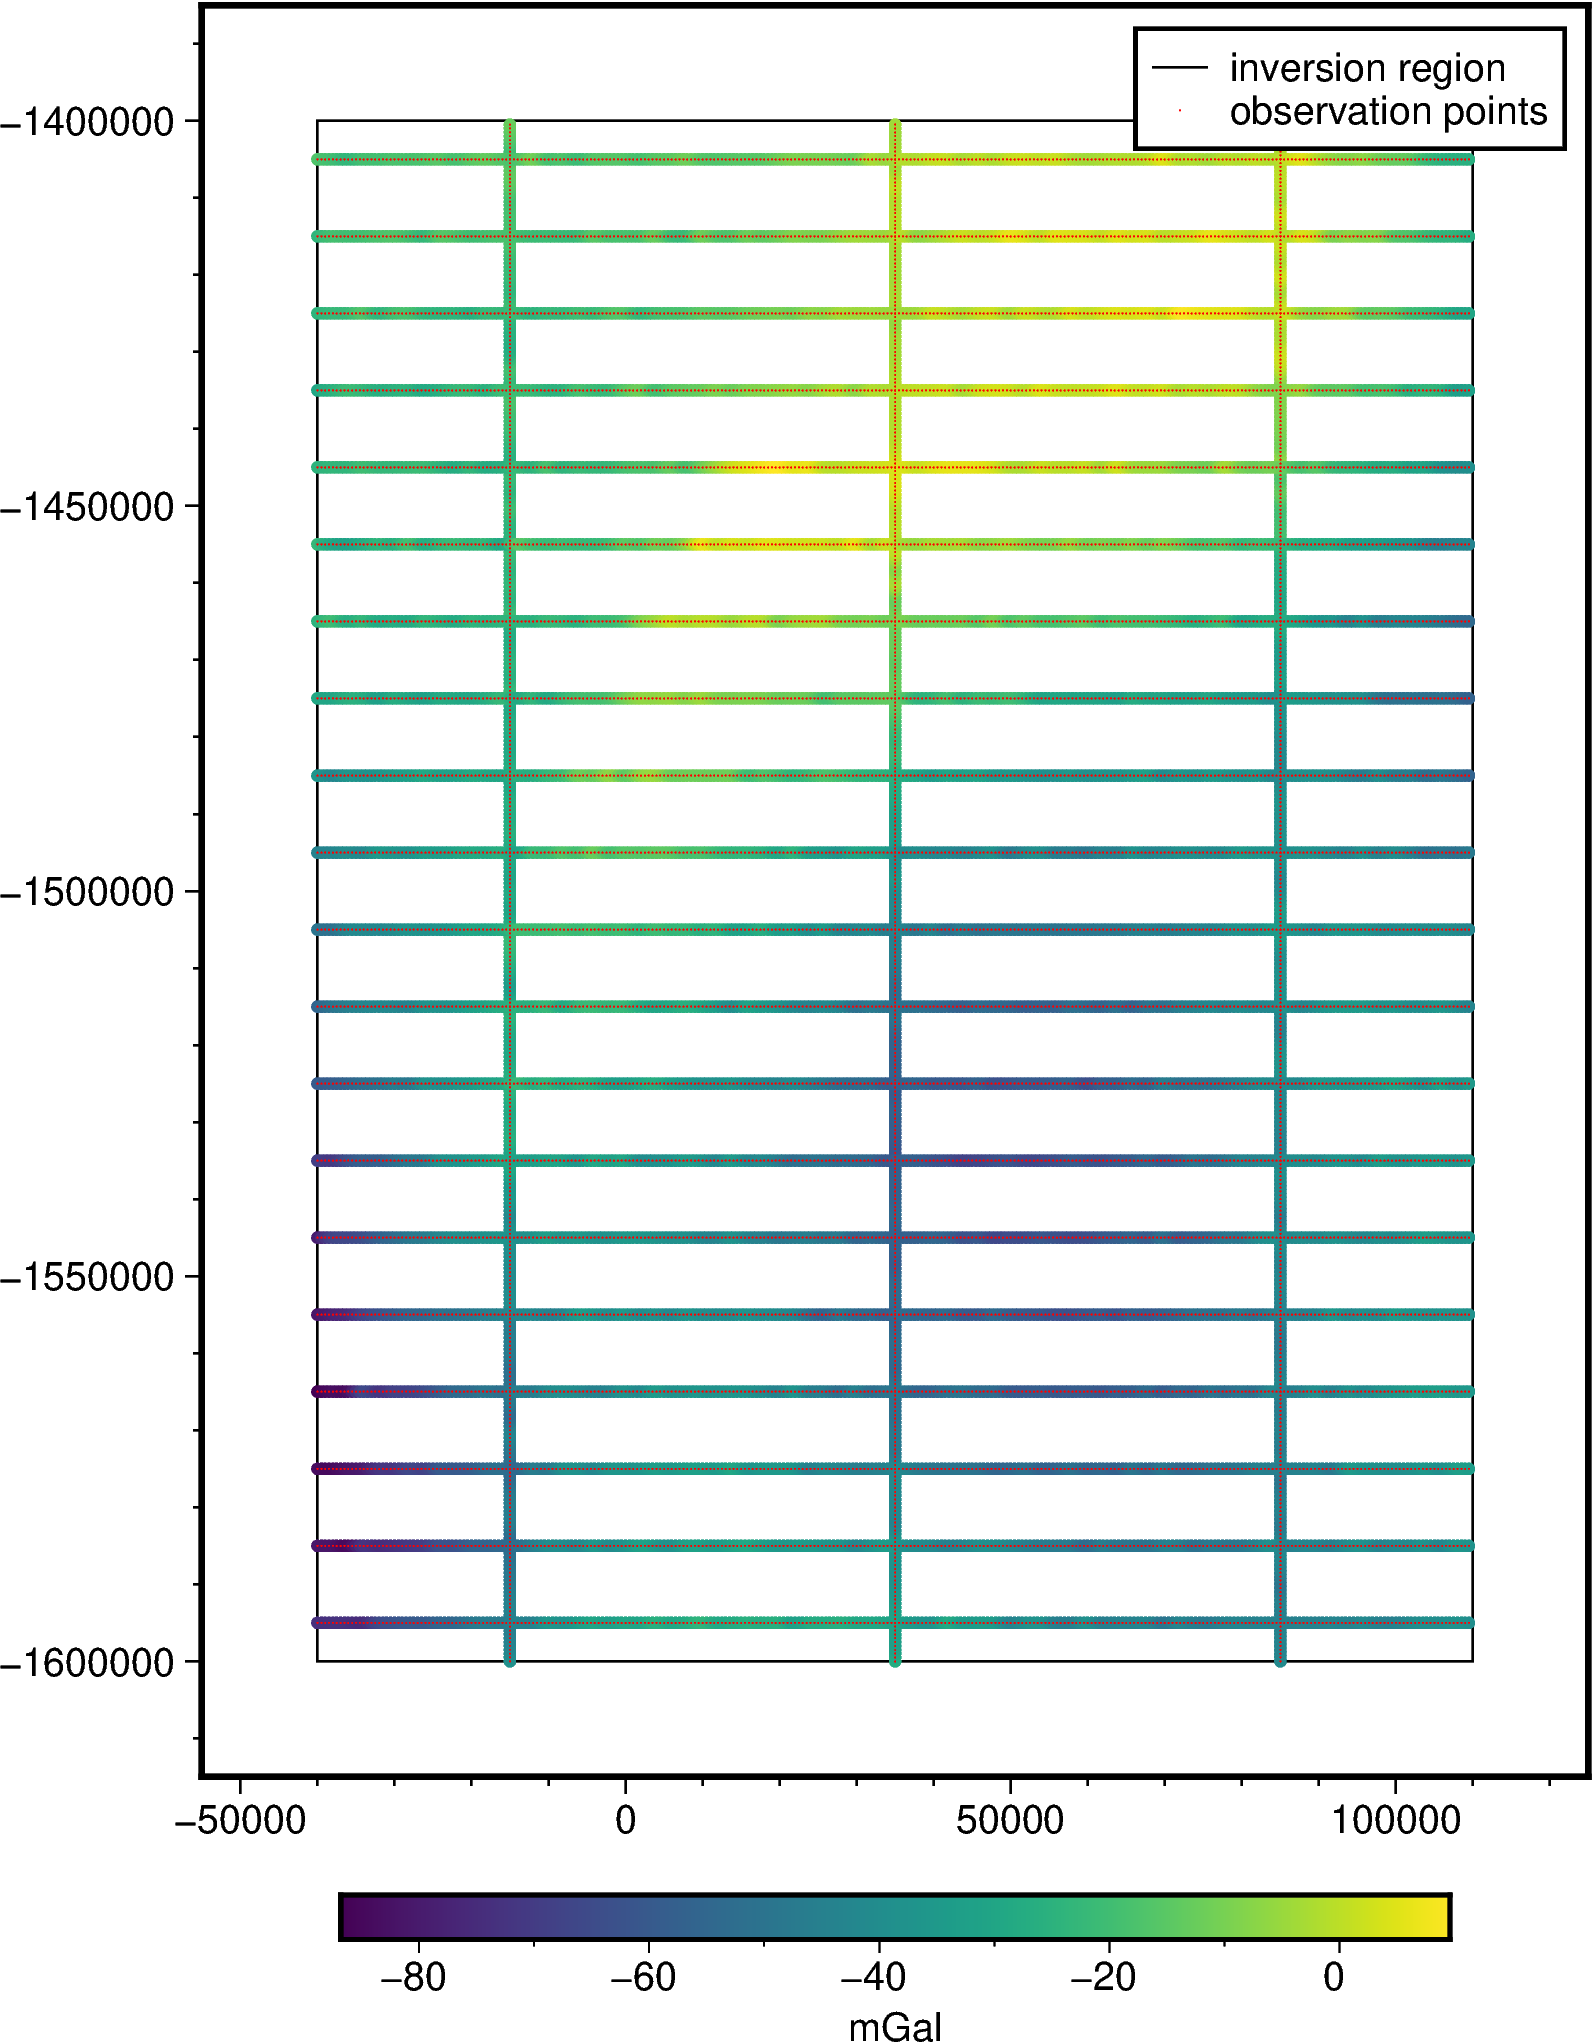
grav_survey_df = synthetic.airborne_survey(
along_line_spacing=500,
grav_observation_height=1e3,
ns_line_spacing=50e3,
ew_line_spacing=10e3,
region=inversion_region,
grav_grid=grav_df.set_index(
["northing", "easting"]
).gravity_anomaly_full_res.to_xarray(),
plot=True,
)
grav_survey_df["gravity_anomaly_unfilt"] = grav_survey_df.gravity_anomaly
grav_survey_df
plotted values not provided via 'grid', so cannot determine if to add colorbar end triangles or not.
[8]:
| northing | easting | upward | line | time | geometry | dist_along_line | gravity_anomaly | gravity_anomaly_unfilt | |
|---|---|---|---|---|---|---|---|---|---|
| 0 | -1600000.0 | -15000.0 | 1000.0 | 1000.0 | 0.0 | POINT (-15000 -1600000) | 0.0 | -38.318978 | -38.318978 |
| 1 | -1600000.0 | 35000.0 | 1000.0 | 1010.0 | 0.0 | POINT (35000 -1600000) | 0.0 | -27.055216 | -27.055216 |
| 2 | -1600000.0 | 85000.0 | 1000.0 | 1020.0 | 0.0 | POINT (85000 -1600000) | 0.0 | -41.147131 | -41.147131 |
| 3 | -1599500.0 | -15000.0 | 1000.0 | 1000.0 | 1.0 | POINT (-15000 -1599500) | 500.0 | -39.712112 | -39.712112 |
| 4 | -1599500.0 | 35000.0 | 1000.0 | 1010.0 | 1.0 | POINT (35000 -1599500) | 500.0 | -28.659682 | -28.659682 |
| ... | ... | ... | ... | ... | ... | ... | ... | ... | ... |
| 5995 | -1405000.0 | 107500.0 | 1000.0 | 29.0 | 295.0 | POINT (107500 -1405000) | 147500.0 | -25.516940 | -25.516940 |
| 5996 | -1405000.0 | 108000.0 | 1000.0 | 29.0 | 296.0 | POINT (108000 -1405000) | 148000.0 | -25.615473 | -25.615473 |
| 5997 | -1405000.0 | 108500.0 | 1000.0 | 29.0 | 297.0 | POINT (108500 -1405000) | 148500.0 | -25.840151 | -25.840151 |
| 5998 | -1405000.0 | 109000.0 | 1000.0 | 29.0 | 298.0 | POINT (109000 -1405000) | 149000.0 | -26.102471 | -26.102471 |
| 5999 | -1405000.0 | 109500.0 | 1000.0 | 29.0 | 299.0 | POINT (109500 -1405000) | 149500.0 | -26.123092 | -26.123092 |
7200 rows × 9 columns
[9]:
grav_survey_df = profiles.sample_grids(
grav_survey_df,
grav_df.set_index(
["northing", "easting"]
).gravity_anomaly_full_res_no_noise.to_xarray(),
sampled_name="gravity_anomaly_no_noise",
)
[10]:
synth_plotting.plotly_profiles(
grav_survey_df[grav_survey_df.line == 29],
x="dist_along_line",
y=("gravity_anomaly_no_noise", "gravity_anomaly_unfilt"),
title="Gravity anomaly profiles",
)
[12]:
filter_widths = np.arange(0, 34e3, 2e3)
filter_widths
[12]:
array([ 0., 2000., 4000., 6000., 8000., 10000., 12000., 14000.,
16000., 18000., 20000., 22000., 24000., 26000., 28000., 30000.,
32000.])
[13]:
dfs = []
difs = []
for f in filter_widths:
survey_df = grav_survey_df.copy()
if f == 0:
survey_df["grav_anomaly_filt"] = survey_df.gravity_anomaly
fig = None
origin_shift = "initialize"
else:
survey_df["grav_anomaly_filt"] = synthetic.filter_flight_lines(
survey_df,
data_column="gravity_anomaly",
filt_type=f"g{f}",
)
origin_shift = "x"
survey_df["dif"] = survey_df.gravity_anomaly_no_noise - survey_df.grav_anomaly_filt
difs.append(survey_df)
dfs.append(
pd.DataFrame(
[
{
"filt_width": f,
"rmse": utils.rmse(survey_df.dif),
}
]
)
)
df = pd.concat(dfs, ignore_index=True)
df
[13]:
| filt_width | rmse | |
|---|---|---|
| 0 | 0.0 | 2.167952 |
| 1 | 2000.0 | 2.088631 |
| 2 | 4000.0 | 1.904699 |
| 3 | 6000.0 | 1.705415 |
| 4 | 8000.0 | 1.534219 |
| 5 | 10000.0 | 1.398401 |
| 6 | 12000.0 | 1.293373 |
| 7 | 14000.0 | 1.213314 |
| 8 | 16000.0 | 1.153512 |
| 9 | 18000.0 | 1.110549 |
| 10 | 20000.0 | 1.081983 |
| 11 | 22000.0 | 1.065976 |
| 12 | 24000.0 | 1.061037 |
| 13 | 26000.0 | 1.065891 |
| 14 | 28000.0 | 1.079406 |
| 15 | 30000.0 | 1.100567 |
| 16 | 32000.0 | 1.128482 |
[14]:
# save to a csv
df.to_csv(f"{fpath}_filter_width_rmse.csv", index=False)
[15]:
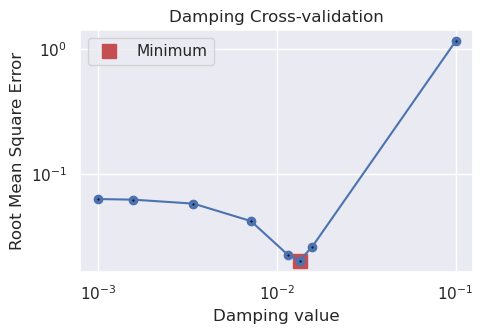
fig, ax = plt.subplots(figsize=(4, 3))
ax.plot(
df.filt_width / 1e3,
df.rmse,
marker="o",
)
best_ind = df.rmse.idxmin()
ax.scatter(
x=df.iloc[best_ind].filt_width / 1e3,
y=df.iloc[best_ind].rmse,
marker="s",
color="r",
s=80,
zorder=20,
label=f"Best: {round(df.iloc[best_ind].filt_width / 1e3, 2)} km",
)
ax.legend()
ax.set_xlabel("Filter width (km)")
ax.set_ylabel("RMSE (mGal)")
ax.set_title("Low-pass filtering of gravity data")
[15]:
Text(0.5, 1.0, 'Low-pass filtering of gravity data')

[16]:
filt_width = df.iloc[df.rmse.idxmin()].filt_width
print(f"Filter width: {filt_width / 1e3} km")
# filter each line in 1D with a Gaussian filter to remove some noise
grav_survey_df["gravity_anomaly"] = synthetic.filter_flight_lines(
grav_survey_df,
data_column="gravity_anomaly_unfilt",
filt_type=f"g{filt_width}",
)
Filter width: 24.0 km
[17]:
synth_plotting.plotly_profiles(
grav_survey_df[grav_survey_df.line == 29],
x="dist_along_line",
y=("gravity_anomaly_no_noise", "gravity_anomaly", "gravity_anomaly_unfilt"),
title="Gravity anomaly profiles",
)
[18]:
# grid the airborne survey data over the whole grid
coords = (grav_survey_df.easting, grav_survey_df.northing, grav_survey_df.upward)
data = grav_survey_df.gravity_anomaly
eq_study, eqs = optimization.optimize_eq_source_params(
coords,
data,
n_trials=12,
damping_limits=(1e-4, 10),
depth_limits=(100, 100e3),
block_size=spacing,
plot=True,
fname=f"{fpath}_eq_sources",
)
[19]:
# predict sources onto grid
grav_df["eqs_gravity_anomaly"] = eqs.predict(
(
grav_df.easting,
grav_df.northing,
grav_df.upward, # either grav_df.upward or user-set constant value
),
)
grav_df["gravity_anomaly"] = grav_df.eqs_gravity_anomaly
grav_df
[19]:
| northing | easting | upward | bathymetry_grav | basement_grav_normalized | basement_grav | gravity_anomaly_full_res_no_noise | gravity_anomaly_full_res | uncert | eqs_gravity_anomaly | gravity_anomaly | |
|---|---|---|---|---|---|---|---|---|---|---|---|
| 0 | -1600000.0 | -40000.0 | 1000.0 | -35.551085 | -0.575645 | -36.300394 | -71.851479 | -72.911198 | 3 | -64.481389 | -64.481389 |
| 1 | -1600000.0 | -38000.0 | 1000.0 | -36.054683 | -0.523223 | -33.941405 | -69.996088 | -72.483909 | 3 | -64.163085 | -64.163085 |
| 2 | -1600000.0 | -36000.0 | 1000.0 | -36.473168 | -0.466365 | -31.382798 | -67.855967 | -68.870245 | 3 | -63.178870 | -63.178870 |
| 3 | -1600000.0 | -34000.0 | 1000.0 | -36.755627 | -0.406022 | -28.667352 | -65.422980 | -61.536475 | 3 | -61.636021 | -61.636021 |
| 4 | -1600000.0 | -32000.0 | 1000.0 | -36.951045 | -0.343163 | -25.838709 | -62.789754 | -65.528788 | 3 | -59.623519 | -59.623519 |
| ... | ... | ... | ... | ... | ... | ... | ... | ... | ... | ... | ... |
| 7671 | -1400000.0 | 102000.0 | 1000.0 | -25.760090 | 0.399167 | 7.566127 | -18.193963 | -19.271274 | 3 | -15.904465 | -15.904465 |
| 7672 | -1400000.0 | 104000.0 | 1000.0 | -25.911429 | 0.334798 | 4.669511 | -21.241918 | -24.226858 | 3 | -18.079420 | -18.079420 |
| 7673 | -1400000.0 | 106000.0 | 1000.0 | -26.032814 | 0.268741 | 1.696963 | -24.335851 | -19.966292 | 3 | -20.010773 | -20.010773 |
| 7674 | -1400000.0 | 108000.0 | 1000.0 | -26.121903 | 0.201716 | -1.319170 | -27.441073 | -21.510609 | 3 | -21.483911 | -21.483911 |
| 7675 | -1400000.0 | 110000.0 | 1000.0 | -26.206160 | 0.134418 | -4.347560 | -30.553720 | -34.929273 | 3 | -22.365574 | -22.365574 |
7676 rows × 11 columns
[20]:
grav_grid = grav_df.set_index(["northing", "easting"]).to_xarray()
# plot the synthetic gravity anomaly grid
lims = polar_utils.get_min_max(grav_grid.gravity_anomaly_full_res_no_noise)
fig = maps.plot_grd(
grav_grid.gravity_anomaly_full_res_no_noise,
fig_height=10,
cmap="viridis",
cpt_lims=lims,
title="Full resolution no noise gravity",
cbar_label="mGal",
frame=["nSWe", "xaf10000", "yaf10000"],
hist=True,
)
# plot observation points
fig.plot(
grav_survey_df[["easting", "northing"]],
style="c.02c",
fill="black",
)
fig.text(
position="TL",
justify="BL",
text="a)",
font="16p,Helvetica,black",
offset="j-.3/.3",
no_clip=True,
)
dif = grav_grid.gravity_anomaly_full_res_no_noise - grav_grid.gravity_anomaly
fig = maps.plot_grd(
dif,
fig_height=10,
cmap="balance+h0",
robust=True,
title=f"RMSE: {round(utils.rmse(dif), 2)} mGal",
cbar_label="mGal",
hist=True,
fig=fig,
origin_shift="xshift",
xshift_amount=1.1,
)
fig.text(
position="TL",
justify="BL",
text="b)",
font="16p,Helvetica,black",
offset="j-.3/.3",
no_clip=True,
)
# plot the synthetic observed gravity grid
fig = maps.plot_grd(
grav_grid.gravity_anomaly,
fig_height=10,
cmap="viridis",
cpt_lims=lims,
title="Noisey data, sampled and gridded",
cbar_label="mGal",
frame=["nSwe", "xaf10000", "yaf10000"],
hist=True,
fig=fig,
origin_shift="xshift",
xshift_amount=1.1,
)
fig.text(
position="TL",
justify="BL",
text="c)",
font="16p,Helvetica,black",
offset="j-.3/.3",
no_clip=True,
)
fig.show()

Make starting bathymetry model
[21]:
# semi-regularly spaced
constraint_points = synthetic.constraint_layout_number(
shape=(6, 7),
region=inversion_region,
padding=-spacing,
shapefile="../results/Ross_Sea/Ross_Sea_outline.shp",
add_outside_points=True,
grid_spacing=spacing,
)
# sample true topography at these points
constraint_points = utils.sample_grids(
constraint_points,
bathymetry,
"true_upward",
coord_names=("easting", "northing"),
)
constraint_points["upward"] = constraint_points.true_upward
constraint_points.describe()
[21]:
| northing | easting | true_upward | upward | |
|---|---|---|---|---|
| count | 8.860000e+02 | 886.000000 | 886.000000 | 886.000000 |
| mean | -1.500000e+06 | 35000.000000 | -554.618624 | -554.618624 |
| std | 7.943367e+04 | 62379.505946 | 110.436078 | 110.436078 |
| min | -1.600000e+06 | -40000.000000 | -834.579102 | -834.579102 |
| 25% | -1.589500e+06 | -36000.000000 | -652.470108 | -652.470108 |
| 50% | -1.500000e+06 | 35000.000000 | -549.707733 | -549.707733 |
| 75% | -1.410500e+06 | 106000.000000 | -453.898399 | -453.898399 |
| max | -1.400000e+06 | 110000.000000 | -278.443117 | -278.443117 |
[22]:
# grid the sampled values using verde
starting_topography_kwargs = dict(
method="splines",
region=buffer_region,
spacing=spacing,
constraints_df=constraint_points,
dampings=None,
)
starting_bathymetry = utils.create_topography(**starting_topography_kwargs)
starting_bathymetry
[22]:
<xarray.DataArray 'scalars' (northing: 121, easting: 96)> Size: 93kB
array([[-541.24413869, -544.57181187, -547.92293689, ..., -360.00006254,
-357.06767408, -354.19957766],
[-543.34402688, -546.81675803, -550.35256333, ..., -362.90253226,
-359.96874158, -357.11431886],
[-545.05533622, -548.66036838, -552.37518163, ..., -365.66137905,
-362.73269531, -359.90052824],
...,
[-591.95335283, -595.518822 , -599.06869705, ..., -440.89315875,
-440.6944619 , -440.40553782],
[-590.53134833, -594.09076637, -597.64079288, ..., -440.69158328,
-440.42525249, -440.07197234],
[-589.16632671, -592.73504777, -596.30209679, ..., -440.51760947,
-440.1713932 , -439.74434037]], shape=(121, 96))
Coordinates:
* northing (northing) float64 968B -1.62e+06 -1.618e+06 ... -1.38e+06
* easting (easting) float64 768B -6e+04 -5.8e+04 ... 1.28e+05 1.3e+05
Attributes:
metadata: Generated by SplineCV(cv=KFold(n_splits=5, random_state=0, shu...
damping: None[23]:
# sample the inverted topography at the constraint points
constraint_points = utils.sample_grids(
constraint_points,
starting_bathymetry,
"starting_bathymetry",
coord_names=("easting", "northing"),
)
rmse = utils.rmse(constraint_points.true_upward - constraint_points.starting_bathymetry)
print(f"RMSE: {rmse:.2f} m")
RMSE: 0.03 m
[24]:
# compare starting and actual bathymetry grids
grids = polar_utils.grd_compare(
bathymetry,
starting_bathymetry,
fig_height=10,
plot=True,
cmap="rain",
reverse_cpt=True,
diff_cmap="balance+h0",
grid1_name="True bathymetry",
grid2_name="Starting bathymetry",
title="Difference",
title_font="18p,Helvetica-Bold,black",
cbar_unit="m",
cbar_label="elevation",
RMSE_decimals=0,
region=inversion_region,
inset=False,
hist=True,
label_font="16p,Helvetica,black",
points=constraint_points[constraint_points.inside],
points_style="x.2c",
)

[25]:
# the true density contrast is 1476 kg/m3
density_contrast = 1350
# set the reference level from the prisms to 0
zref = 0
density_grid = xr.where(
starting_bathymetry >= zref,
density_contrast,
-density_contrast,
)
# create layer of prisms
starting_prisms = utils.grids_to_prisms(
starting_bathymetry,
zref,
density=density_grid,
)
grav_df["starting_gravity"] = starting_prisms.prism_layer.gravity(
coordinates=(
grav_df.easting,
grav_df.northing,
grav_df.upward,
),
field="g_z",
progressbar=True,
)
grav_df
[25]:
| northing | easting | upward | bathymetry_grav | basement_grav_normalized | basement_grav | gravity_anomaly_full_res_no_noise | gravity_anomaly_full_res | uncert | eqs_gravity_anomaly | gravity_anomaly | starting_gravity | |
|---|---|---|---|---|---|---|---|---|---|---|---|---|
| 0 | -1600000.0 | -40000.0 | 1000.0 | -35.551085 | -0.575645 | -36.300394 | -71.851479 | -72.911198 | 3 | -64.481389 | -64.481389 | -32.541367 |
| 1 | -1600000.0 | -38000.0 | 1000.0 | -36.054683 | -0.523223 | -33.941405 | -69.996088 | -72.483909 | 3 | -64.163085 | -64.163085 | -32.965831 |
| 2 | -1600000.0 | -36000.0 | 1000.0 | -36.473168 | -0.466365 | -31.382798 | -67.855967 | -68.870245 | 3 | -63.178870 | -63.178870 | -33.347648 |
| 3 | -1600000.0 | -34000.0 | 1000.0 | -36.755627 | -0.406022 | -28.667352 | -65.422980 | -61.536475 | 3 | -61.636021 | -61.636021 | -33.644496 |
| 4 | -1600000.0 | -32000.0 | 1000.0 | -36.951045 | -0.343163 | -25.838709 | -62.789754 | -65.528788 | 3 | -59.623519 | -59.623519 | -33.840063 |
| ... | ... | ... | ... | ... | ... | ... | ... | ... | ... | ... | ... | ... |
| 7671 | -1400000.0 | 102000.0 | 1000.0 | -25.760090 | 0.399167 | 7.566127 | -18.193963 | -19.271274 | 3 | -15.904465 | -15.904465 | -23.321506 |
| 7672 | -1400000.0 | 104000.0 | 1000.0 | -25.911429 | 0.334798 | 4.669511 | -21.241918 | -24.226858 | 3 | -18.079420 | -18.079420 | -23.482116 |
| 7673 | -1400000.0 | 106000.0 | 1000.0 | -26.032814 | 0.268741 | 1.696963 | -24.335851 | -19.966292 | 3 | -20.010773 | -20.010773 | -23.605602 |
| 7674 | -1400000.0 | 108000.0 | 1000.0 | -26.121903 | 0.201716 | -1.319170 | -27.441073 | -21.510609 | 3 | -21.483911 | -21.483911 | -23.693171 |
| 7675 | -1400000.0 | 110000.0 | 1000.0 | -26.206160 | 0.134418 | -4.347560 | -30.553720 | -34.929273 | 3 | -22.365574 | -22.365574 | -23.763780 |
7676 rows × 12 columns
Regional misfit
[26]:
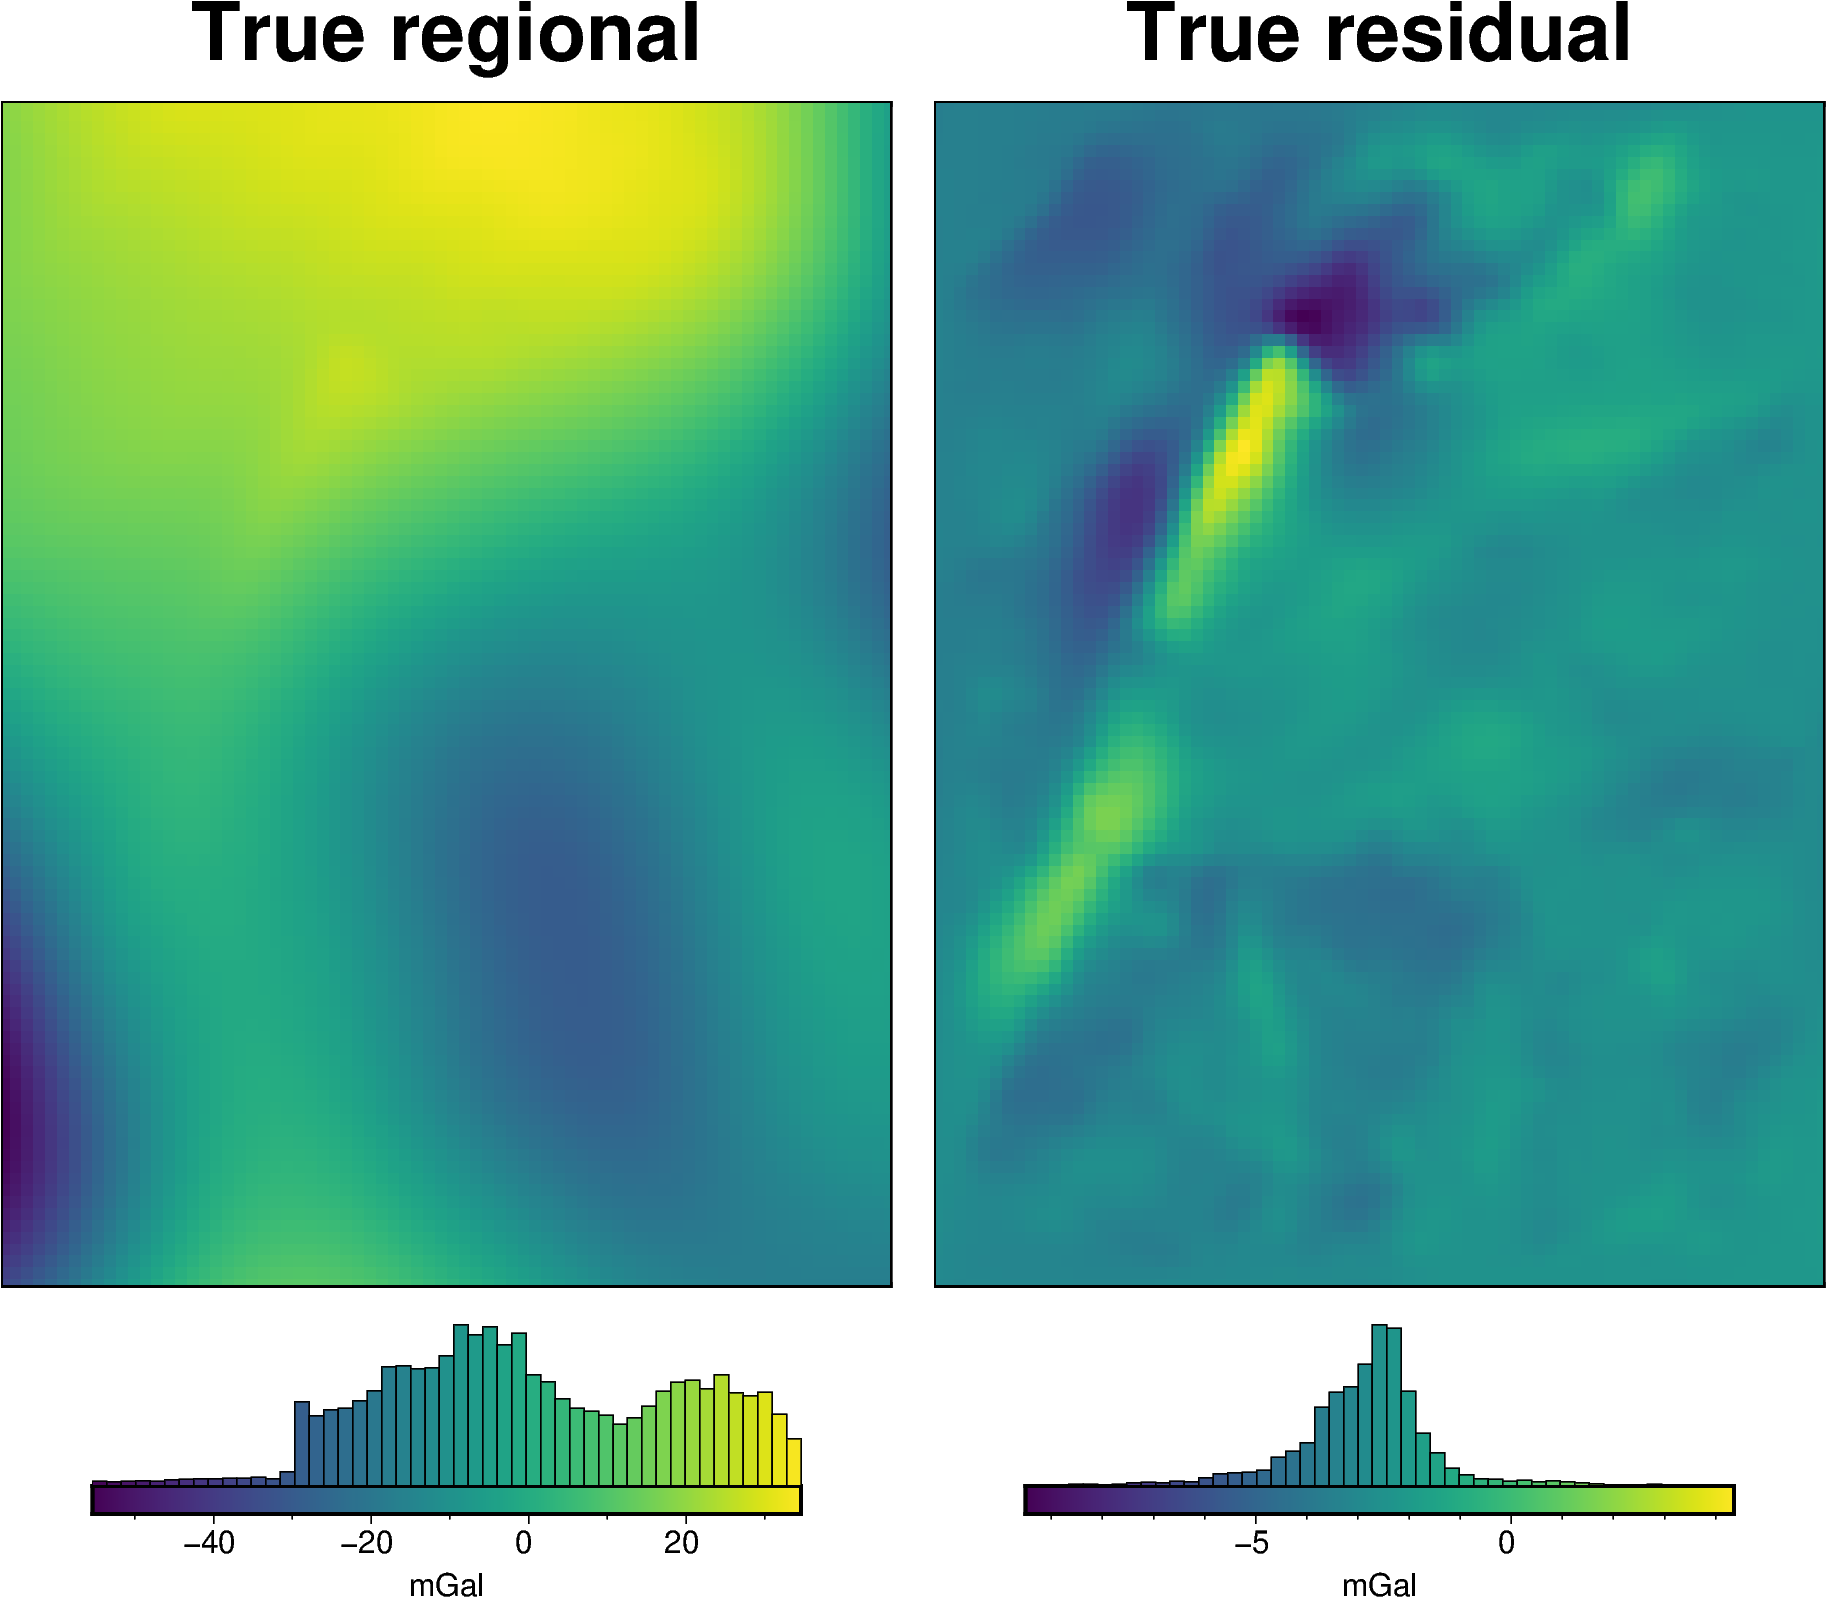
# calculate the true residual misfit
grav_df["true_res"] = grav_df.bathymetry_grav - grav_df.starting_gravity
# grid the results
grav_grid = grav_df.set_index(["northing", "easting"]).to_xarray()
fig = maps.plot_grd(
grav_grid.basement_grav,
fig_height=10,
title="True regional",
hist=True,
cbar_label="mGal",
)
fig = maps.plot_grd(
grav_grid.true_res,
fig=fig,
origin_shift="xshift",
fig_height=10,
title="True residual",
hist=True,
cbar_label="mGal",
)
fig.show()
[27]:
def regional_comparison(df):
# grid the results
grav_grid = df.set_index(["northing", "easting"]).to_xarray()
# calculate the true residual and regional misfit
grav_grid["true_res"] = grav_grid.bathymetry_grav - grav_grid.starting_gravity
grav_grid["true_reg"] = grav_grid.basement_grav
# compare with true regional
_ = polar_utils.grd_compare(
grav_grid.true_reg,
grav_grid.reg,
plot=True,
grid1_name="True regional misfit",
grid2_name="Regional misfit",
hist=True,
inset=False,
verbose="q",
title="difference",
grounding_line=False,
points=constraint_points,
points_style="x.3c",
)
# compare with true residual
_ = polar_utils.grd_compare(
grav_grid.true_res,
grav_grid.res,
plot=True,
grid1_name="True residual misfit",
grid2_name="Residual misfit",
cmap="balance+h0",
hist=True,
inset=False,
verbose="q",
title="difference",
grounding_line=False,
points=constraint_points,
points_style="x.3c",
)
[28]:
# estimate regional with the constraints
regional_grav_kwargs = dict(
method="constraints",
grid_method="eq_sources",
constraints_df=constraint_points,
cv=True,
cv_kwargs=dict(
n_trials=20,
depth_limits=(100, 600e3),
progressbar=False,
fname="../tmp_outputs/Ross_Sea_05_regional_sep",
),
block_size=None,
damping=None,
)
[29]:
temp_reg_kwargs = copy.deepcopy(regional_grav_kwargs)
# temporarily set some kwargs
temp_reg_kwargs["cv_kwargs"]["plot"] = True
temp_reg_kwargs["cv_kwargs"]["progressbar"] = True
grav_df = regional.regional_separation(
grav_df=grav_df,
**temp_reg_kwargs,
)
regional_comparison(grav_df)
grav_df.describe()
[29]:
| northing | easting | upward | bathymetry_grav | basement_grav_normalized | basement_grav | gravity_anomaly_full_res_no_noise | gravity_anomaly_full_res | uncert | eqs_gravity_anomaly | gravity_anomaly | starting_gravity | true_res | misfit | reg | res | |
|---|---|---|---|---|---|---|---|---|---|---|---|---|---|---|---|---|
| count | 7.676000e+03 | 7676.000000 | 7676.0 | 7676.000000 | 7676.000000 | 7.676000e+03 | 7676.000000 | 7676.000000 | 7676.0 | 7676.000000 | 7676.000000 | 7676.000000 | 7676.000000 | 7676.000000 | 7676.000000 | 7676.000000 |
| mean | -1.500000e+06 | 35000.000000 | 1000.0 | -31.727282 | 0.231031 | -2.843652e-15 | -31.727282 | -31.727282 | 3.0 | -31.710141 | -31.710141 | -28.869499 | -2.857784 | -2.840642 | -2.747836 | -0.092806 |
| std | 5.831332e+04 | 43877.680138 | 0.0 | 6.458148 | 0.408910 | 1.840096e+01 | 18.705632 | 18.941873 | 0.0 | 18.538801 | 18.538801 | 5.735684 | 1.373353 | 18.070392 | 18.040025 | 1.573070 |
| min | -1.600000e+06 | -40000.000000 | 1000.0 | -48.457772 | -1.000000 | -5.539638e+01 | -86.255525 | -90.659649 | 3.0 | -83.807774 | -83.807774 | -44.455618 | -9.507972 | -55.631766 | -55.108329 | -7.263583 |
| 25% | -1.550000e+06 | -2500.000000 | 1000.0 | -36.286367 | -0.073818 | -1.371818e+01 | -44.456648 | -44.652752 | 3.0 | -44.320756 | -44.320756 | -32.676771 | -3.516046 | -16.534486 | -16.400708 | -0.765620 |
| 50% | -1.500000e+06 | 35000.000000 | 1000.0 | -31.030070 | 0.181838 | -2.213682e+00 | -34.787749 | -33.948753 | 3.0 | -34.918420 | -34.918420 | -28.426806 | -2.725032 | -5.028531 | -5.171792 | -0.067877 |
| 75% | -1.450000e+06 | 72500.000000 | 1000.0 | -27.278975 | 0.596585 | 1.644995e+01 | -18.710934 | -18.463265 | 3.0 | -18.422208 | -18.422208 | -24.769776 | -2.210131 | 13.337093 | 13.745929 | 0.604605 |
| max | -1.400000e+06 | 110000.000000 | 1000.0 | -16.585798 | 1.000000 | 3.460362e+01 | 9.233507 | 15.492939 | 3.0 | 6.517515 | 6.517515 | -15.540467 | 4.358587 | 32.748146 | 30.971944 | 6.507292 |
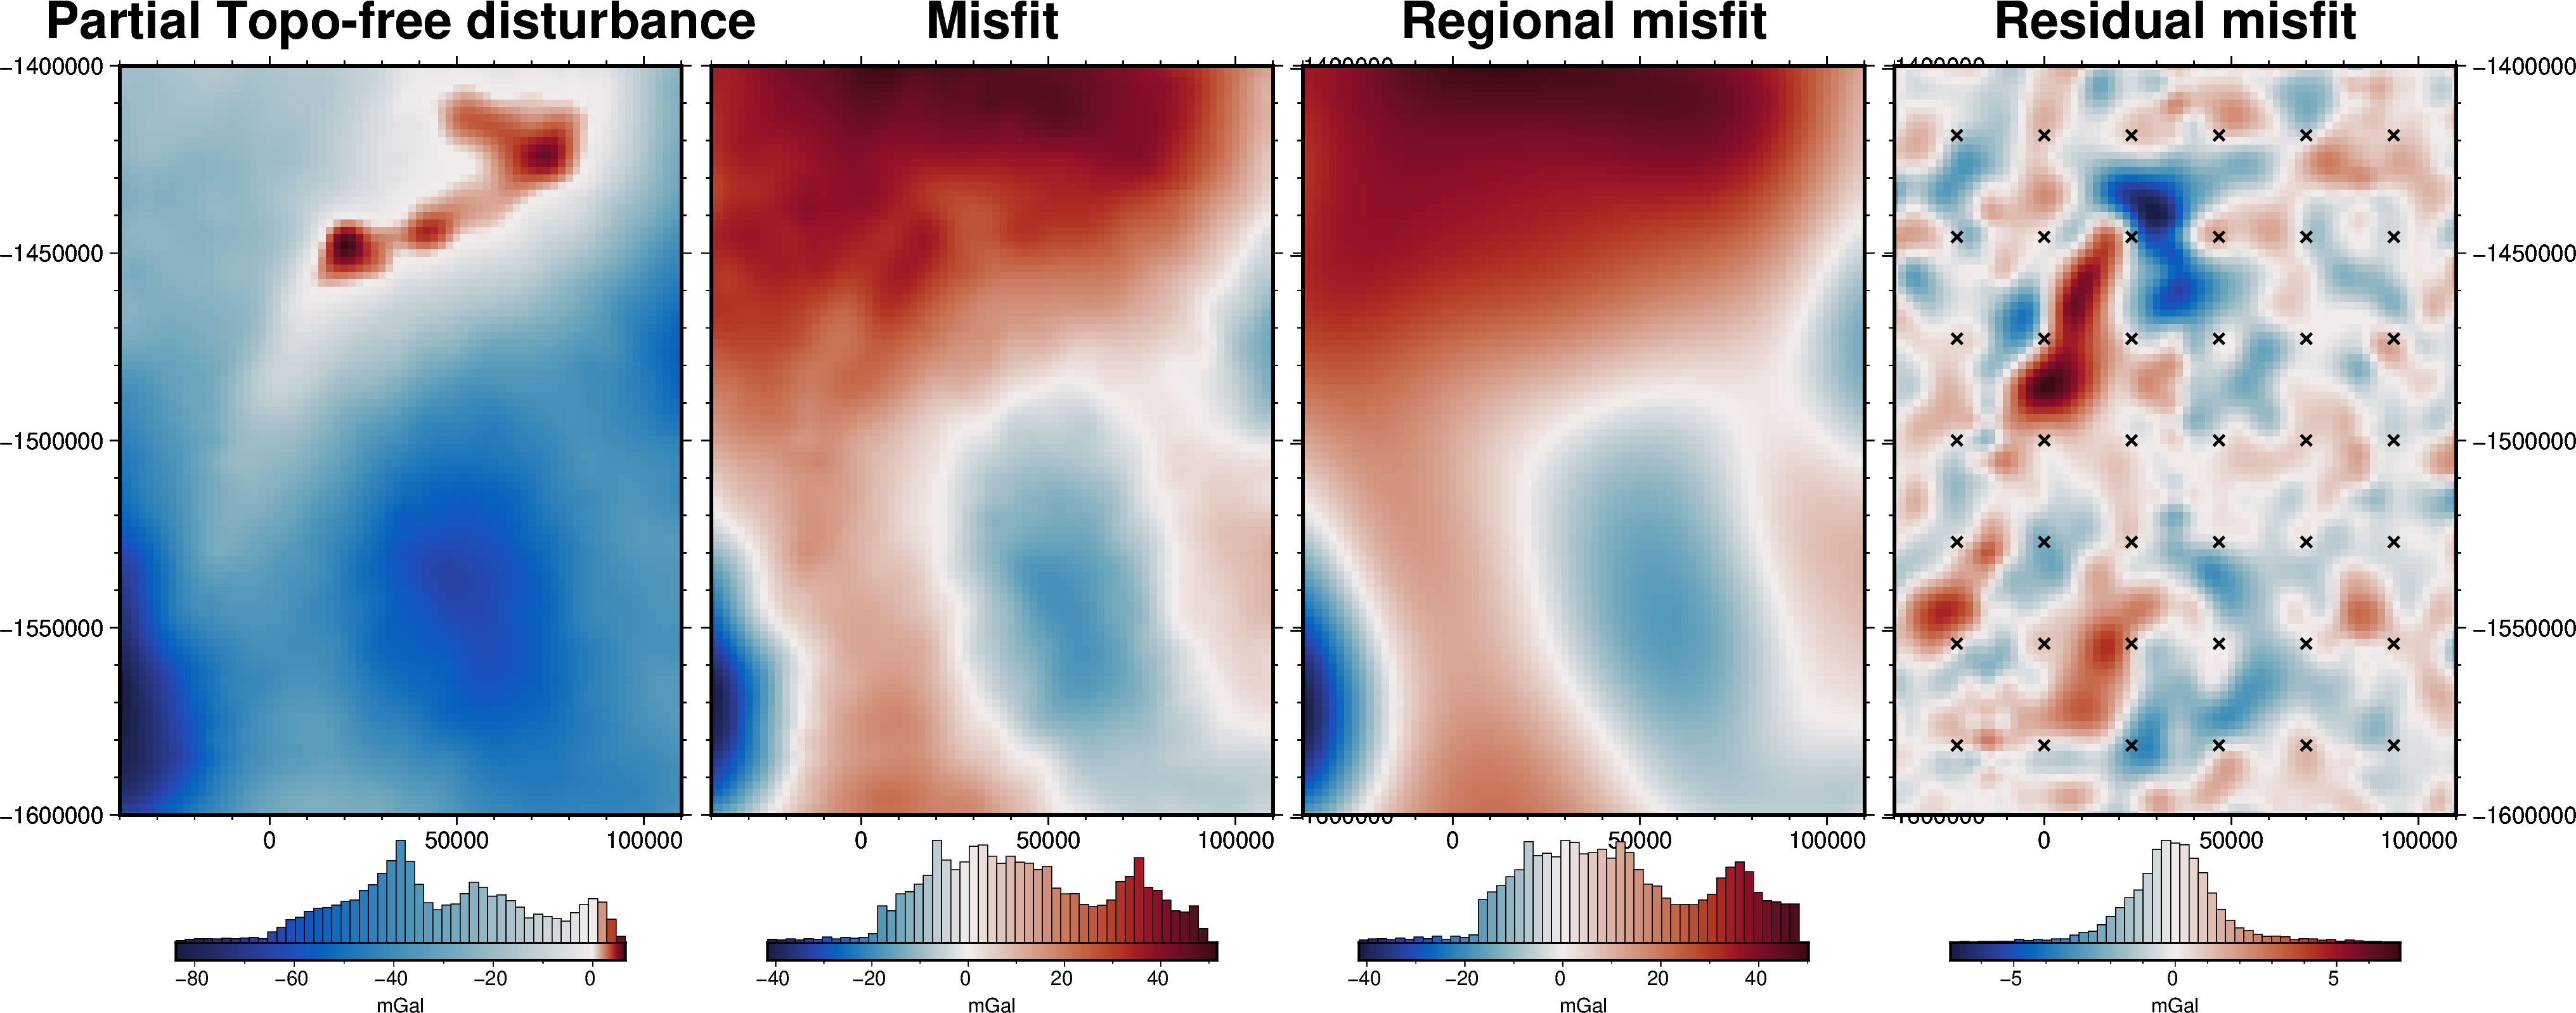
[30]:
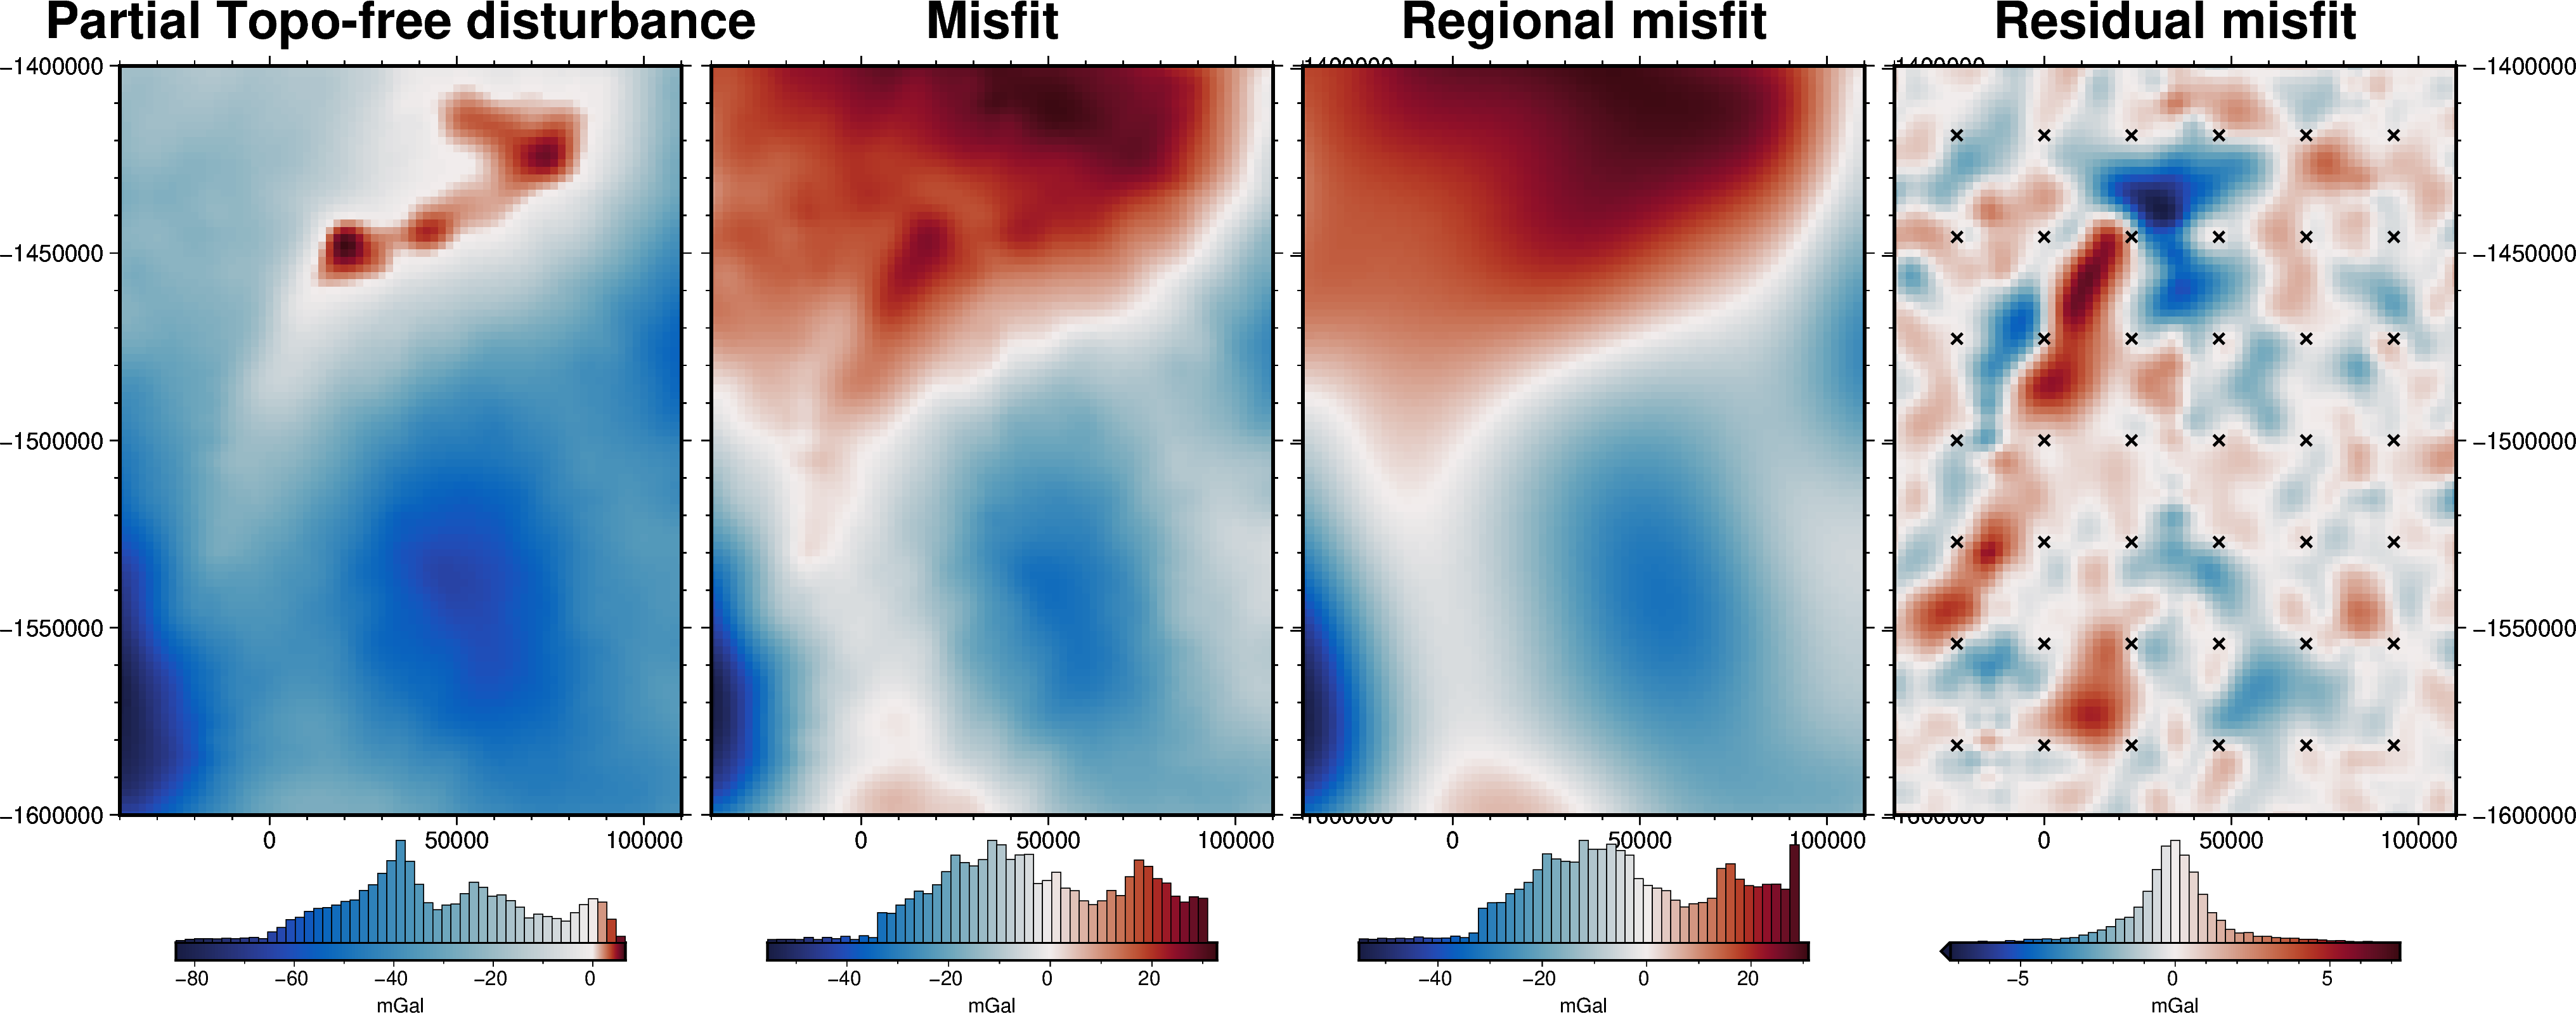
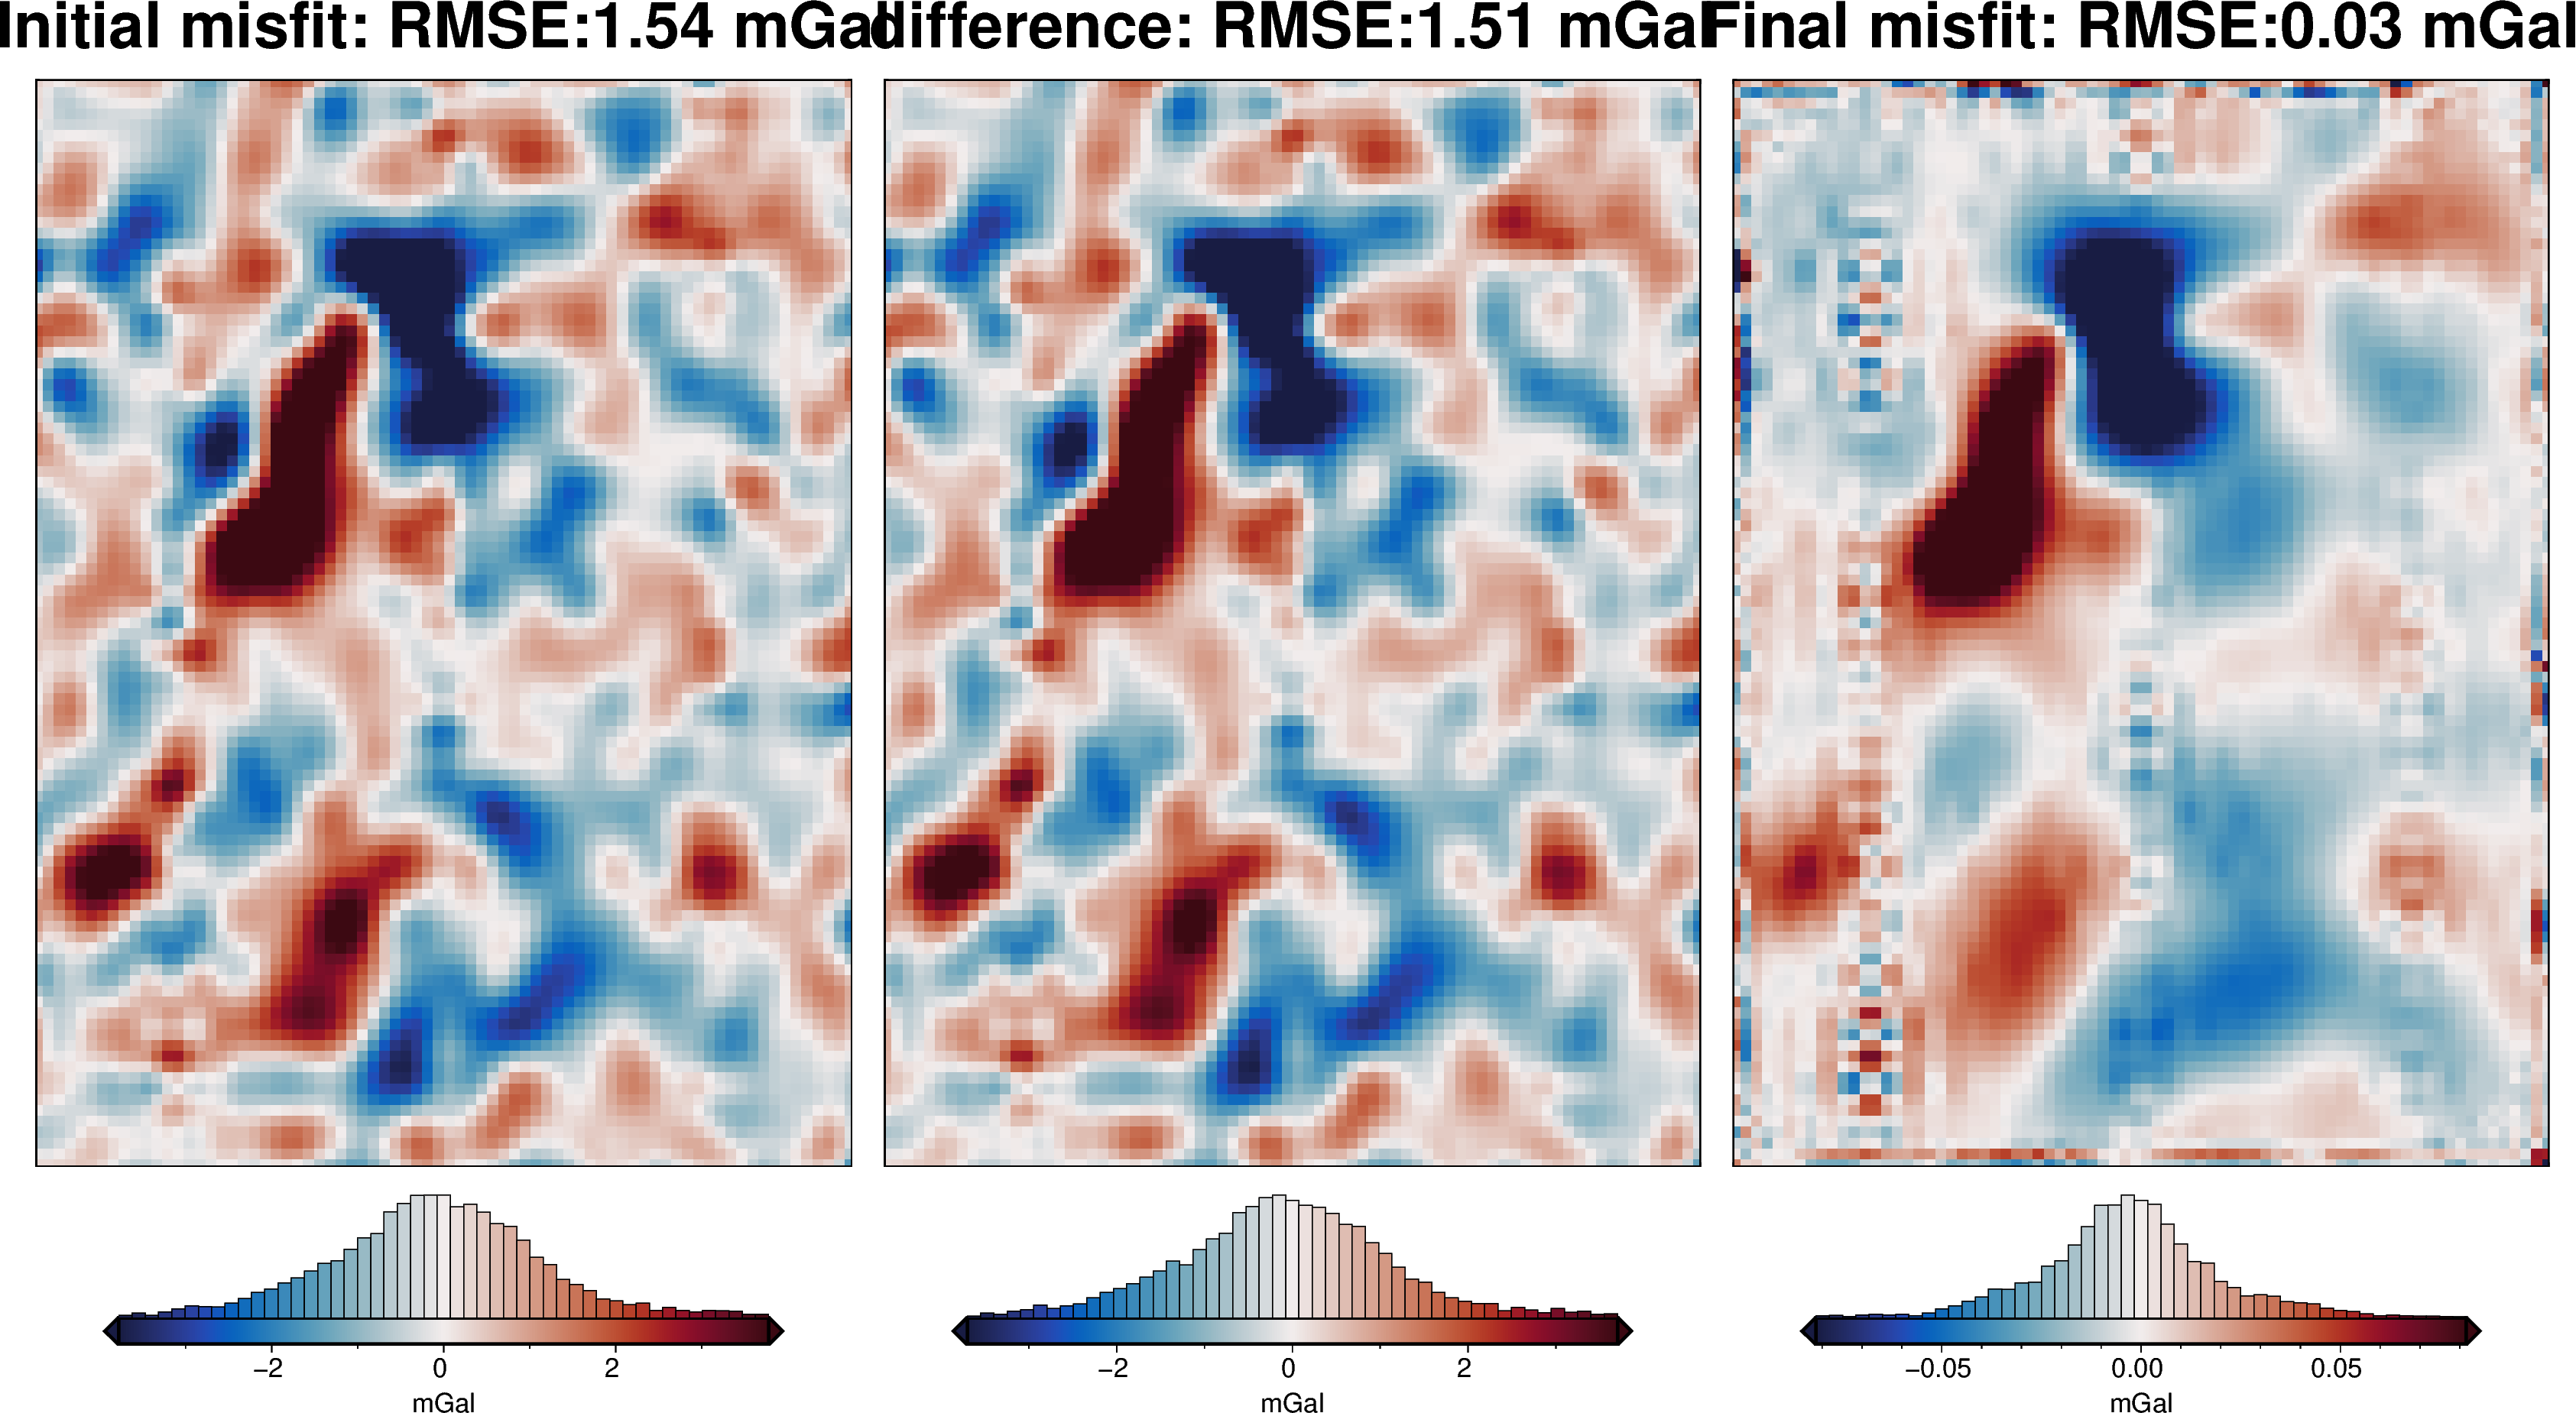
grav_grid = grav_df.set_index(["northing", "easting"]).to_xarray()
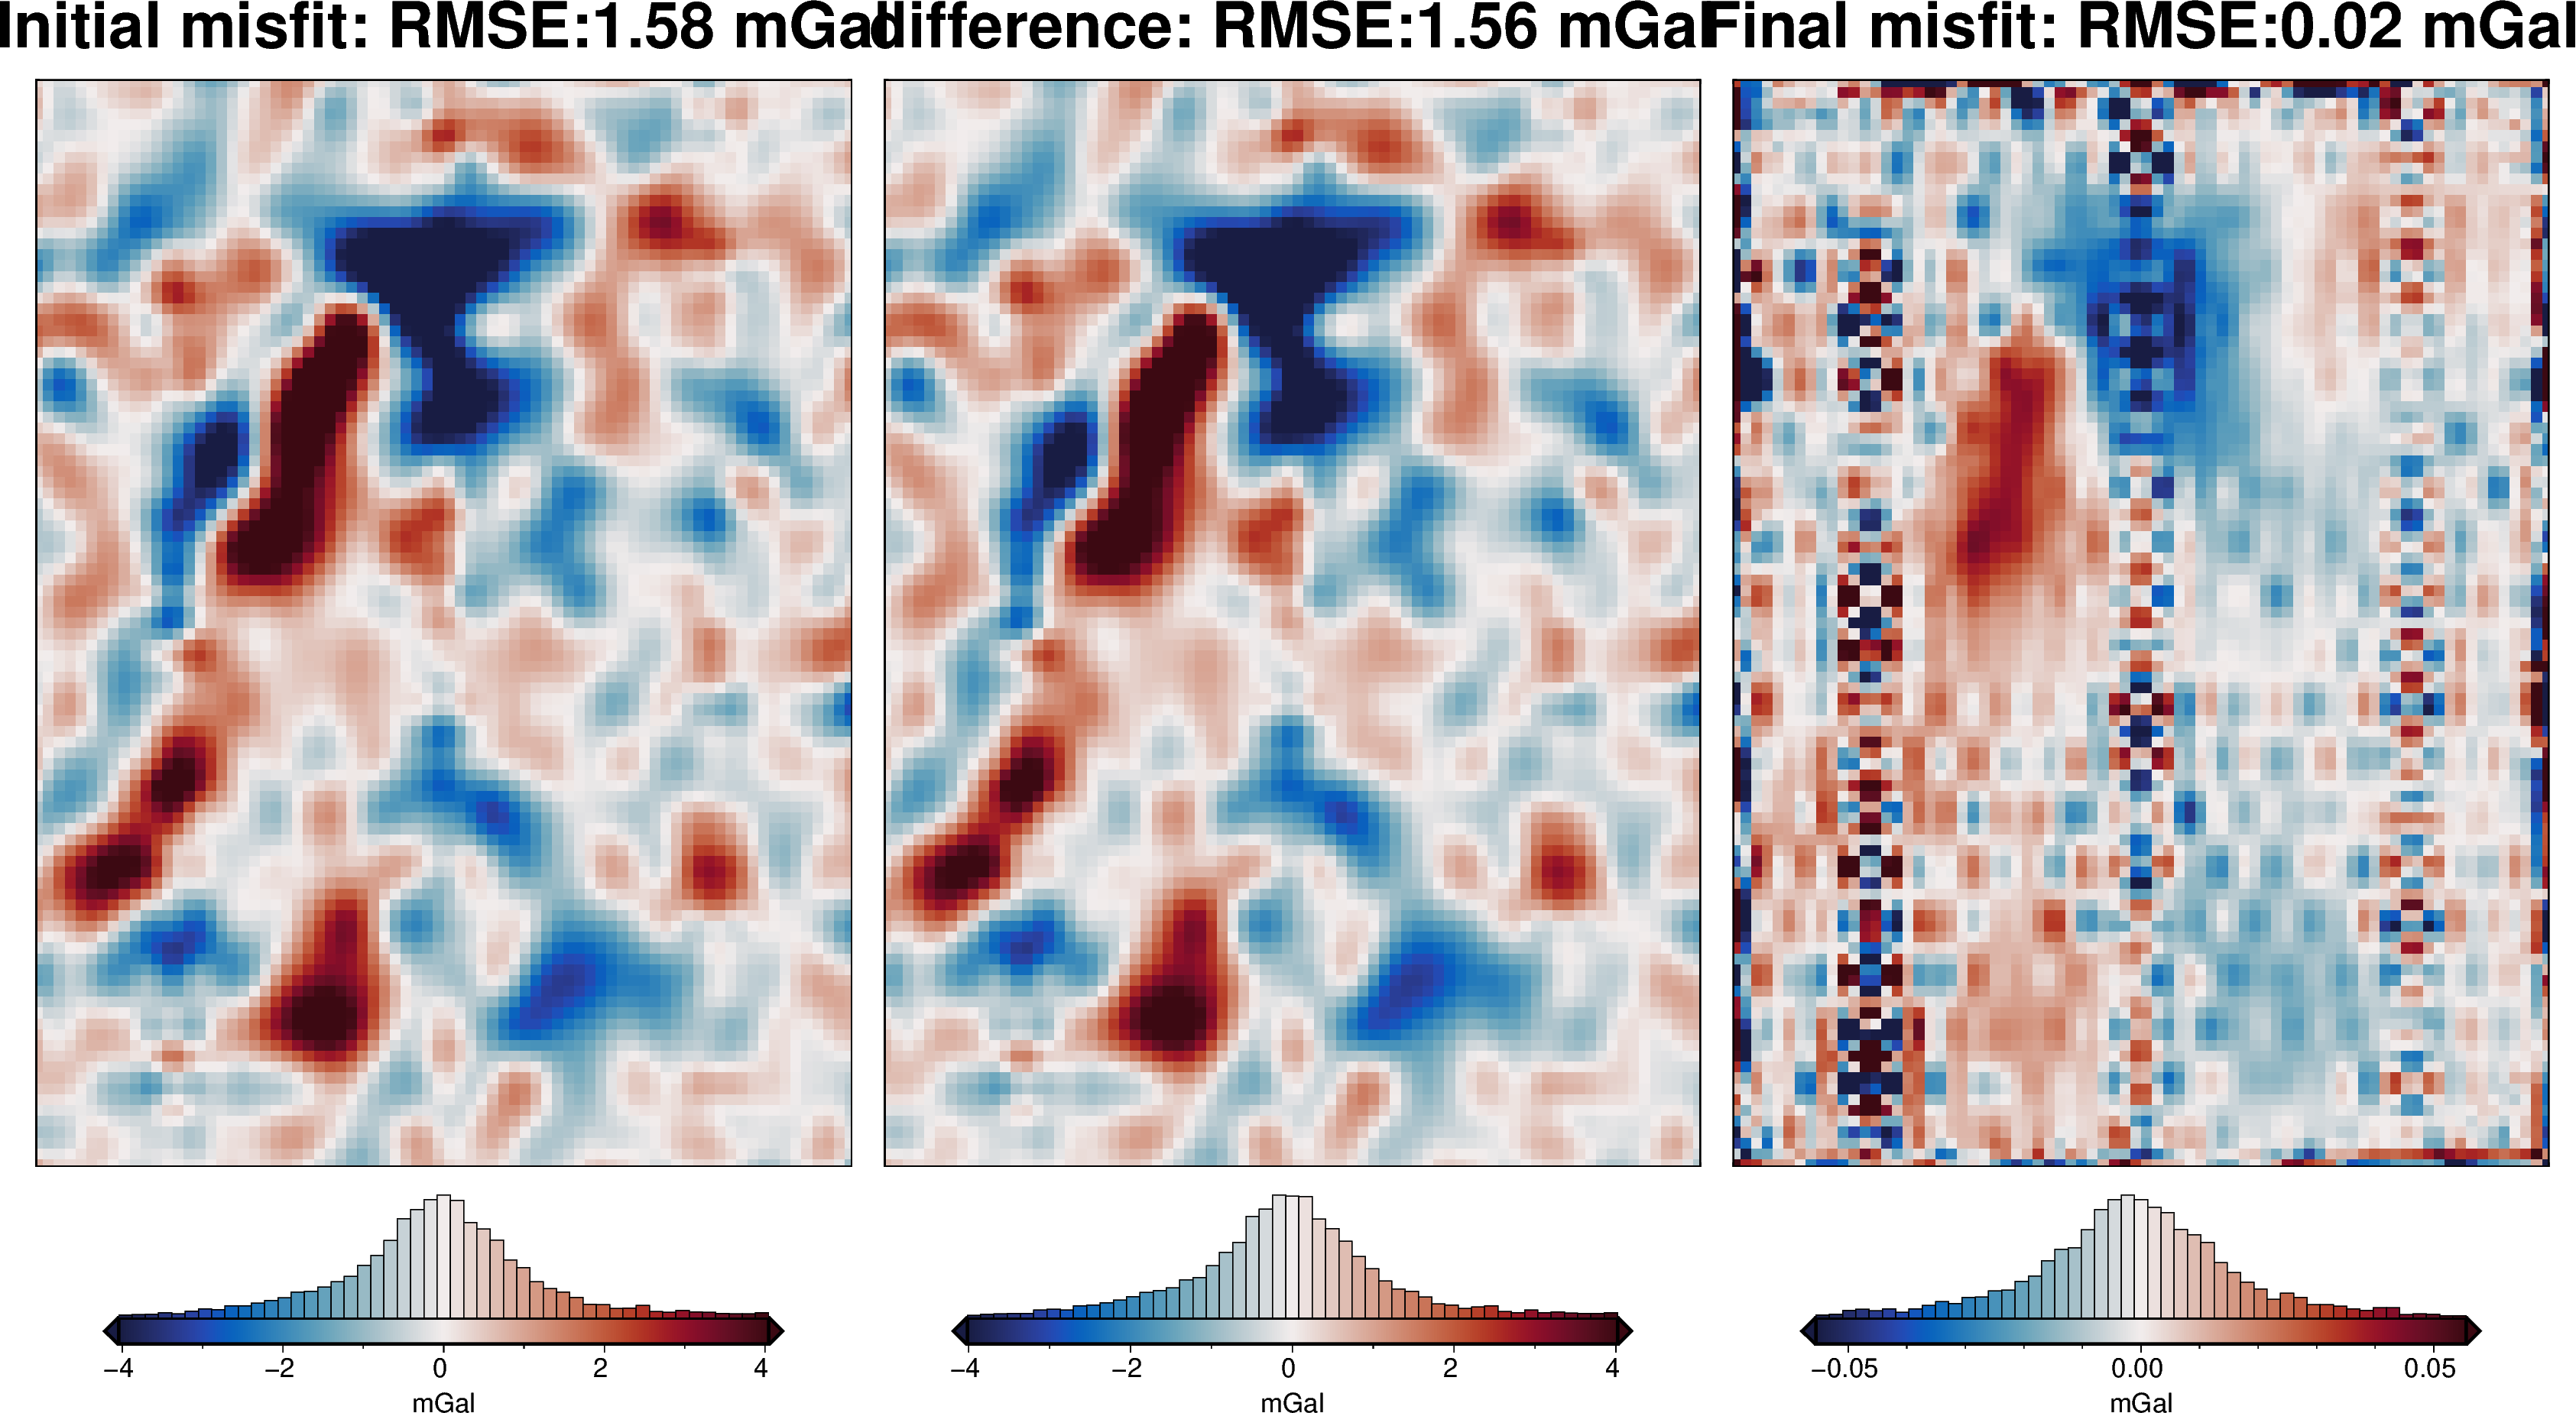
fig = maps.plot_grd(
grav_grid.gravity_anomaly,
region=inversion_region,
fig_height=10,
title="Partial Topo-free disturbance",
cmap="balance+h0",
hist=True,
cbar_label="mGal",
frame=["nSWe", "xaf10000", "yaf10000"],
)
fig = maps.plot_grd(
grav_grid.misfit,
region=inversion_region,
fig=fig,
origin_shift="xshift",
fig_height=10,
title="Misfit",
cmap="balance+h0",
hist=True,
cbar_label="mGal",
frame=["nSwE", "xaf10000", "yaf10000"],
)
fig = maps.plot_grd(
grav_grid.reg,
region=inversion_region,
fig=fig,
origin_shift="xshift",
fig_height=10,
title="Regional misfit",
cmap="balance+h0",
hist=True,
cbar_label="mGal",
frame=["nSwE", "xaf10000", "yaf10000"],
)
fig = maps.plot_grd(
grav_grid.res,
region=inversion_region,
fig=fig,
origin_shift="xshift",
fig_height=10,
title="Residual misfit",
cmap="balance+h0",
cpt_lims=[-vd.maxabs(grav_grid.res), vd.maxabs(grav_grid.res)],
hist=True,
cbar_label="mGal",
frame=["nSwE", "xaf10000", "yaf10000"],
points=constraint_points[constraint_points.inside],
points_style="x.2c",
)
fig.show()
[31]:
grav_df.uncert.mean()
[31]:
np.float64(3.0)
[32]:
# set kwargs to pass to the inversion
kwargs = {
# set stopping criteria
"max_iterations": 200,
"l2_norm_tolerance": grav_df.uncert.mean() ** 0.5, # square root of the noise
"delta_l2_norm_tolerance": 1.008,
}
Damping Cross Validation
[33]:
logging.getLogger().setLevel(logging.INFO)
# run the inversion workflow, including a cross validation for the damping parameter
results = inversion.run_inversion_workflow(
grav_df=grav_df,
starting_prisms=starting_prisms,
# for creating test/train splits
grav_spacing=spacing,
inversion_region=inversion_region,
run_damping_cv=True,
damping_limits=(0.001, 0.1),
damping_cv_trials=8,
fname=f"{fpath}_damping_cv",
**kwargs,
)
[34]:
# load saved inversion results
with pathlib.Path(f"{fpath}_damping_cv_results.pickle").open("rb") as f:
results = pickle.load(f)
# load study
with pathlib.Path(f"{fpath}_damping_cv_damping_cv_study.pickle").open("rb") as f:
study = pickle.load(f)
# collect the results
topo_results, grav_results, parameters, elapsed_time = results
[35]:
best_damping = parameters.get("Solver damping")
kwargs["solver_damping"] = best_damping
best_damping
[35]:
0.013422413235354692
[36]:
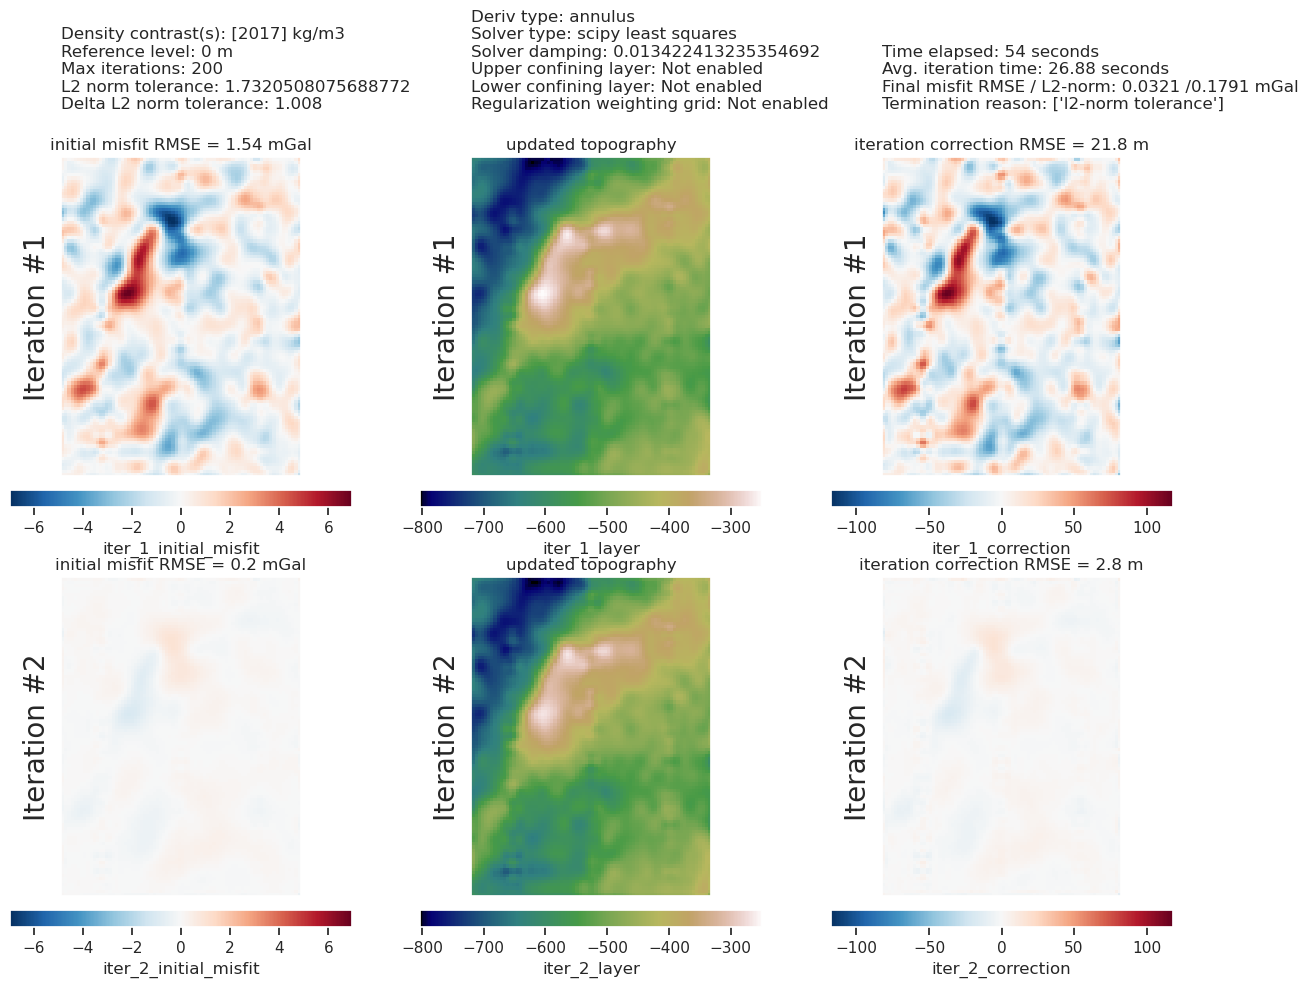
study_df = study.trials_dataframe()
plotting.plot_cv_scores(
study_df.value,
study_df.params_damping,
param_name="Damping",
logx=True,
logy=True,
)
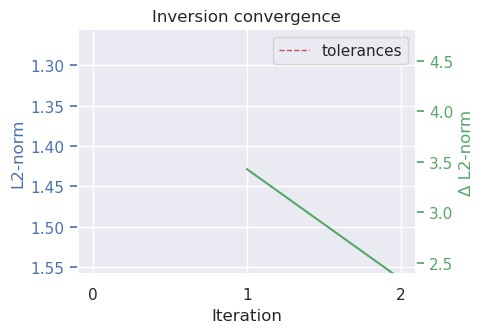
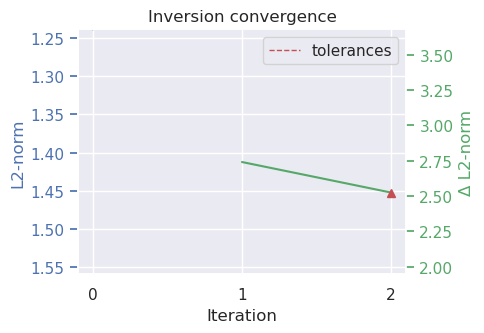
plotting.plot_convergence(
grav_results,
params=parameters,
)
plotting.plot_inversion_results(
grav_results,
topo_results,
parameters,
inversion_region,
iters_to_plot=2,
plot_iter_results=True,
plot_topo_results=True,
plot_grav_results=True,
)
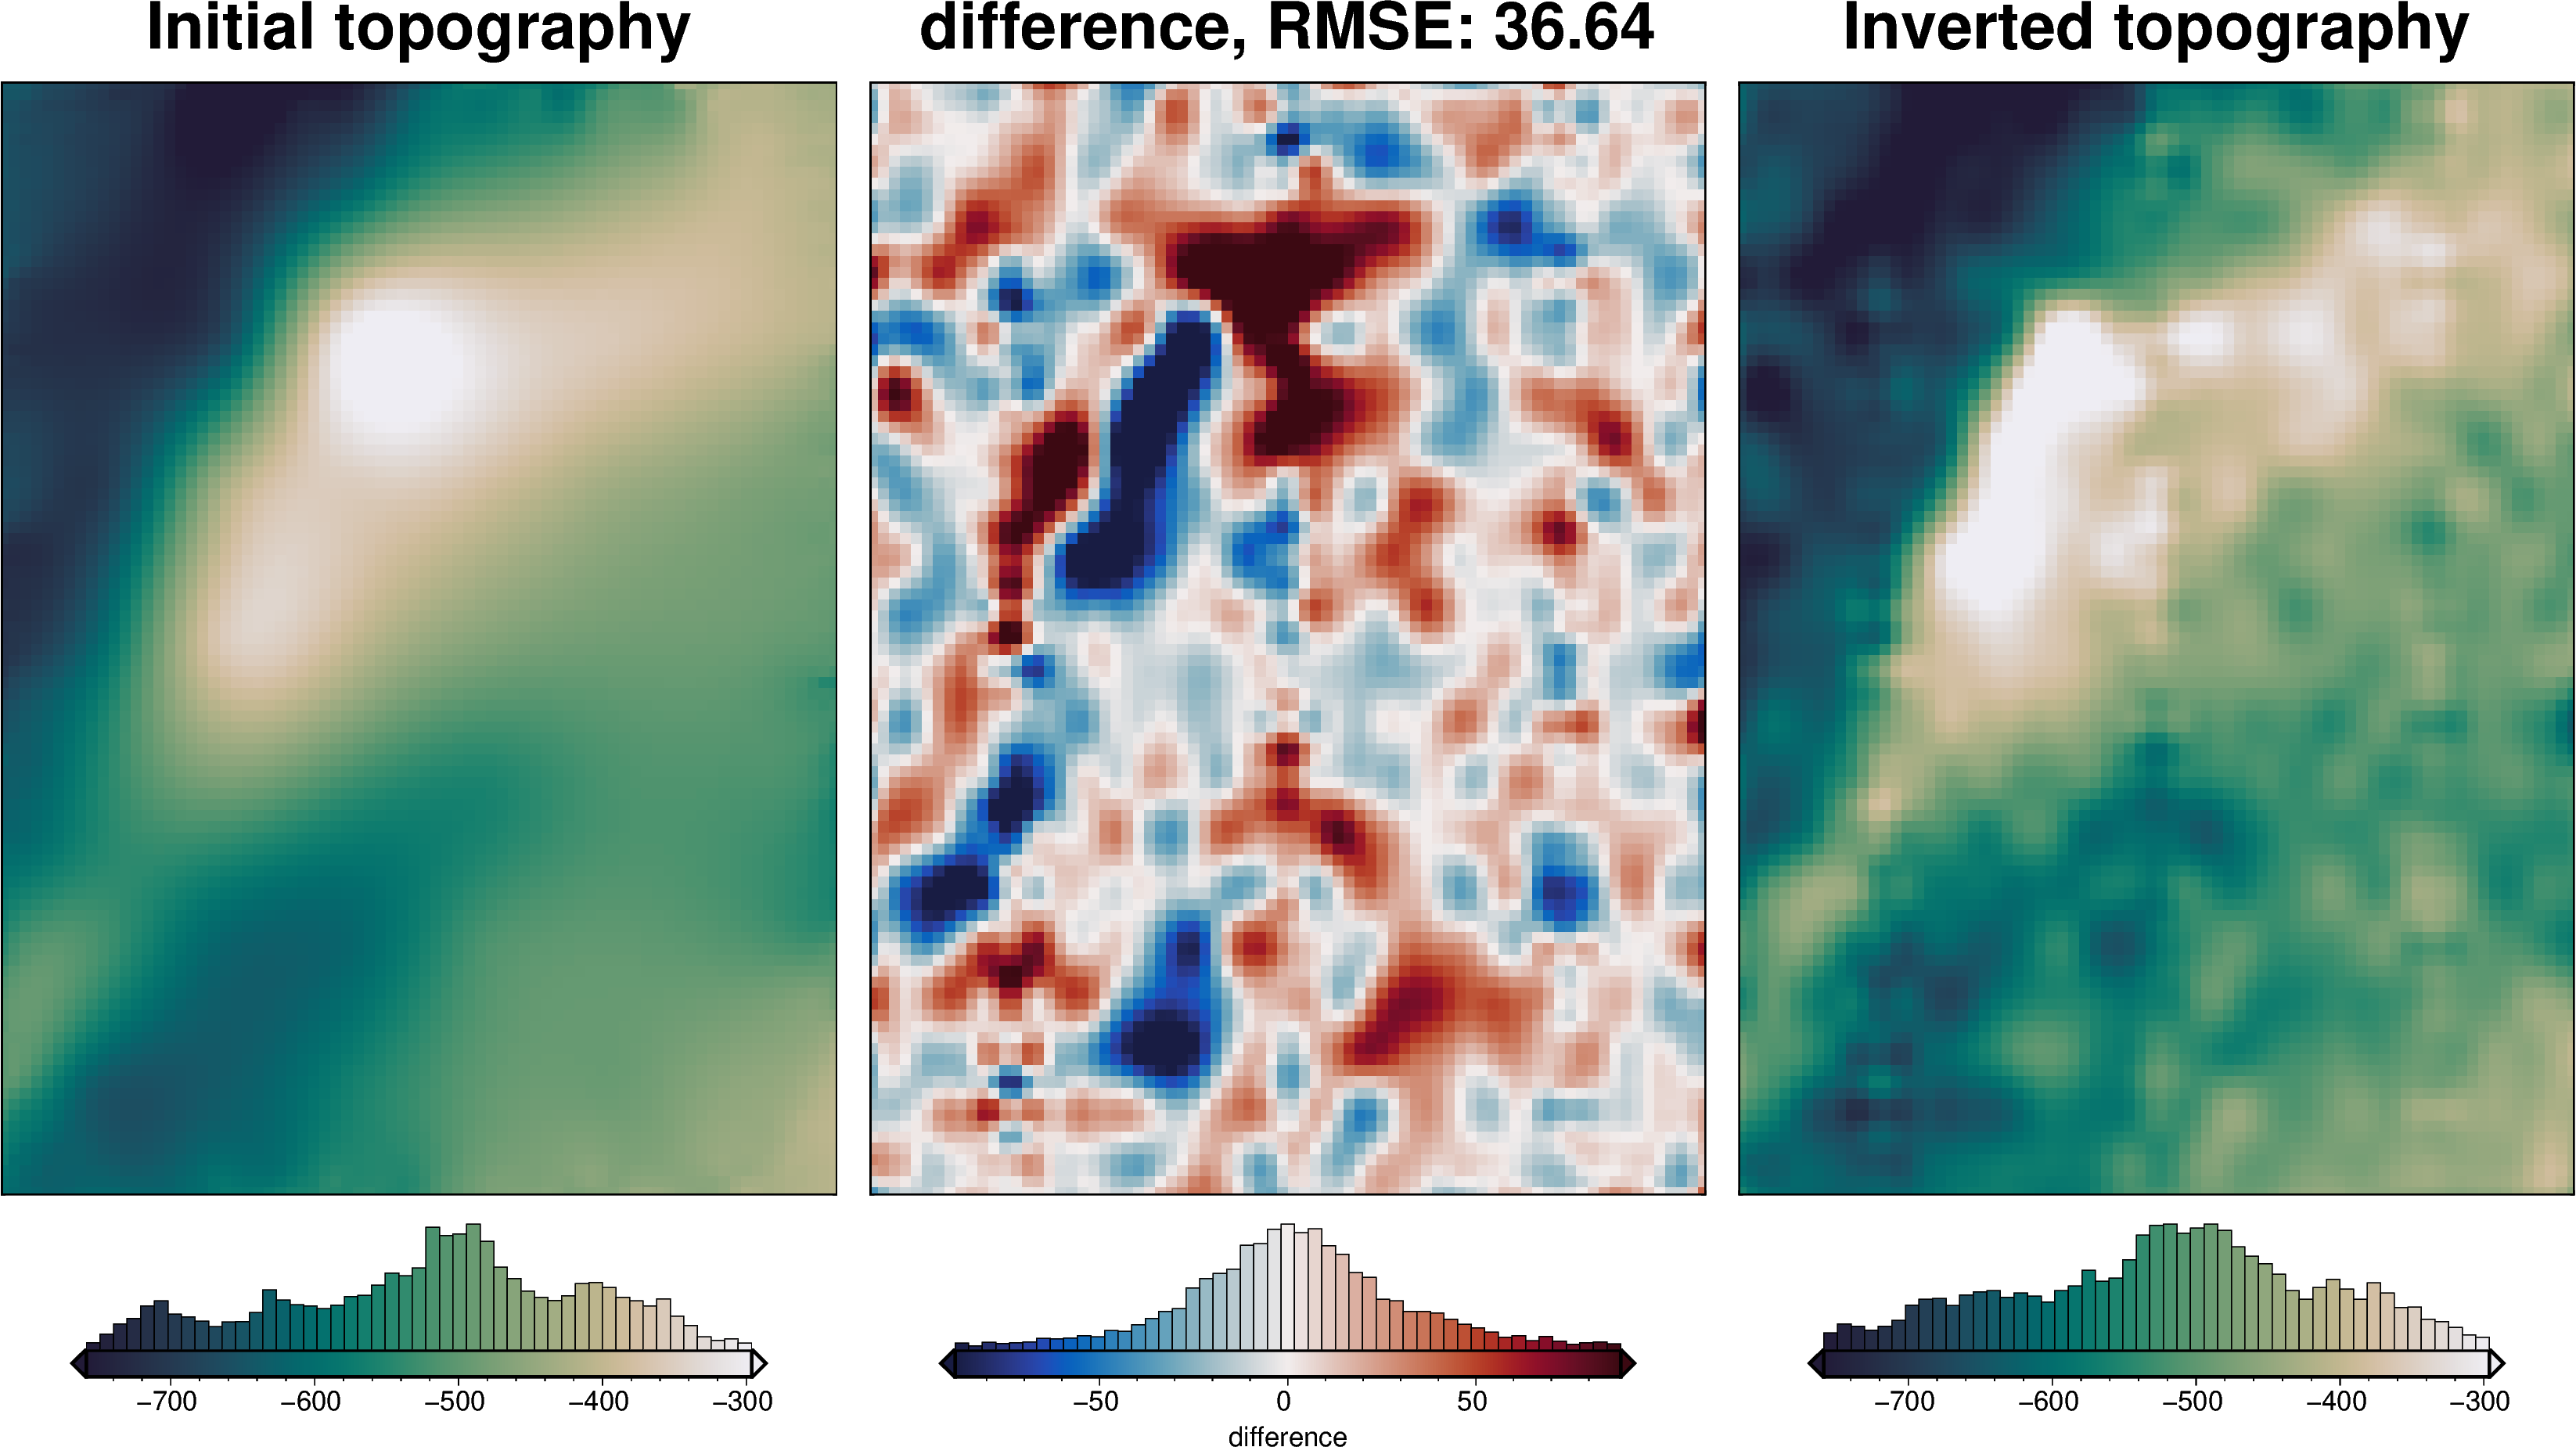
final_topography = topo_results.set_index(["northing", "easting"]).to_xarray().topo
_ = polar_utils.grd_compare(
bathymetry,
final_topography,
region=inversion_region,
plot=True,
grid1_name="True topography",
grid2_name="Inverted topography",
robust=True,
hist=True,
inset=False,
verbose="q",
title="difference",
grounding_line=False,
reverse_cpt=True,
cmap="rain",
points=constraint_points[constraint_points.inside],
points_style="x.2c",
)

[37]:
# sample the inverted topography at the constraint points
constraint_points = utils.sample_grids(
constraint_points,
final_topography,
"inverted_topography",
coord_names=("easting", "northing"),
)
rmse = utils.rmse(constraint_points.true_upward - constraint_points.inverted_topography)
print(f"RMSE: {rmse:.2f} m")
RMSE: 21.34 m
Density CV
[38]:
# run the cross validation for density
study, inversion_results = optimization.optimize_inversion_zref_density_contrast(
grav_df=grav_df,
constraints_df=constraint_points,
density_contrast_limits=(1000, 2400),
zref=0,
n_trials=8,
starting_topography=starting_bathymetry,
regional_grav_kwargs=dict(
method="constant",
constant=0,
),
fname=f"{fpath}_density_cv",
**kwargs,
)
'starting_gravity' already a column of `grav_df`, but is being overwritten since calculate_starting_gravity is True
'reg' already a column of `grav_df`, but is being overwritten since calculate_regional_misfit is True
[39]:
# run a 5-fold cross validation for 10 parameter sets of density
# this performs 50 regional separations and 50 inversions
study, inversion_results = optimization.optimize_inversion_zref_density_contrast_kfolds(
grav_df=grav_df,
constraints_df=constraint_points[constraint_points.inside],
density_contrast_limits=(1000, 2400),
zref=0,
n_trials=12,
split_kwargs=dict(
n_splits=4,
method="KFold",
),
seed=2,
regional_grav_kwargs=regional_grav_kwargs,
starting_topography_kwargs=starting_topography_kwargs,
fname=f"{fpath}_density_cv_kfolds",
fold_progressbar=False,
**kwargs,
)
'starting_gravity' already a column of `grav_df`, but is being overwritten since calculate_starting_gravity is True
'reg' already a column of `grav_df`, but is being overwritten since calculate_regional_misfit is True
[40]:
# load study from normal optimization
with pathlib.Path(f"{fpath}_density_cv_study.pickle").open("rb") as f:
study = pickle.load(f)
optimized_density = study.best_params["density_contrast"]
# load study from kfold optimization
with pathlib.Path(f"{fpath}_density_cv_kfolds_study.pickle").open("rb") as f:
study = pickle.load(f)
kfold_optimized_density = study.best_params["density_contrast"]
print("optimal density contrast from normal optimization: ", optimized_density)
print("optimal density contrast from K-folds optimization: ", kfold_optimized_density)
print("real density contrast", true_density_contrast)
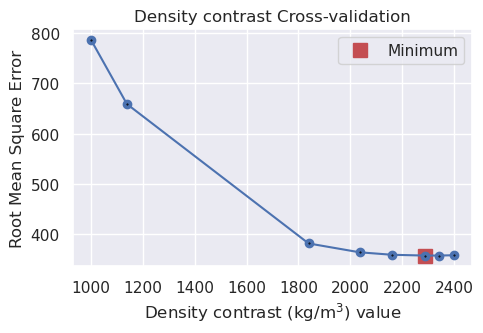
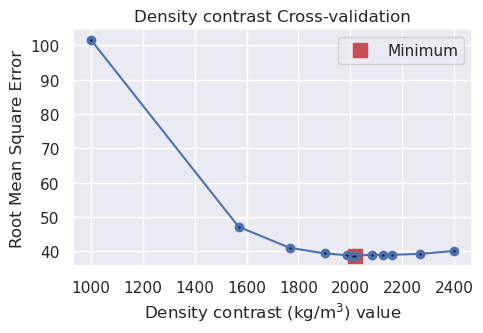
best_density_contrast = min(
[optimized_density, kfold_optimized_density],
key=lambda x: abs(x - true_density_contrast),
)
optimal density contrast from normal optimization: 2290
optimal density contrast from K-folds optimization: 2017
real density contrast 1476
[41]:
print("optimal determined density contrast", best_density_contrast)
print("real density contrast", true_density_contrast)
print("density error", best_density_contrast - true_density_contrast)
optimal determined density contrast 2017
real density contrast 1476
density error 541
Redo with optimal density contrast
During the density cross-validation to avoid biasing the scores, we had to manually set a regional field. Now, with the optimal density contrast value found, we can rerun the inversion with an automatically determined regional field strength (the average value misfit at the constraints).
[42]:
density_contrast = best_density_contrast
density_grid = xr.where(
starting_bathymetry >= zref,
density_contrast,
-density_contrast,
)
# create layer of prisms
starting_prisms = utils.grids_to_prisms(
starting_bathymetry,
zref,
density=density_grid,
)
grav_df["starting_gravity"] = starting_prisms.prism_layer.gravity(
coordinates=(
grav_df.easting,
grav_df.northing,
grav_df.upward,
),
field="g_z",
progressbar=True,
)
grav_df = regional.regional_separation(
grav_df=grav_df,
**regional_grav_kwargs,
)
regional_comparison(grav_df)
[43]:
grav_grid = grav_df.set_index(["northing", "easting"]).to_xarray()
fig = maps.plot_grd(
grav_grid.gravity_anomaly,
region=inversion_region,
fig_height=10,
title="Partial Topo-free disturbance",
cmap="balance+h0",
hist=True,
cbar_label="mGal",
frame=["nSWe", "xaf10000", "yaf10000"],
)
fig = maps.plot_grd(
grav_grid.misfit,
region=inversion_region,
fig=fig,
origin_shift="xshift",
fig_height=10,
title="Misfit",
cmap="balance+h0",
hist=True,
cbar_label="mGal",
frame=["nSwE", "xaf10000", "yaf10000"],
)
fig = maps.plot_grd(
grav_grid.reg,
region=inversion_region,
fig=fig,
origin_shift="xshift",
fig_height=10,
title="Regional misfit",
cmap="balance+h0",
hist=True,
cbar_label="mGal",
frame=["nSwE", "xaf10000", "yaf10000"],
)
fig = maps.plot_grd(
grav_grid.res,
region=inversion_region,
fig=fig,
origin_shift="xshift",
fig_height=10,
title="Residual misfit",
cmap="balance+h0",
cpt_lims=[-vd.maxabs(grav_grid.res), vd.maxabs(grav_grid.res)],
hist=True,
cbar_label="mGal",
frame=["nSwE", "xaf10000", "yaf10000"],
points=constraint_points[constraint_points.inside],
points_style="x.2c",
)
fig.show()
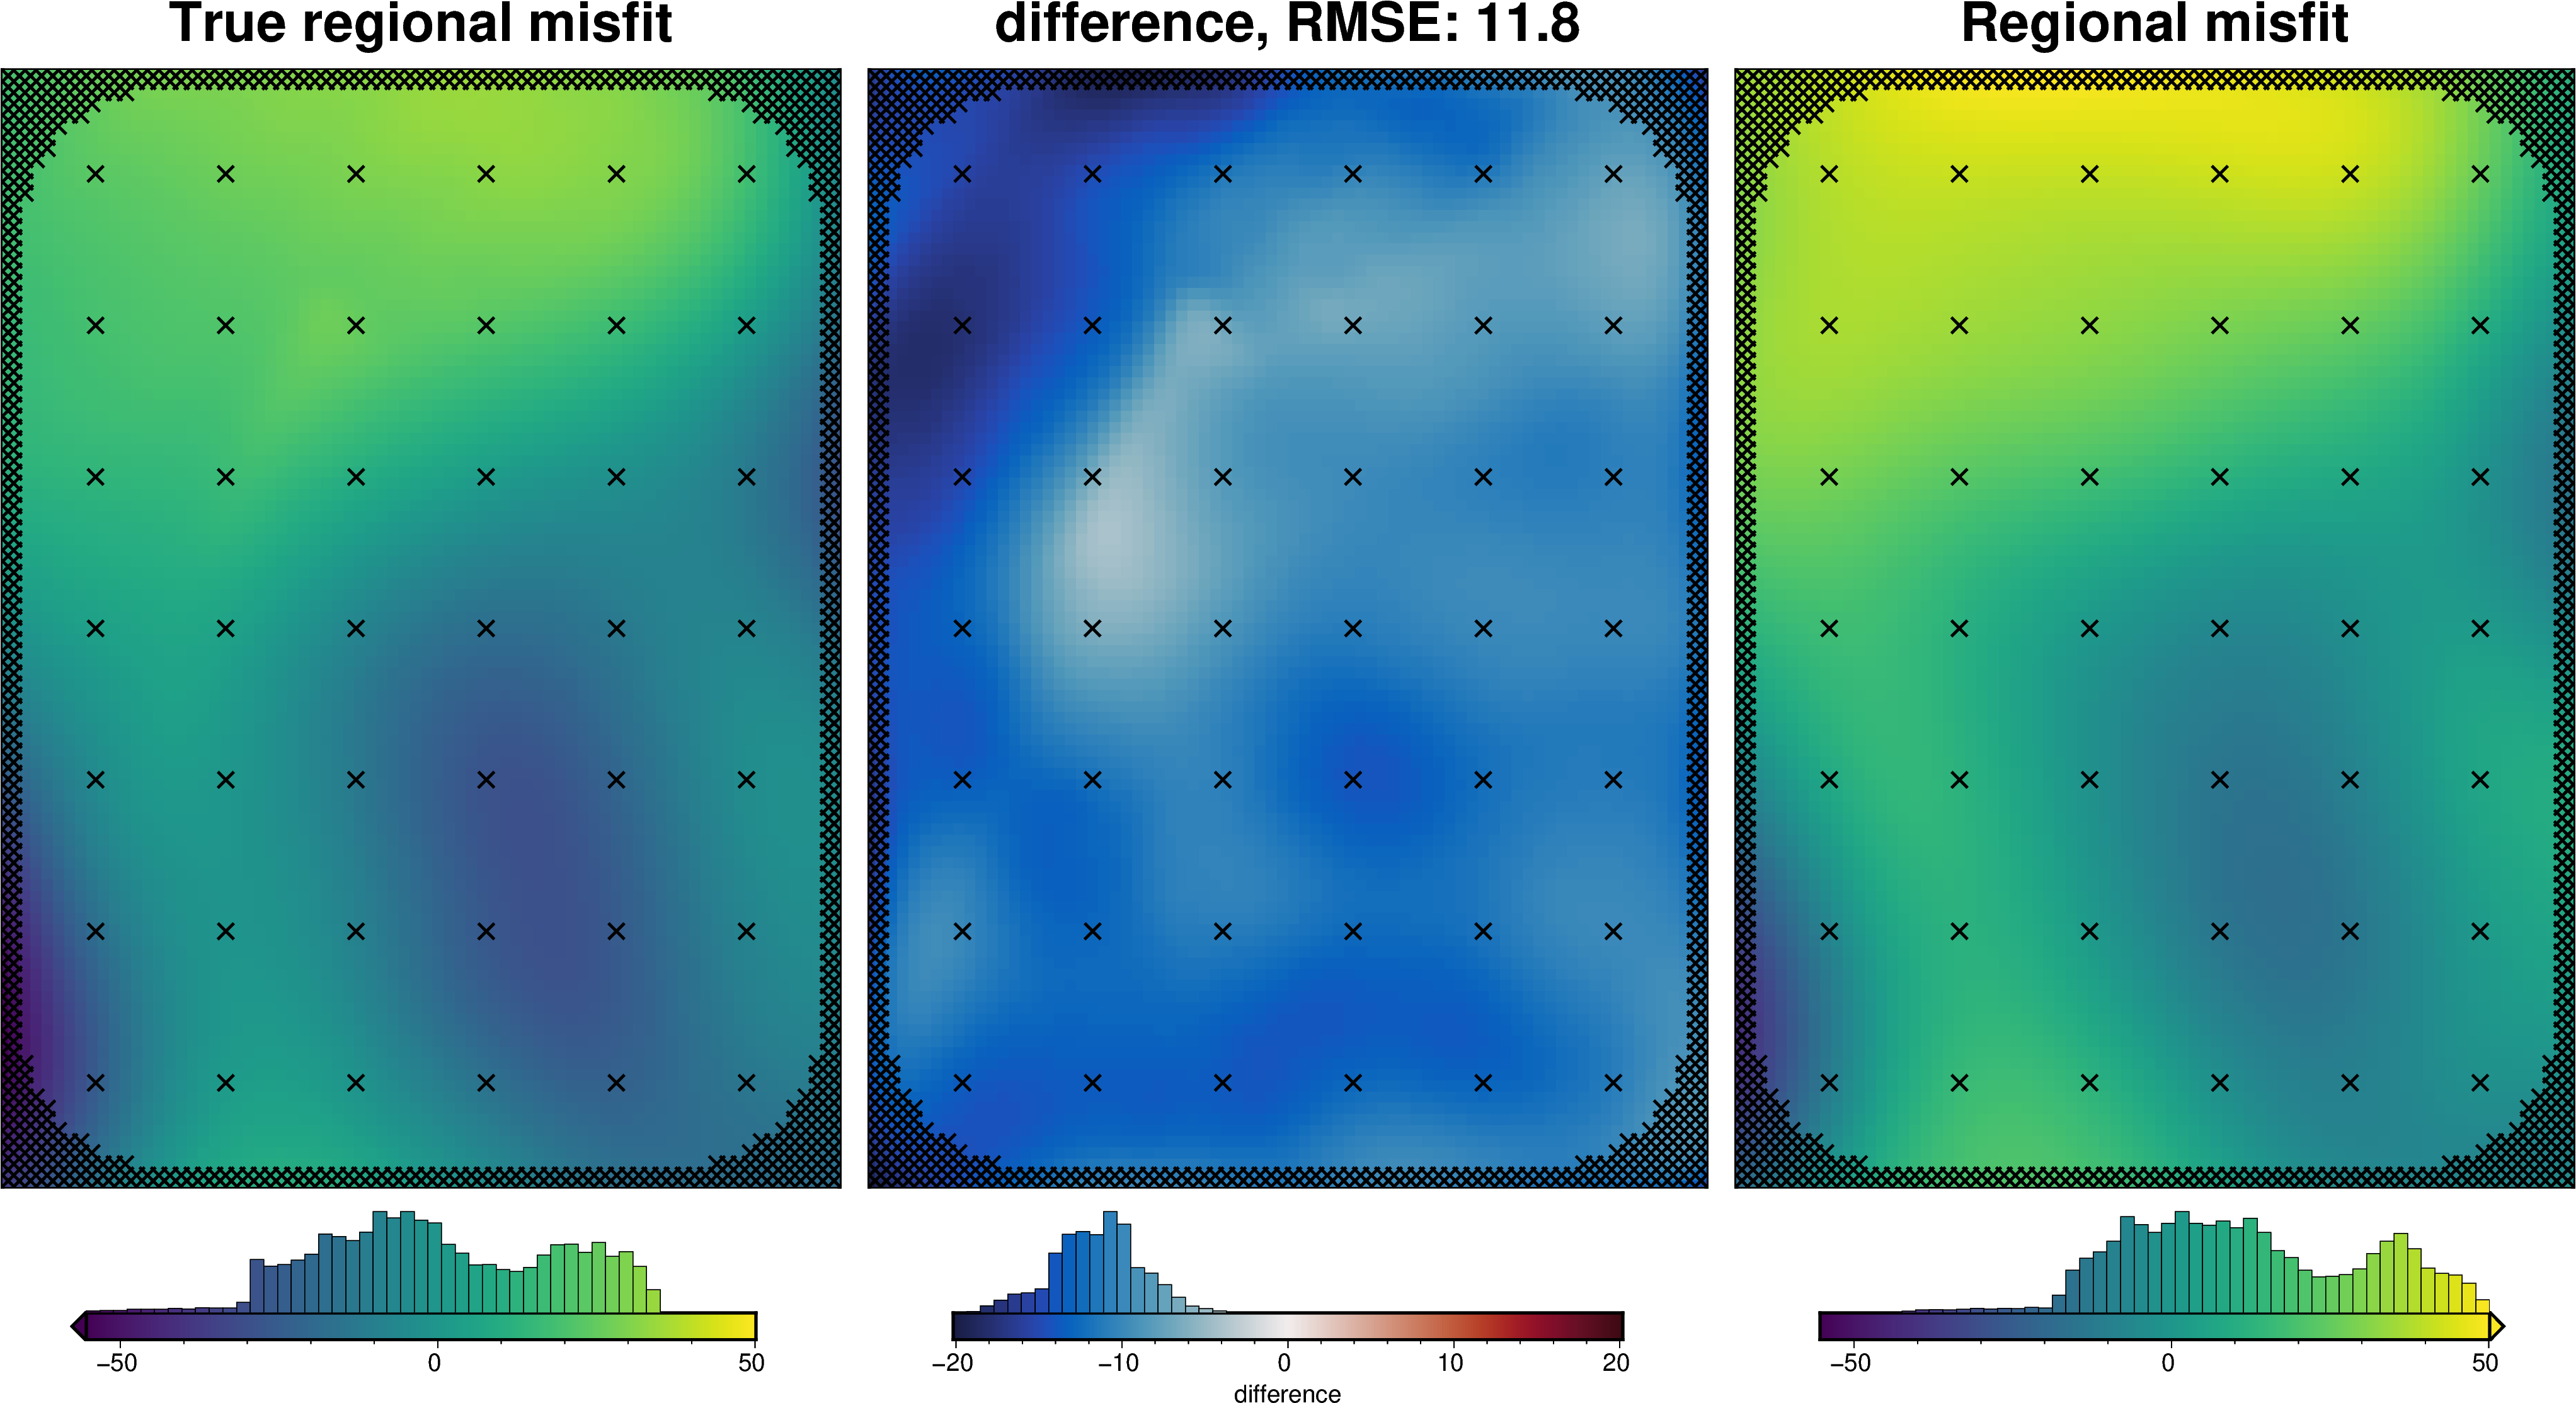
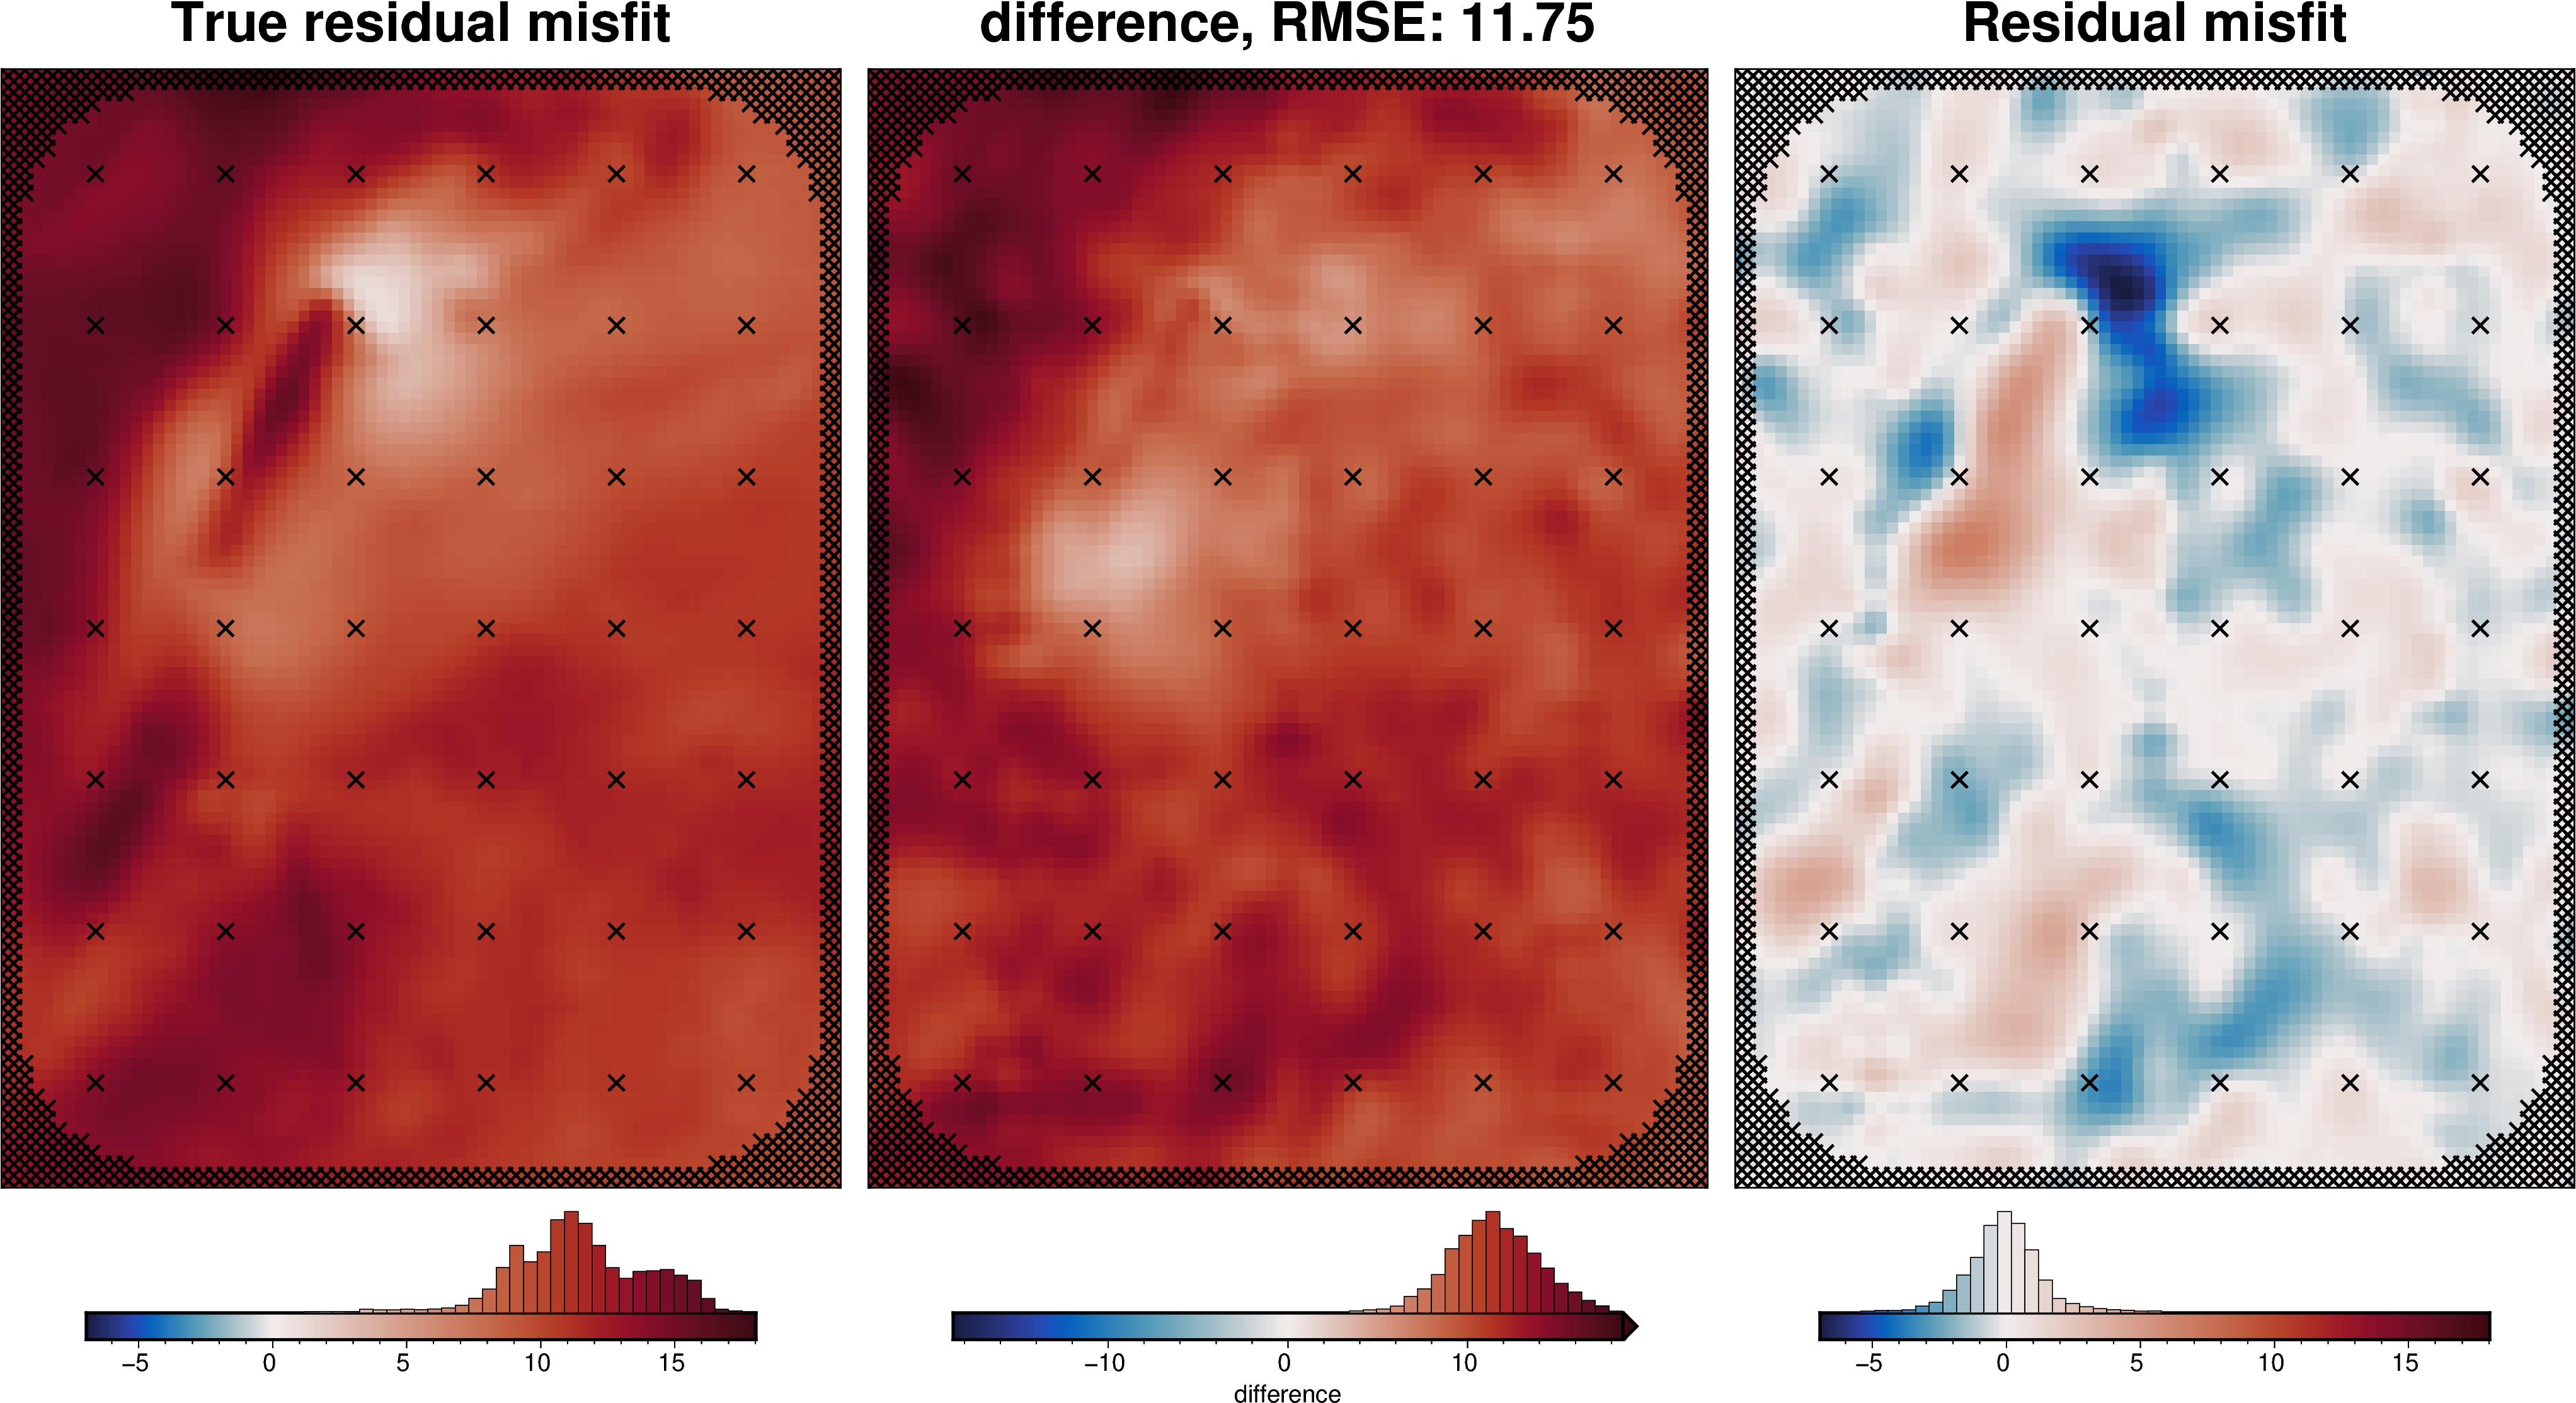
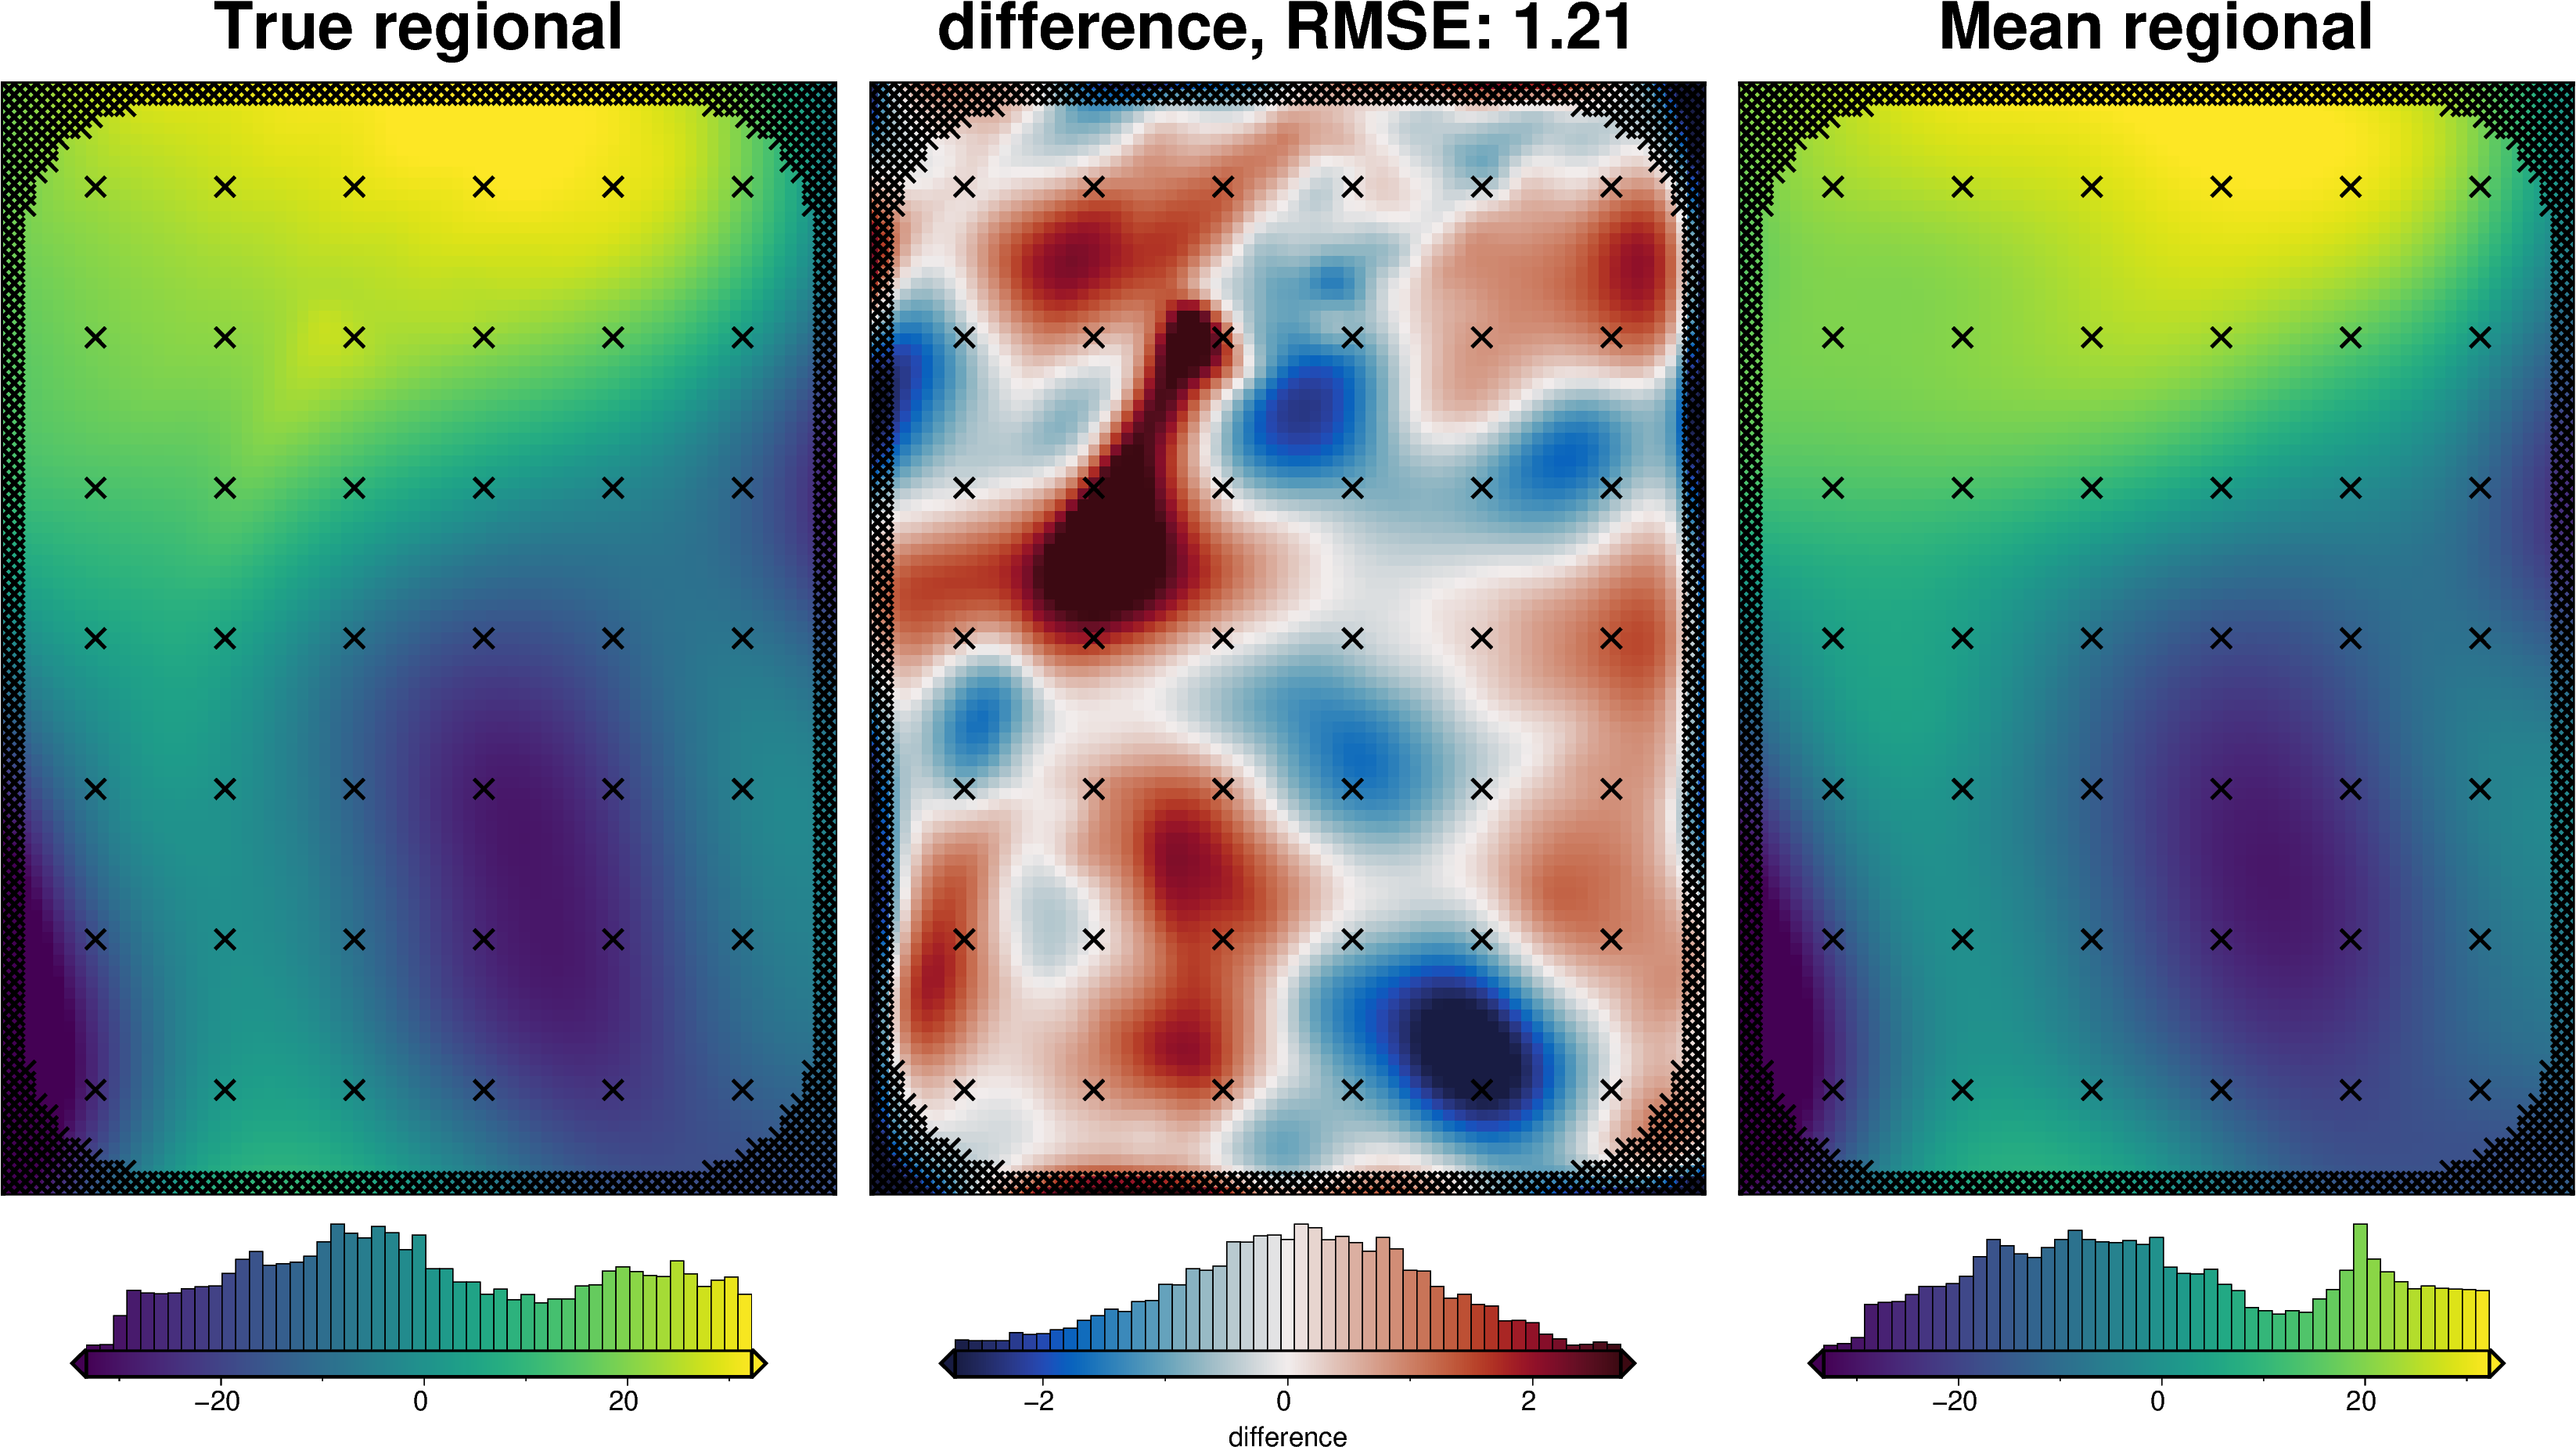
[44]:
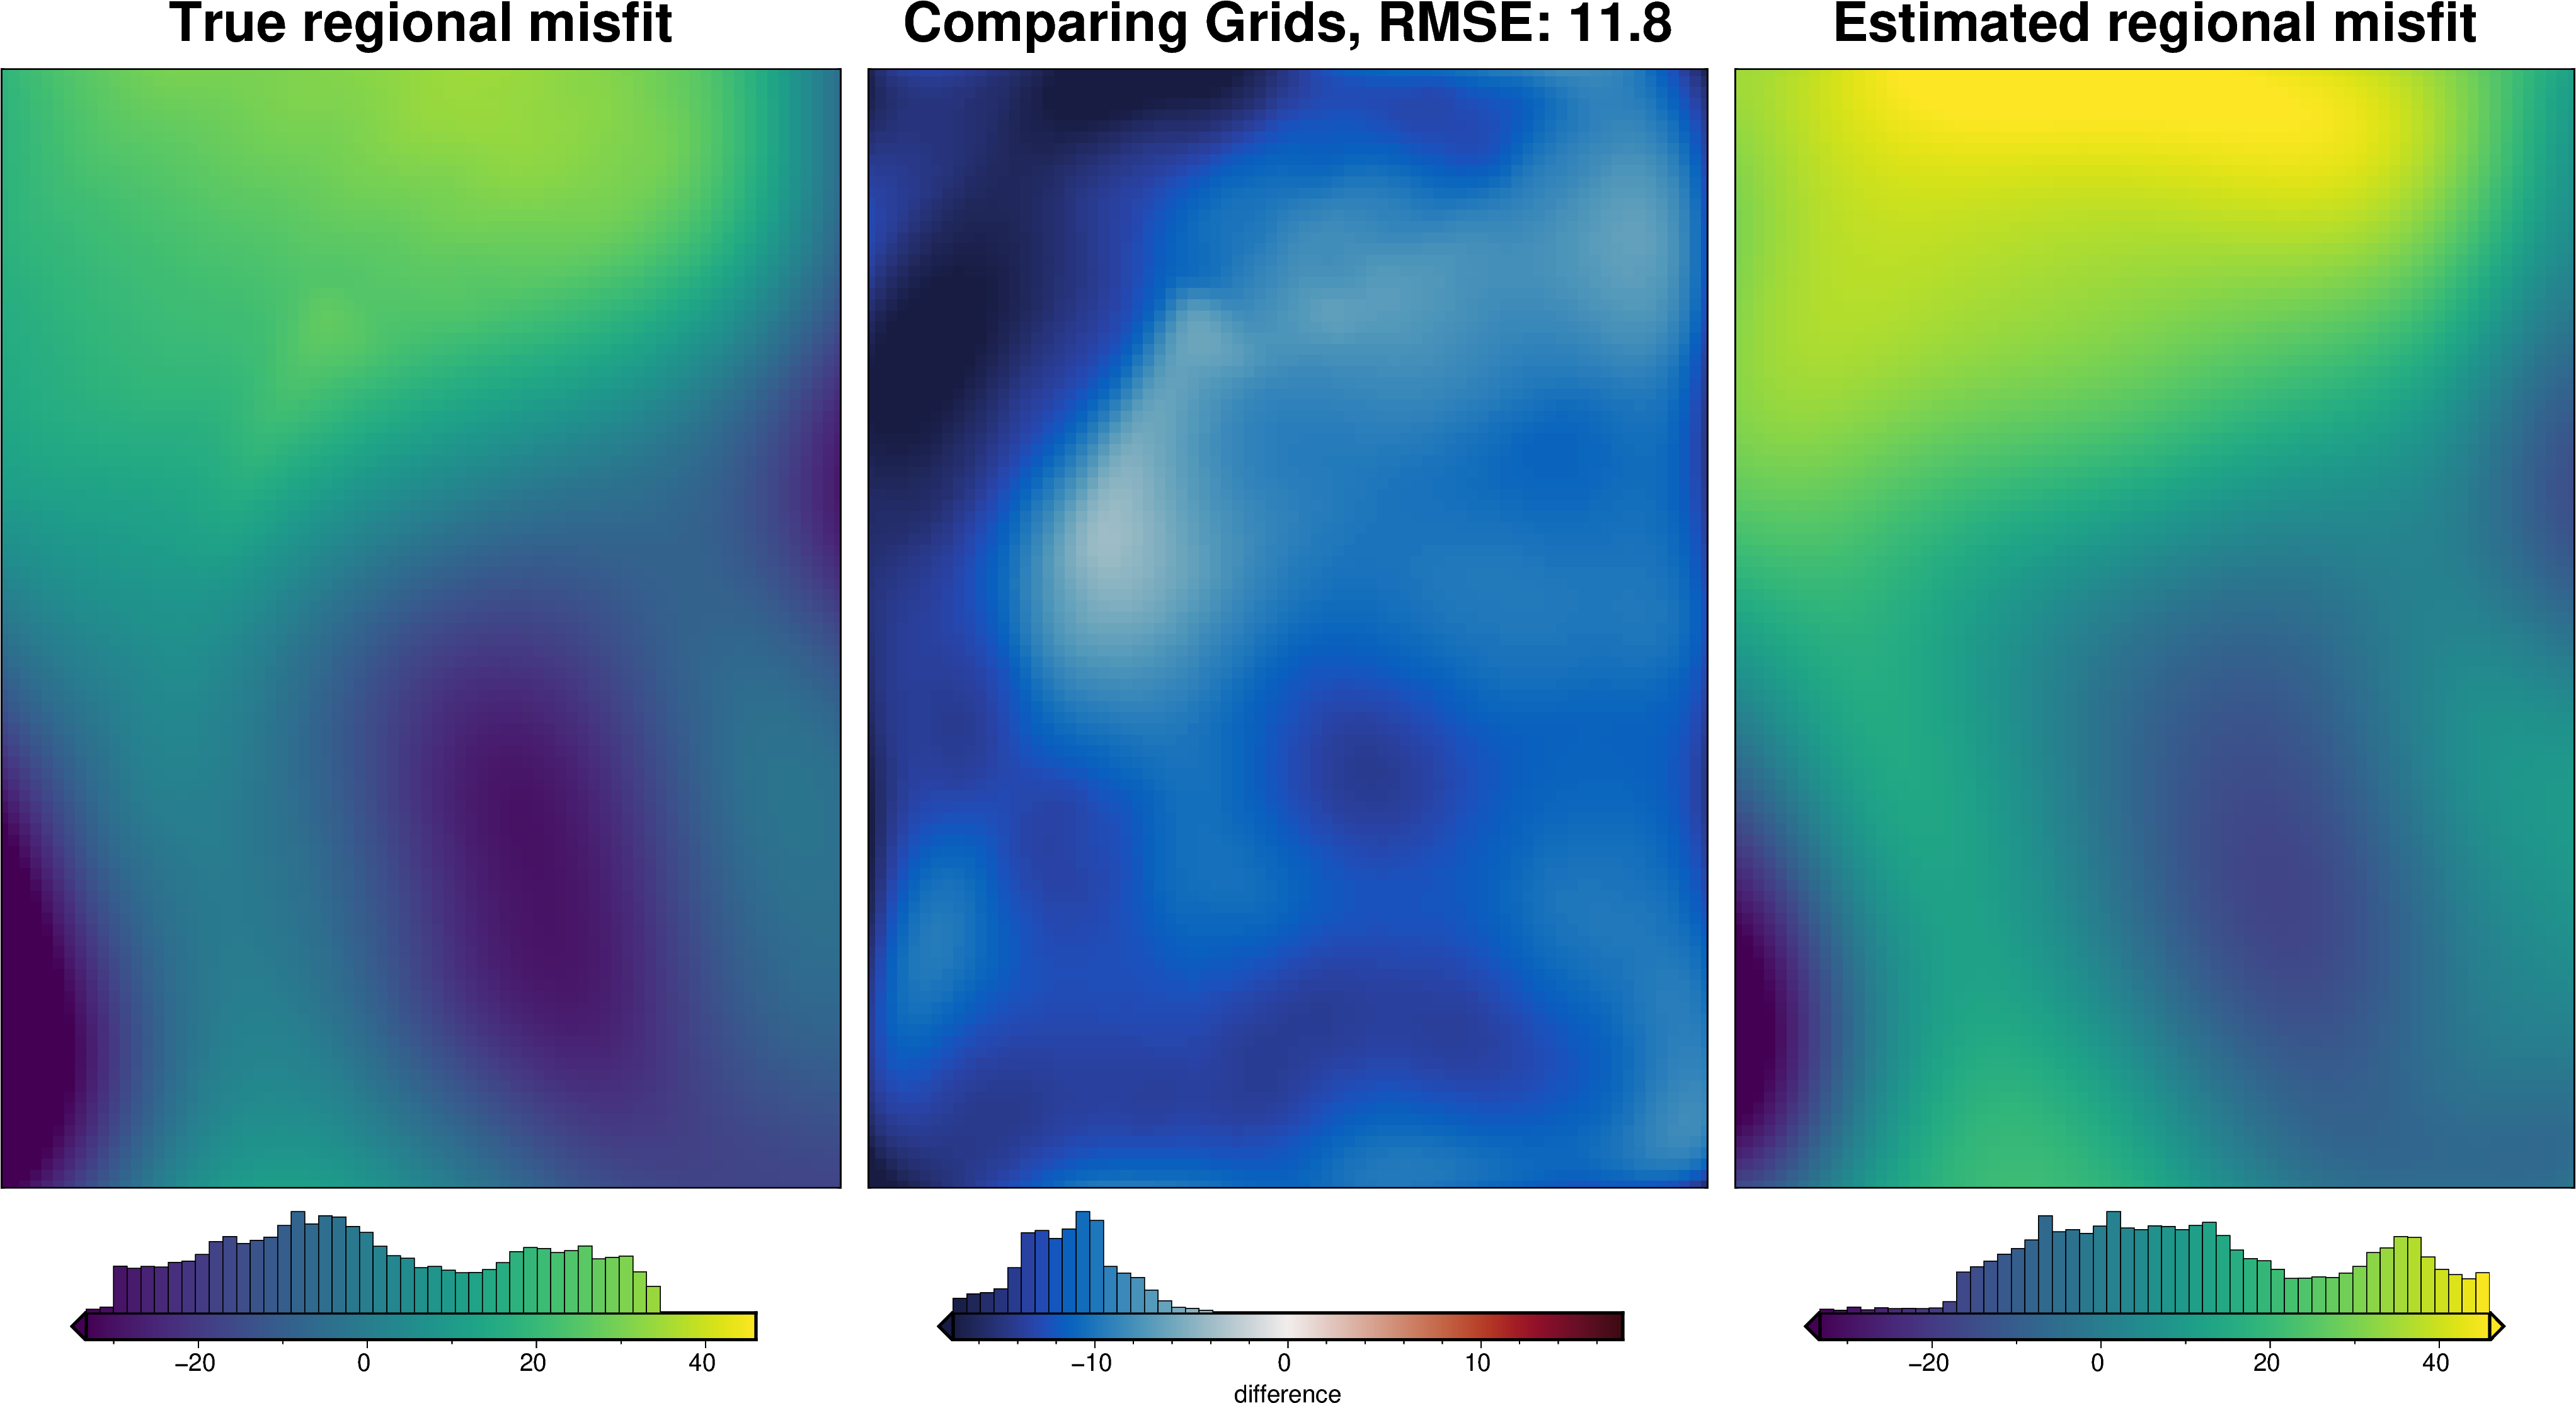
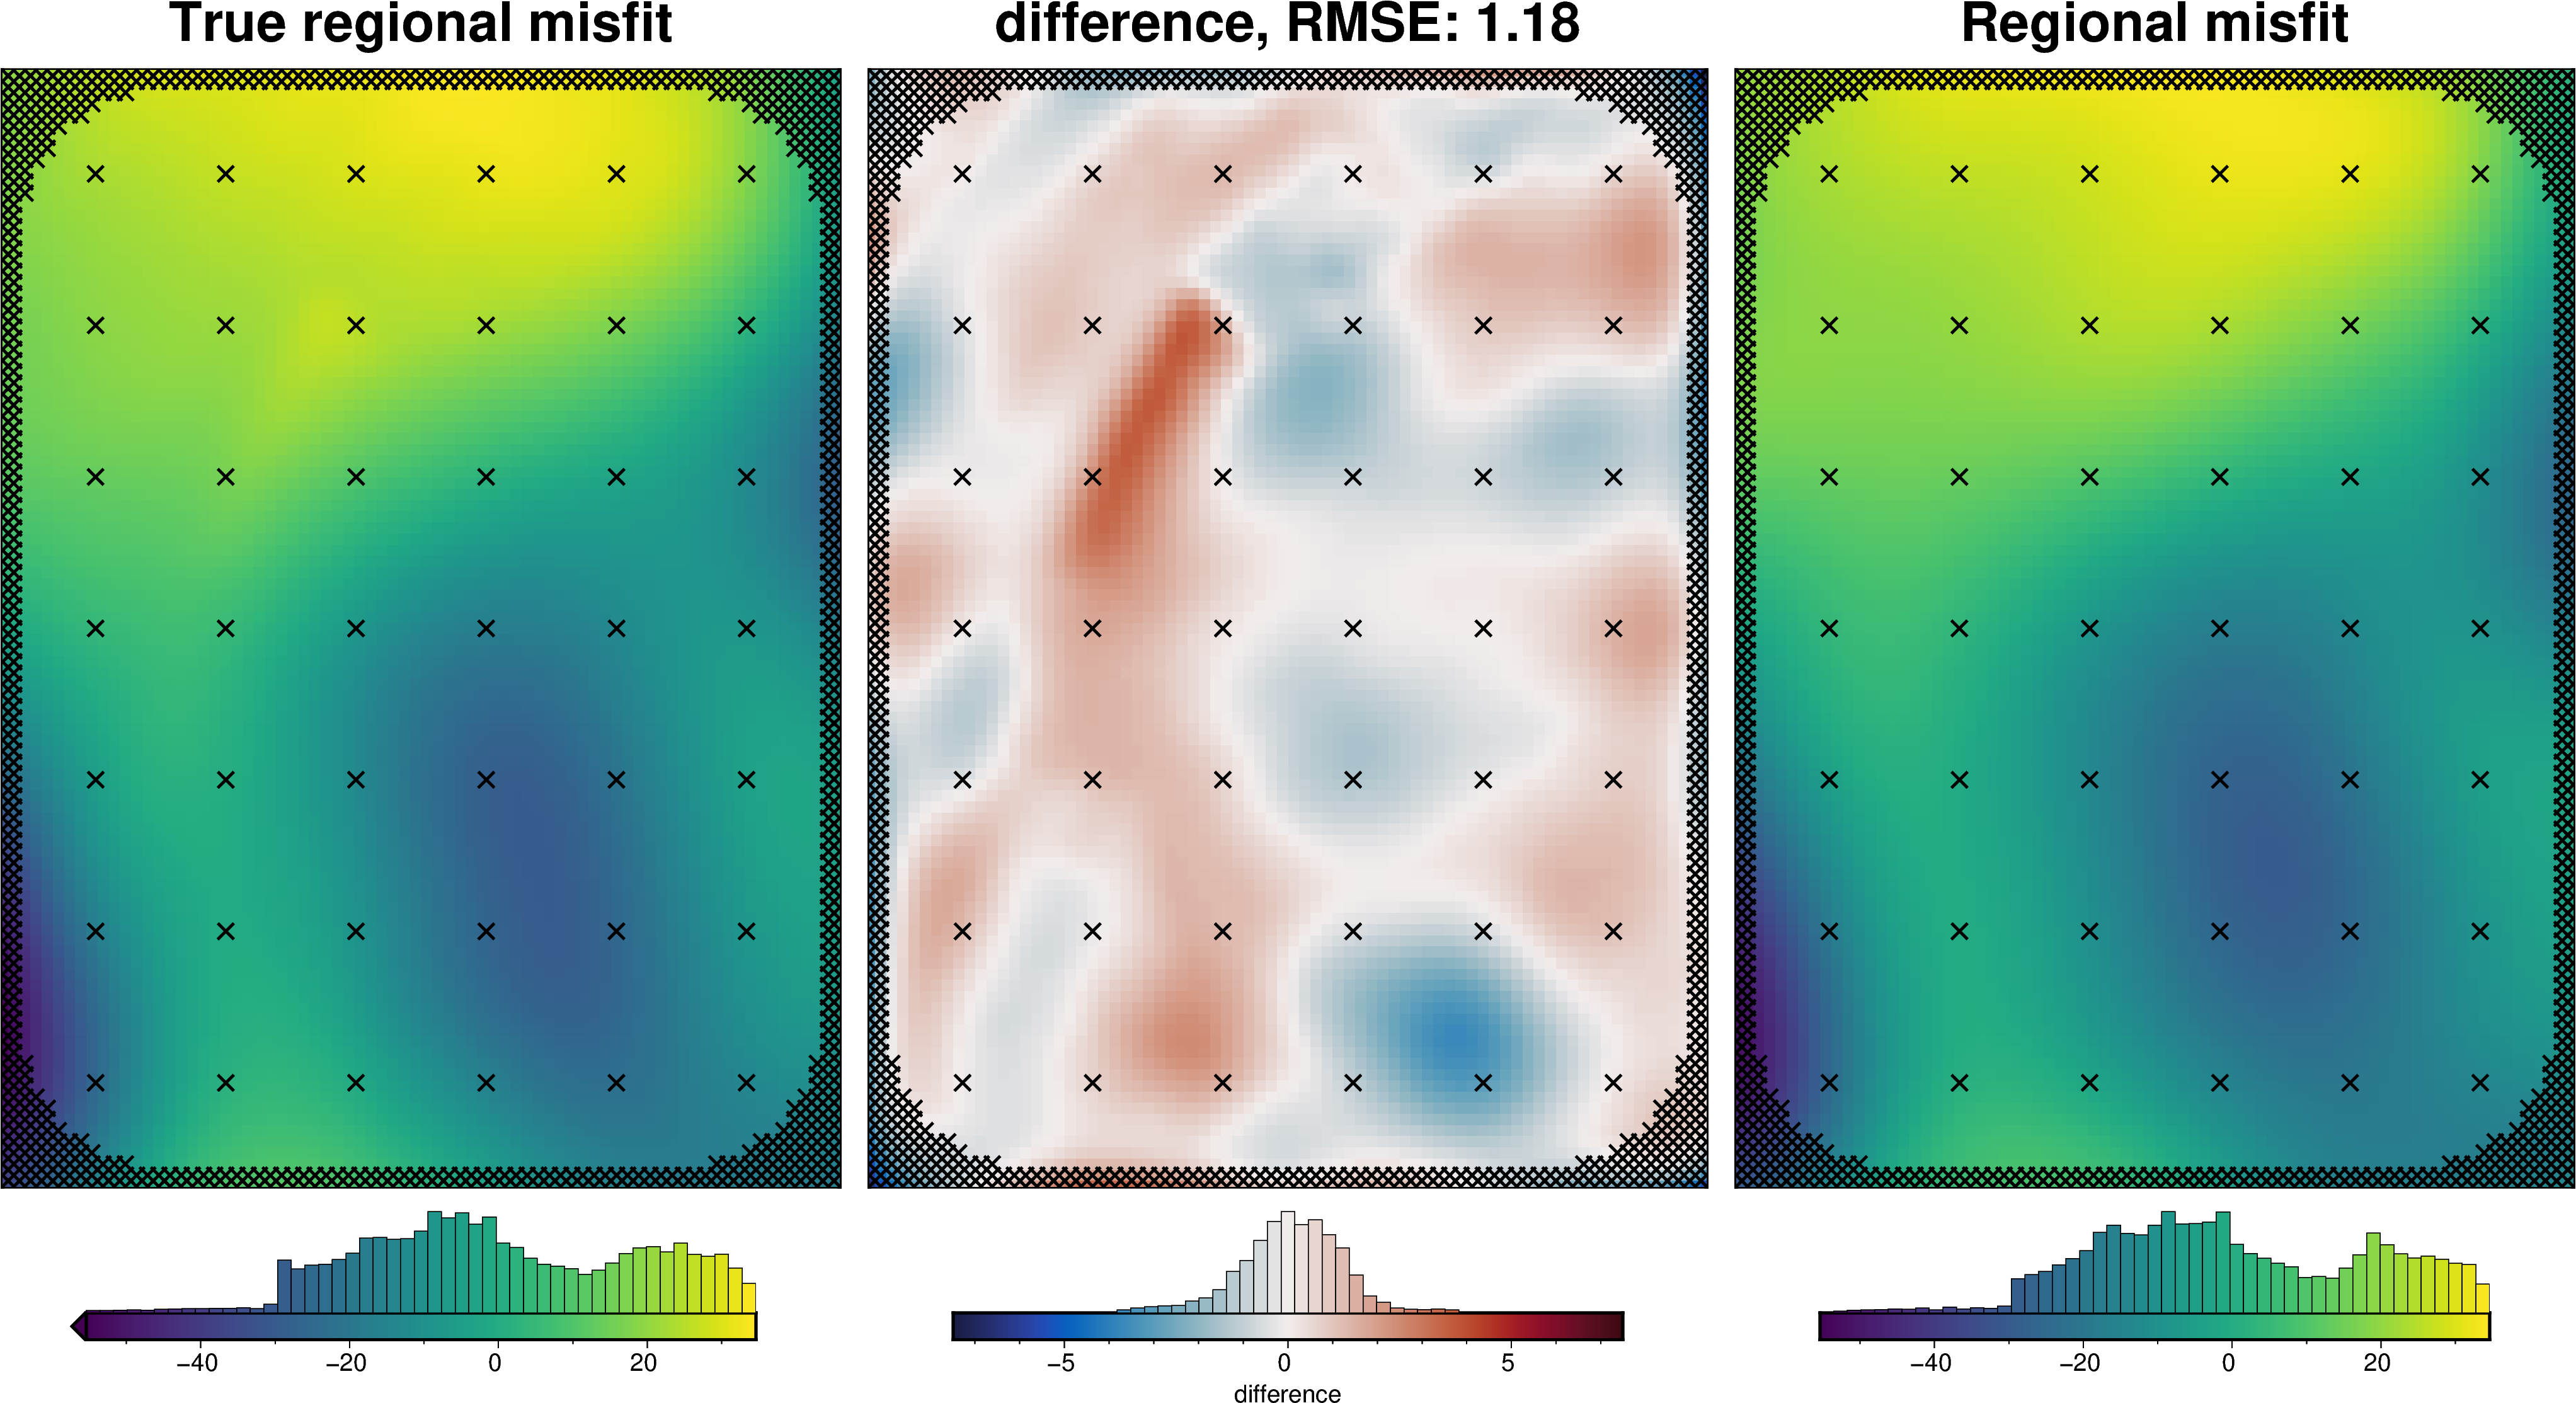
_ = polar_utils.grd_compare(
grav_grid.basement_grav,
grav_grid.reg,
plot=True,
inset=False,
robust=True,
grid1_name="True regional misfit",
grid2_name="Estimated regional misfit",
hist=True,
)
[45]:
# run the inversion workflow
inversion_results = inversion.run_inversion_workflow(
grav_df=grav_df,
fname=f"{fpath}_optimal",
starting_prisms=starting_prisms,
plot_dynamic_convergence=True,
**kwargs,
)
[46]:
# load saved inversion results
with pathlib.Path(f"{fpath}_optimal_results.pickle").open("rb") as f:
results = pickle.load(f)
# collect the results
topo_results, grav_results, parameters, elapsed_time = results
final_topography = topo_results.set_index(["northing", "easting"]).to_xarray().topo
[47]:
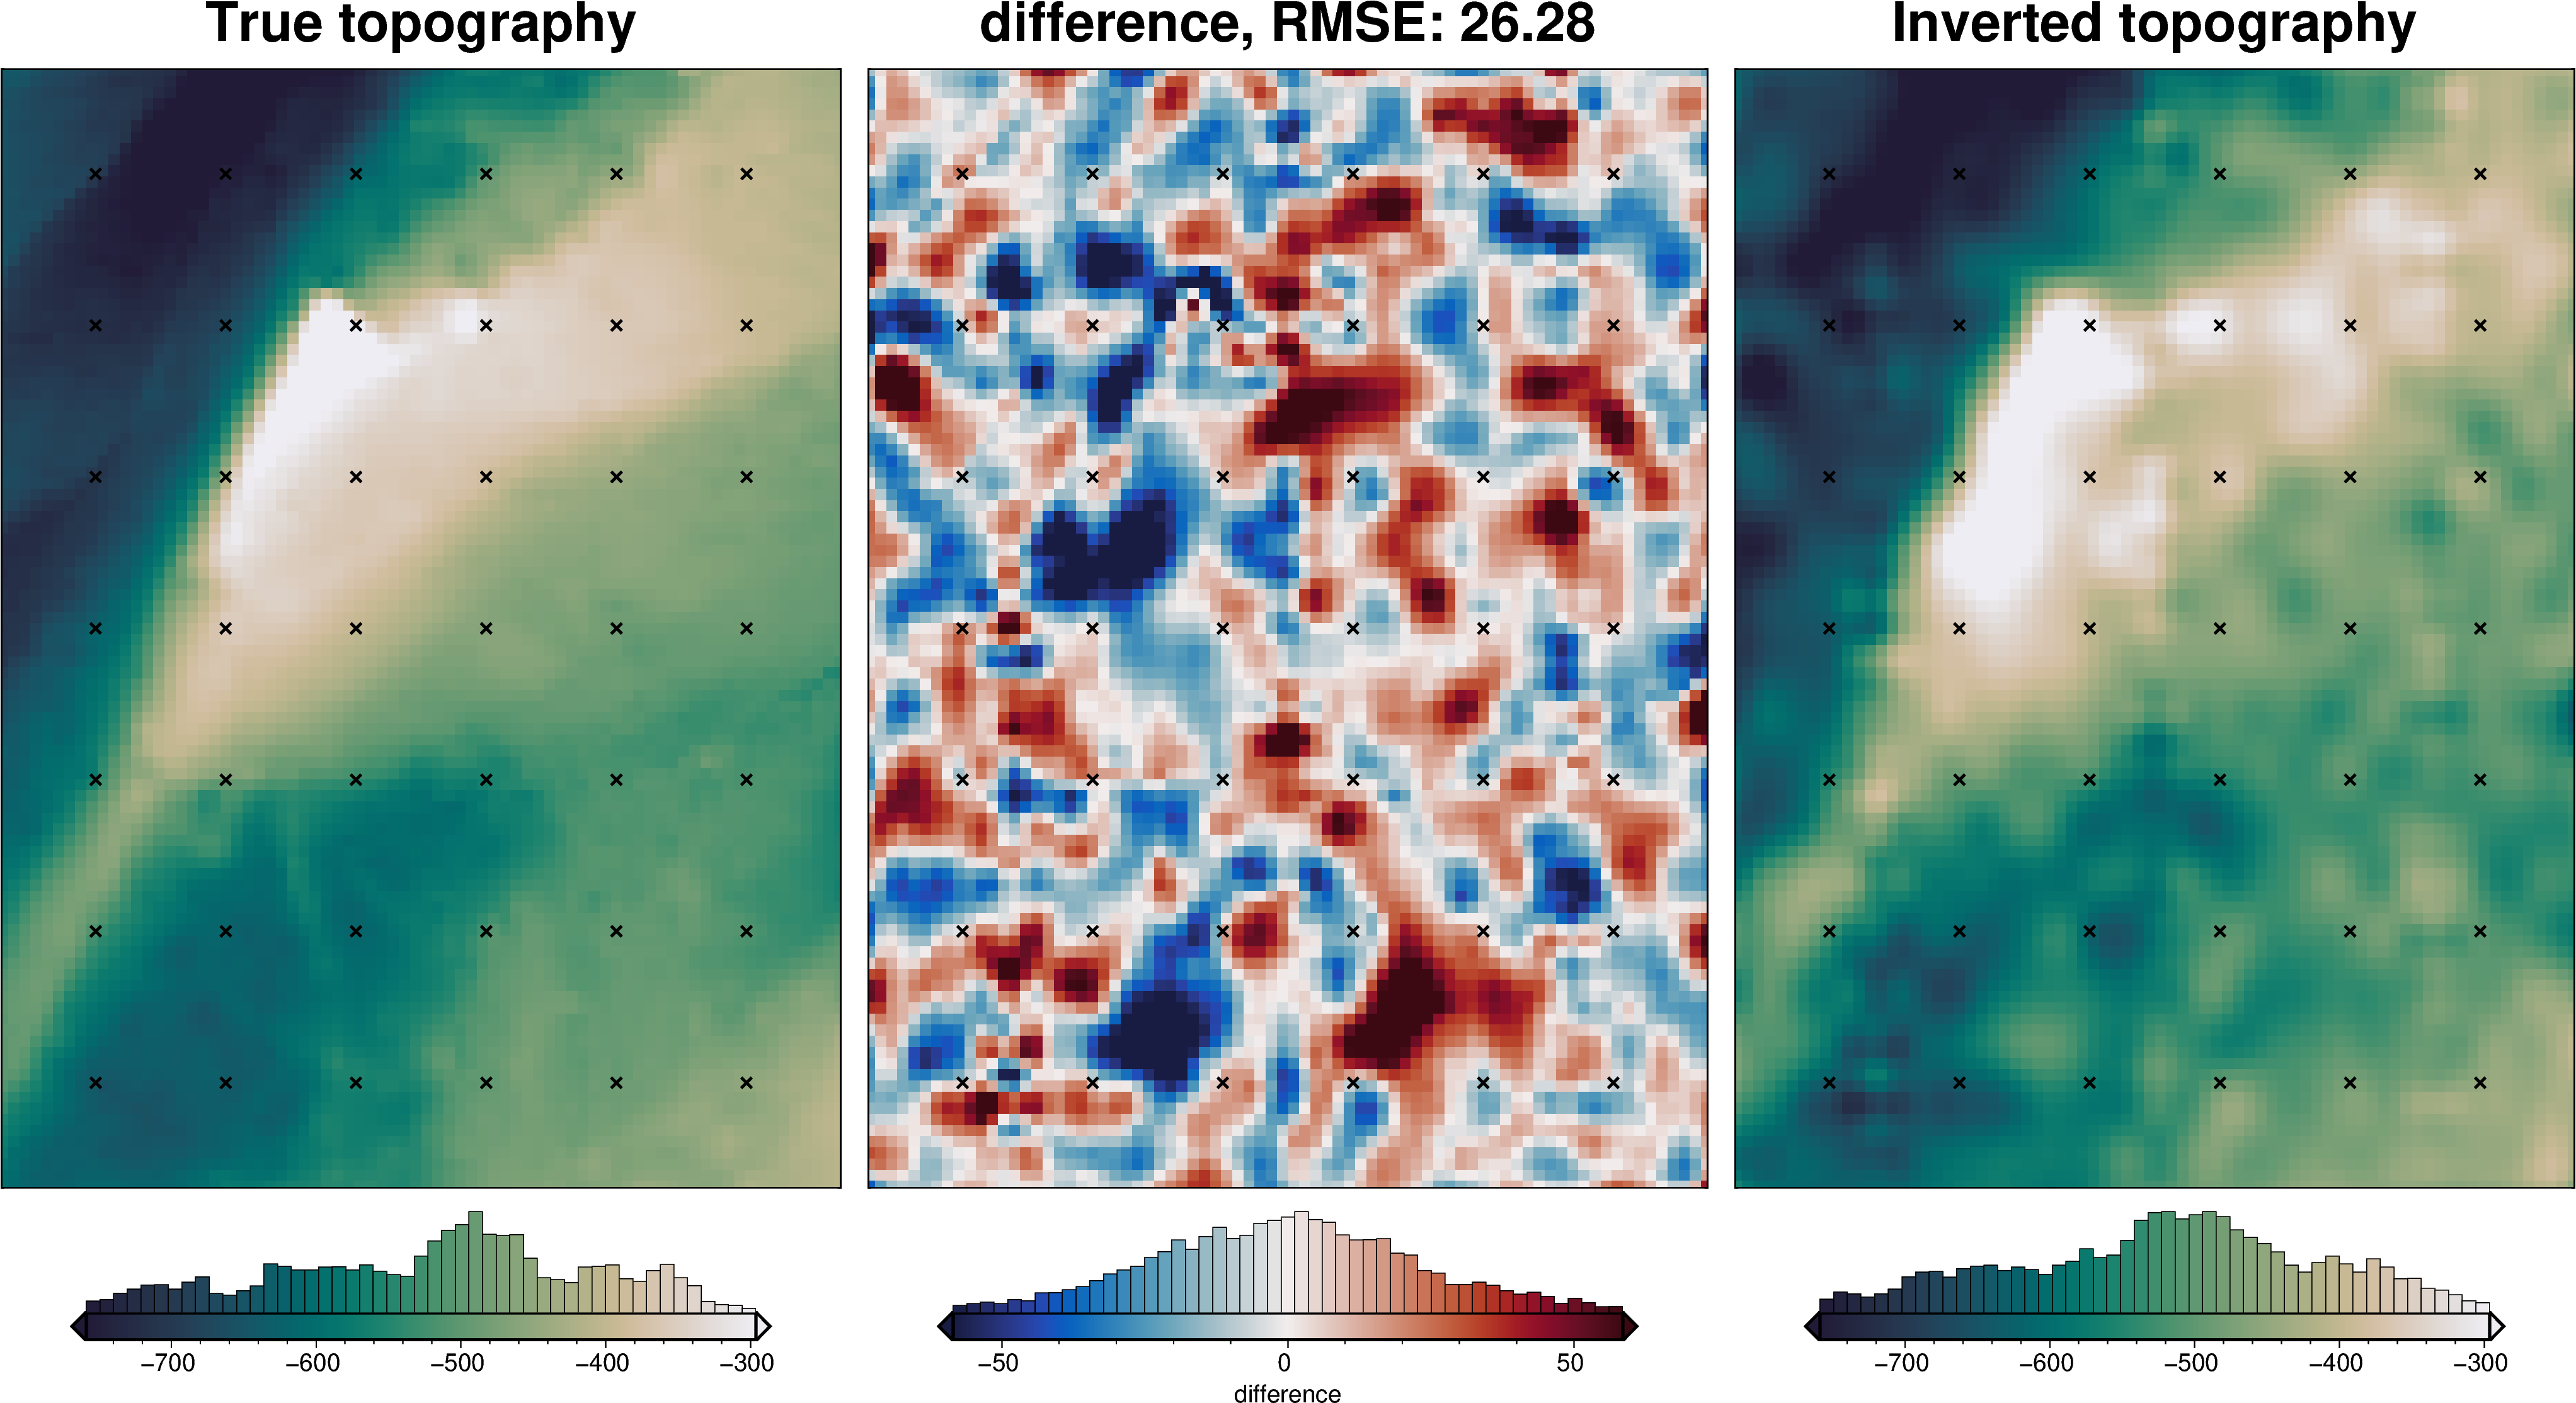
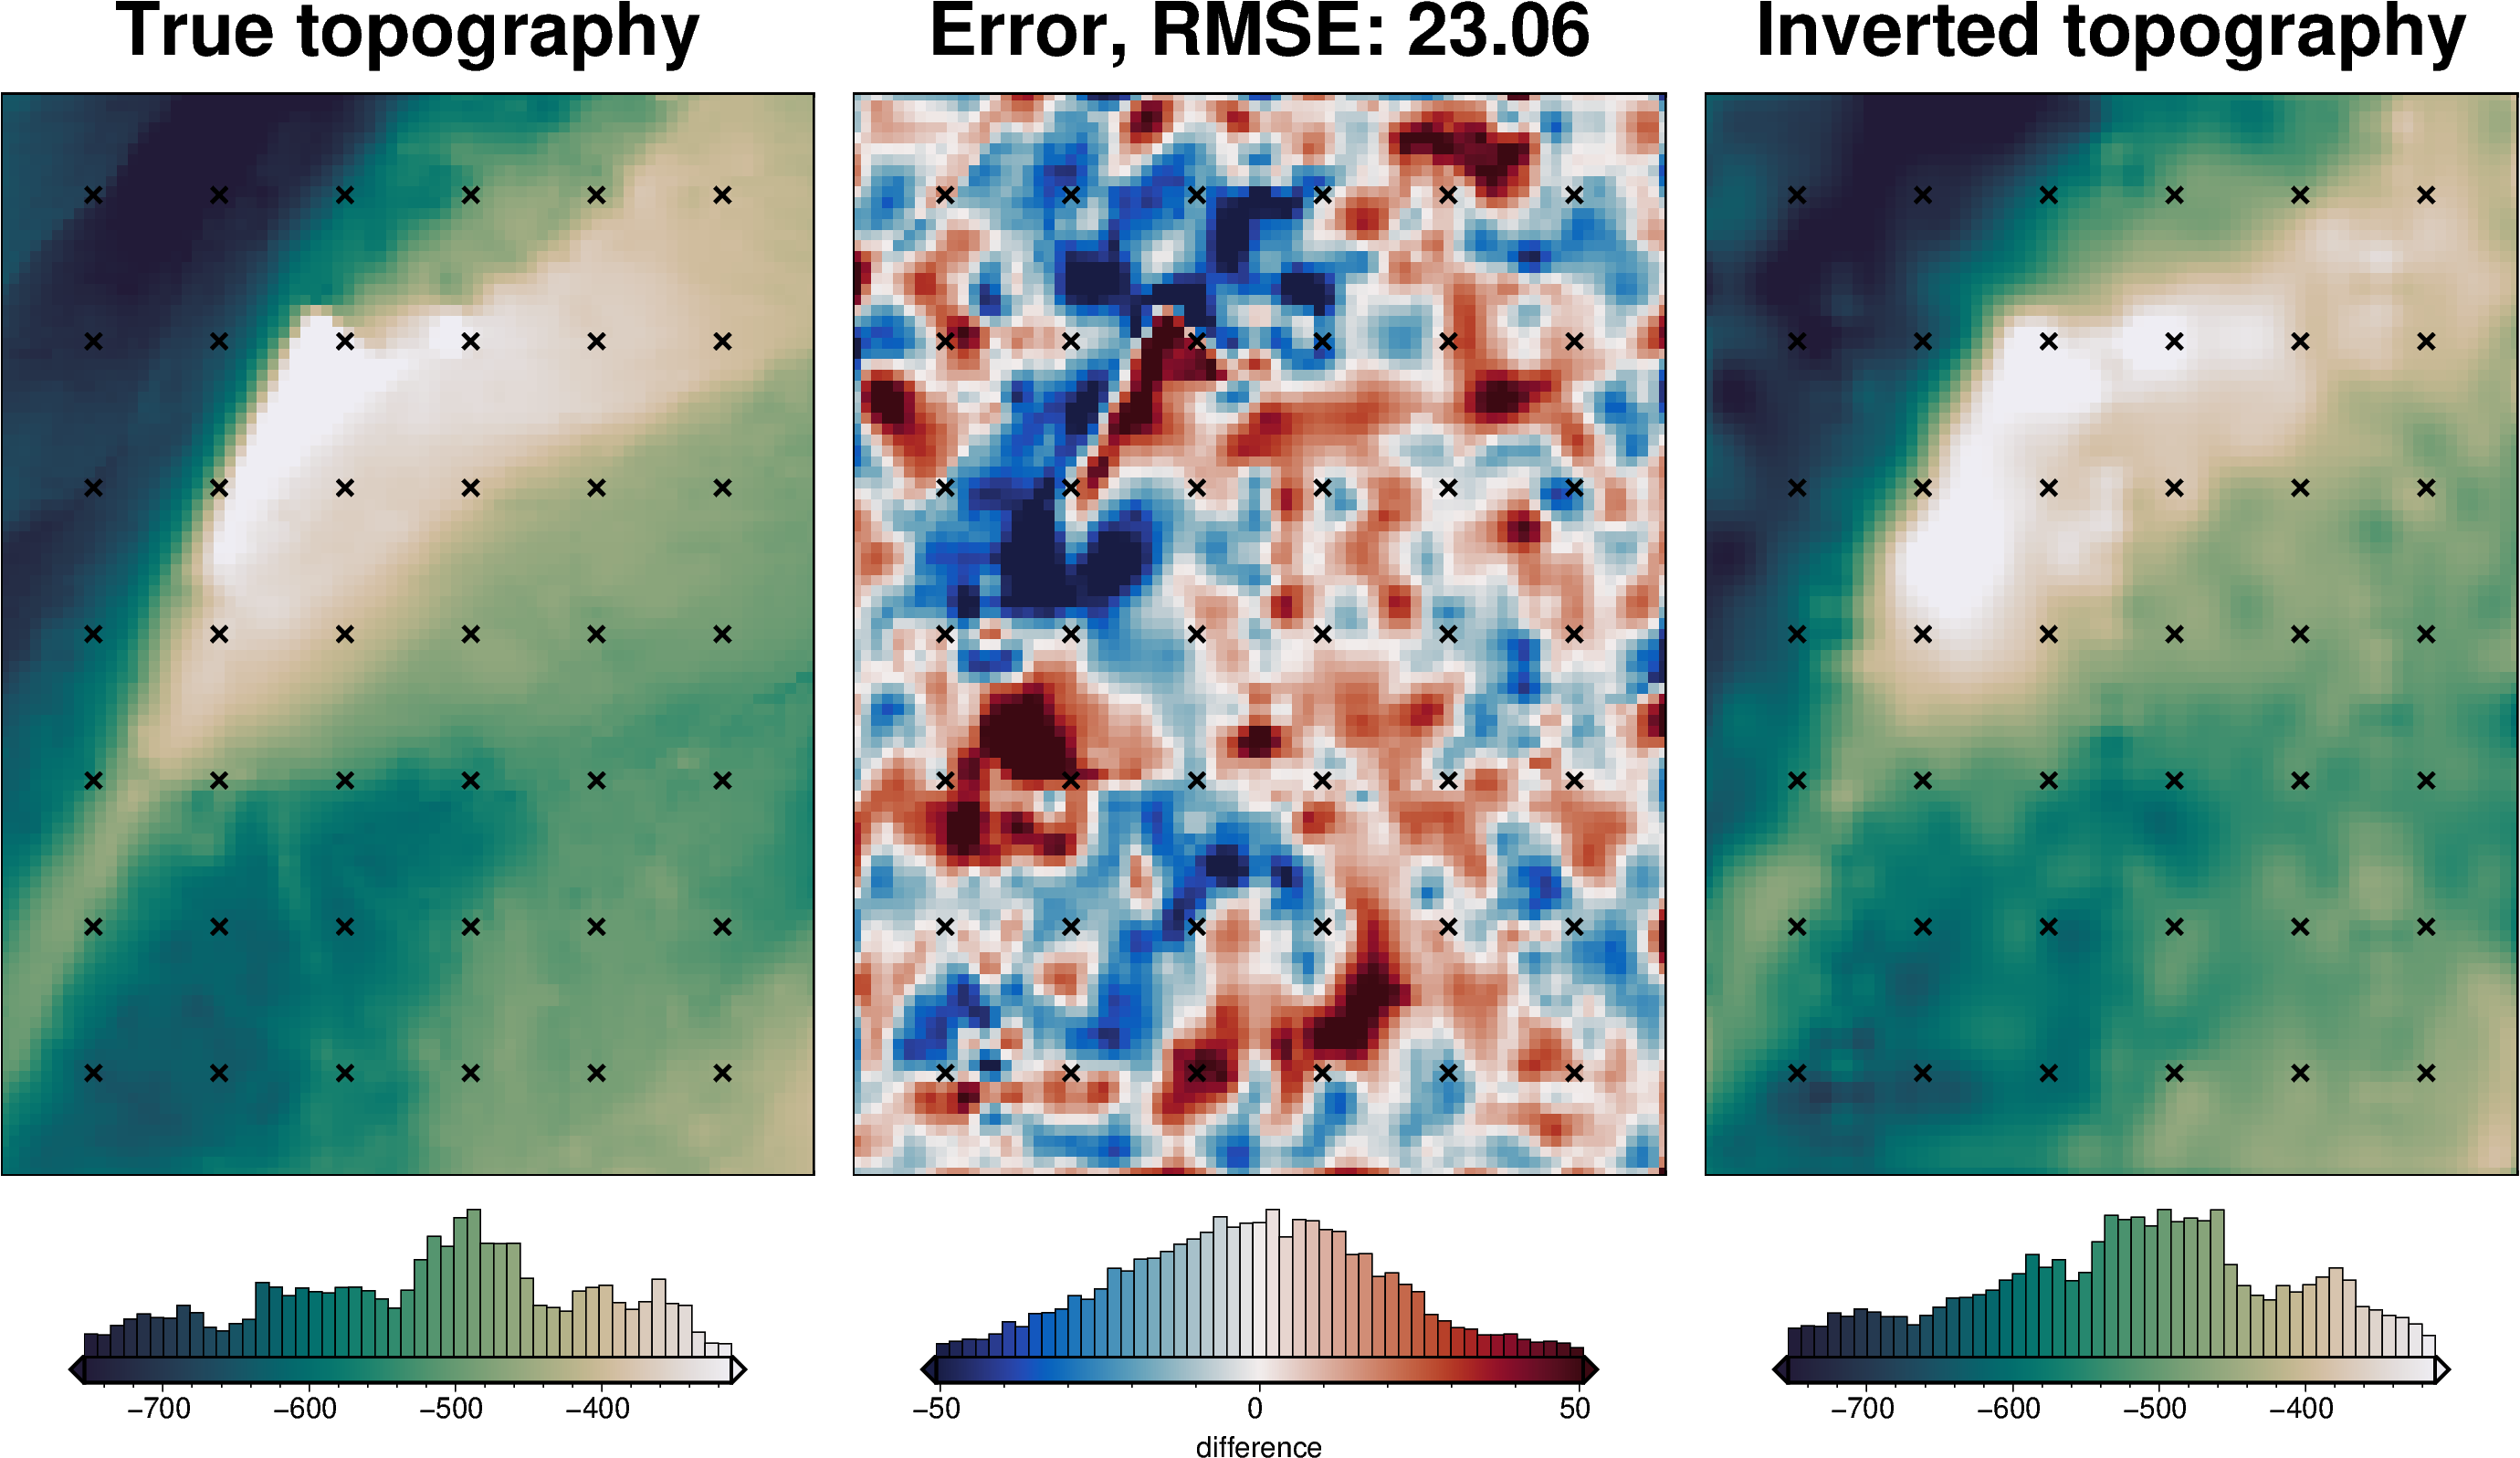
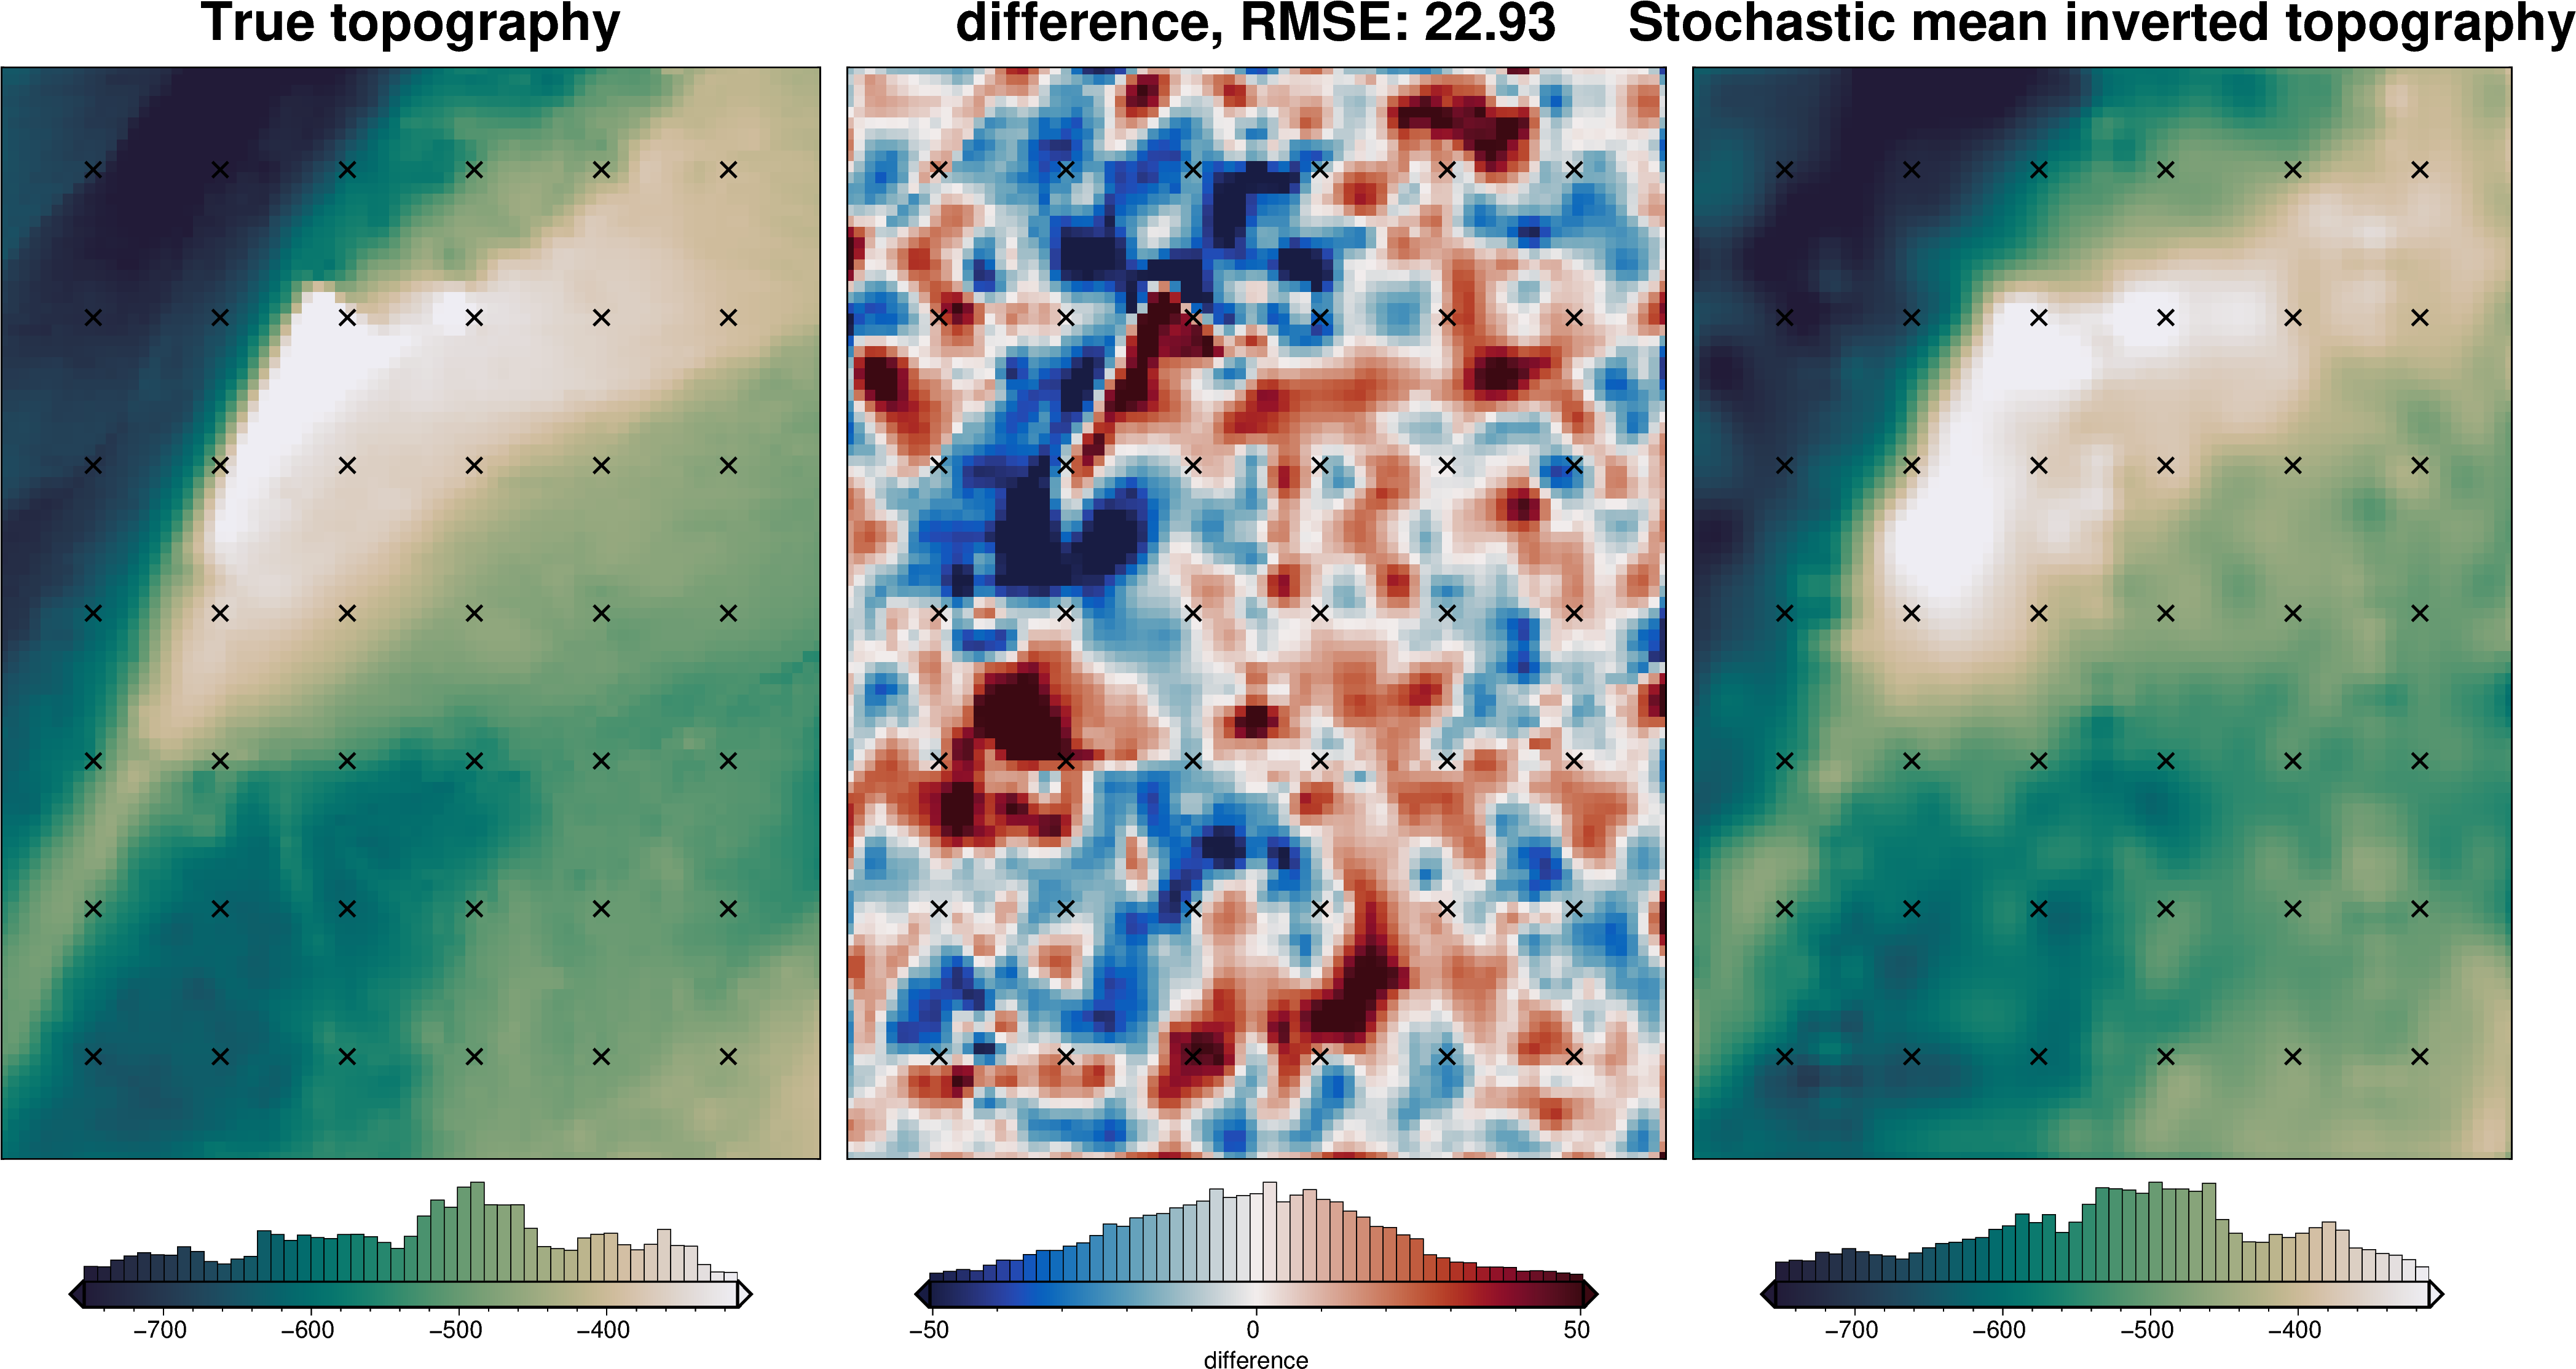
_ = polar_utils.grd_compare(
bathymetry,
final_topography,
fig_height=10,
region=inversion_region,
plot=True,
grid1_name="True topography",
grid2_name="Inverted topography",
robust=True,
hist=True,
inset=False,
verbose="q",
title="Error",
grounding_line=False,
reverse_cpt=True,
cmap="rain",
points=constraint_points[constraint_points.inside],
points_style="x.2c",
)
[48]:
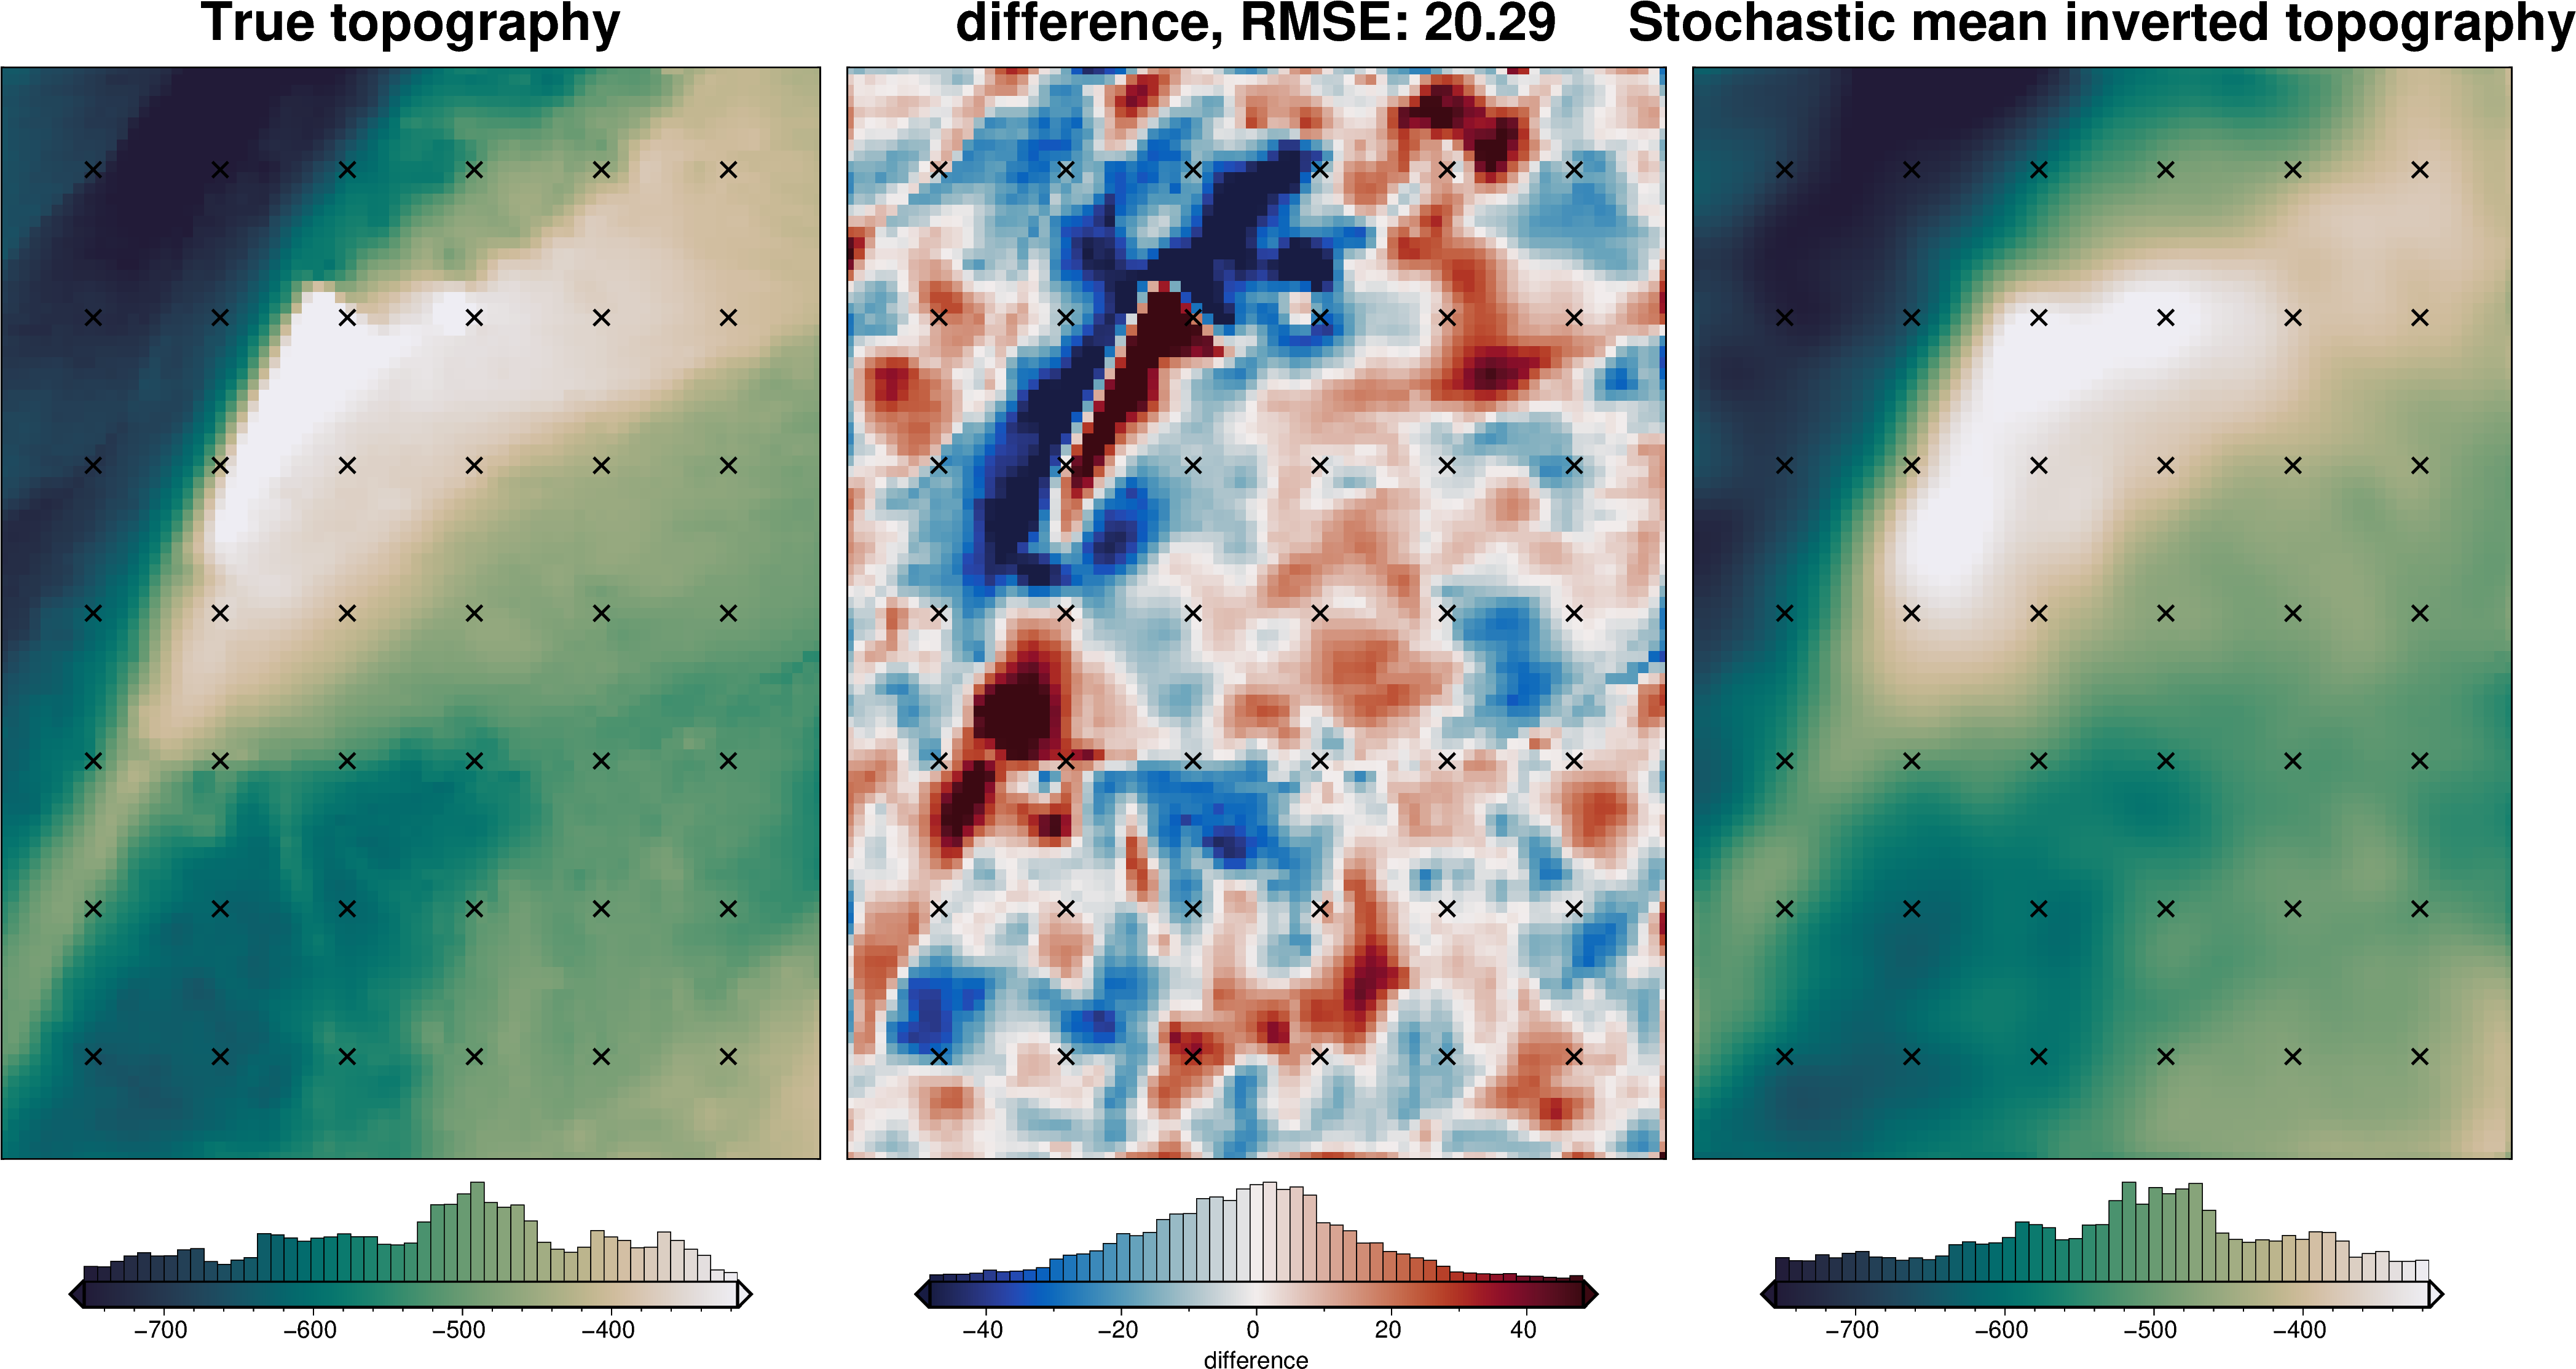
plotting.plot_inversion_results(
grav_results,
topo_results,
parameters,
inversion_region,
iters_to_plot=2,
plot_iter_results=True,
plot_topo_results=True,
plot_grav_results=True,
)
[49]:
# sample the inverted topography at the constraint points
constraint_points = utils.sample_grids(
constraint_points,
final_topography,
"inverted_topography",
coord_names=("easting", "northing"),
)
rmse = utils.rmse(constraint_points.true_upward - constraint_points.inverted_topography)
print(f"RMSE: {rmse:.2f} m")
RMSE: 17.71 m
[50]:
# save to csv
constraint_points.to_csv(f"{fpath}_constraint_points.csv", index=False)
[51]:
constraint_points = pd.read_csv(f"{fpath}_constraint_points.csv")
constraint_points
[51]:
| northing | easting | inside | true_upward | upward | starting_bathymetry | inverted_topography | |
|---|---|---|---|---|---|---|---|
| 0 | -1.600000e+06 | -4.000000e+04 | False | -601.093994 | -601.093994 | -601.093994 | -590.050293 |
| 1 | -1.600000e+06 | -3.800000e+04 | False | -609.216919 | -609.216919 | -609.216919 | -600.067627 |
| 2 | -1.600000e+06 | -3.600000e+04 | False | -616.355957 | -616.355957 | -616.355957 | -607.288757 |
| 3 | -1.600000e+06 | -3.400000e+04 | False | -621.262268 | -621.262268 | -621.262268 | -612.007629 |
| 4 | -1.600000e+06 | -3.200000e+04 | False | -625.510925 | -625.510925 | -625.510925 | -614.203979 |
| ... | ... | ... | ... | ... | ... | ... | ... |
| 881 | -1.418571e+06 | -3.637979e-12 | True | -747.305711 | -747.305711 | -747.289192 | -724.675625 |
| 882 | -1.418571e+06 | 2.333333e+04 | True | -619.672055 | -619.672055 | -619.459742 | -600.196997 |
| 883 | -1.418571e+06 | 4.666667e+04 | True | -505.761536 | -505.761536 | -505.739808 | -494.056020 |
| 884 | -1.418571e+06 | 7.000000e+04 | True | -447.753091 | -447.753091 | -447.782831 | -461.410556 |
| 885 | -1.418571e+06 | 9.333333e+04 | True | -395.004206 | -395.004206 | -395.079663 | -388.238766 |
886 rows × 7 columns
Redo regional separation with true density
[52]:
density_grid = xr.where(
starting_bathymetry >= zref,
true_density_contrast,
-true_density_contrast,
)
# create layer of prisms
starting_prisms_true = utils.grids_to_prisms(
starting_bathymetry,
zref,
density=density_grid,
)
grav_df_true_density = grav_df.copy()
grav_df_true_density["starting_gravity"] = starting_prisms_true.prism_layer.gravity(
coordinates=(
grav_df_true_density.easting,
grav_df_true_density.northing,
grav_df_true_density.upward,
),
field="g_z",
progressbar=True,
)
# temporarily set some kwargs
true_density_reg_kwargs = copy.deepcopy(regional_grav_kwargs)
true_density_reg_kwargs["cv_kwargs"]["fname"] = (
"../tmp_outputs/Ross_Sea_05_regional_sep_true_density"
)
true_density_reg_kwargs["cv_kwargs"]["progressbar"] = True
grav_df_true_density = regional.regional_separation(
grav_df=grav_df_true_density,
**true_density_reg_kwargs,
)
regional_comparison(grav_df_true_density)
[53]:
# re-load the study from the saved pickle file
with pathlib.Path(
f"{true_density_reg_kwargs.get('cv_kwargs').get('fname')}.pickle"
).open("rb") as f:
study = pickle.load(f)
reg_eq_depth = min(study.best_trials, key=lambda t: t.values[0]).params["depth"] # noqa: PD011
reg_eq_damping = None
new_true_density_reg_kwargs = dict(
method="constraints",
grid_method="eq_sources",
constraints_df=constraint_points,
damping=reg_eq_damping,
depth=reg_eq_depth,
block_size=None,
)
reg_eq_depth, reg_eq_damping
[53]:
(209538.1557526367, None)
[54]:
grav_df_true_density
[54]:
| northing | easting | upward | bathymetry_grav | basement_grav_normalized | basement_grav | gravity_anomaly_full_res_no_noise | gravity_anomaly_full_res | uncert | eqs_gravity_anomaly | gravity_anomaly | starting_gravity | true_res | misfit | reg | res | |
|---|---|---|---|---|---|---|---|---|---|---|---|---|---|---|---|---|
| 0 | -1600000.0 | -40000.0 | 1000.0 | -35.551085 | -0.575645 | -36.300394 | -71.851479 | -72.911198 | 3 | -64.481389 | -64.481389 | -35.578561 | -3.009718 | -28.902828 | -29.704963 | 0.802136 |
| 1 | -1600000.0 | -38000.0 | 1000.0 | -36.054683 | -0.523223 | -33.941405 | -69.996088 | -72.483909 | 3 | -64.163085 | -64.163085 | -36.042642 | -3.088852 | -28.120443 | -28.604746 | 0.484303 |
| 2 | -1600000.0 | -36000.0 | 1000.0 | -36.473168 | -0.466365 | -31.382798 | -67.855967 | -68.870245 | 3 | -63.178870 | -63.178870 | -36.460095 | -3.125521 | -26.718775 | -27.043474 | 0.324699 |
| 3 | -1600000.0 | -34000.0 | 1000.0 | -36.755627 | -0.406022 | -28.667352 | -65.422980 | -61.536475 | 3 | -61.636021 | -61.636021 | -36.784649 | -3.111132 | -24.851373 | -25.130963 | 0.279591 |
| 4 | -1600000.0 | -32000.0 | 1000.0 | -36.951045 | -0.343163 | -25.838709 | -62.789754 | -65.528788 | 3 | -59.623519 | -59.623519 | -36.998469 | -3.110982 | -22.625050 | -22.965266 | 0.340216 |
| ... | ... | ... | ... | ... | ... | ... | ... | ... | ... | ... | ... | ... | ... | ... | ... | ... |
| 7671 | -1400000.0 | 102000.0 | 1000.0 | -25.760090 | 0.399167 | 7.566127 | -18.193963 | -19.271274 | 3 | -15.904465 | -15.904465 | -25.498180 | -2.438584 | 9.593715 | 9.315607 | 0.278108 |
| 7672 | -1400000.0 | 104000.0 | 1000.0 | -25.911429 | 0.334798 | 4.669511 | -21.241918 | -24.226858 | 3 | -18.079420 | -18.079420 | -25.673780 | -2.429314 | 7.594360 | 7.339155 | 0.255205 |
| 7673 | -1400000.0 | 106000.0 | 1000.0 | -26.032814 | 0.268741 | 1.696963 | -24.335851 | -19.966292 | 3 | -20.010773 | -20.010773 | -25.808792 | -2.427211 | 5.798019 | 5.556890 | 0.241129 |
| 7674 | -1400000.0 | 108000.0 | 1000.0 | -26.121903 | 0.201716 | -1.319170 | -27.441073 | -21.510609 | 3 | -21.483911 | -21.483911 | -25.904533 | -2.428732 | 4.420623 | 4.104041 | 0.316582 |
| 7675 | -1400000.0 | 110000.0 | 1000.0 | -26.206160 | 0.134418 | -4.347560 | -30.553720 | -34.929273 | 3 | -22.365574 | -22.365574 | -25.981733 | -2.442381 | 3.616158 | 3.141822 | 0.474336 |
7676 rows × 16 columns
[55]:
regional_misfit_parameter_dict = {
"depth": {
"distribution": "normal",
"loc": reg_eq_depth, # mean
"scale": reg_eq_depth / 4, # standard deviation
},
}
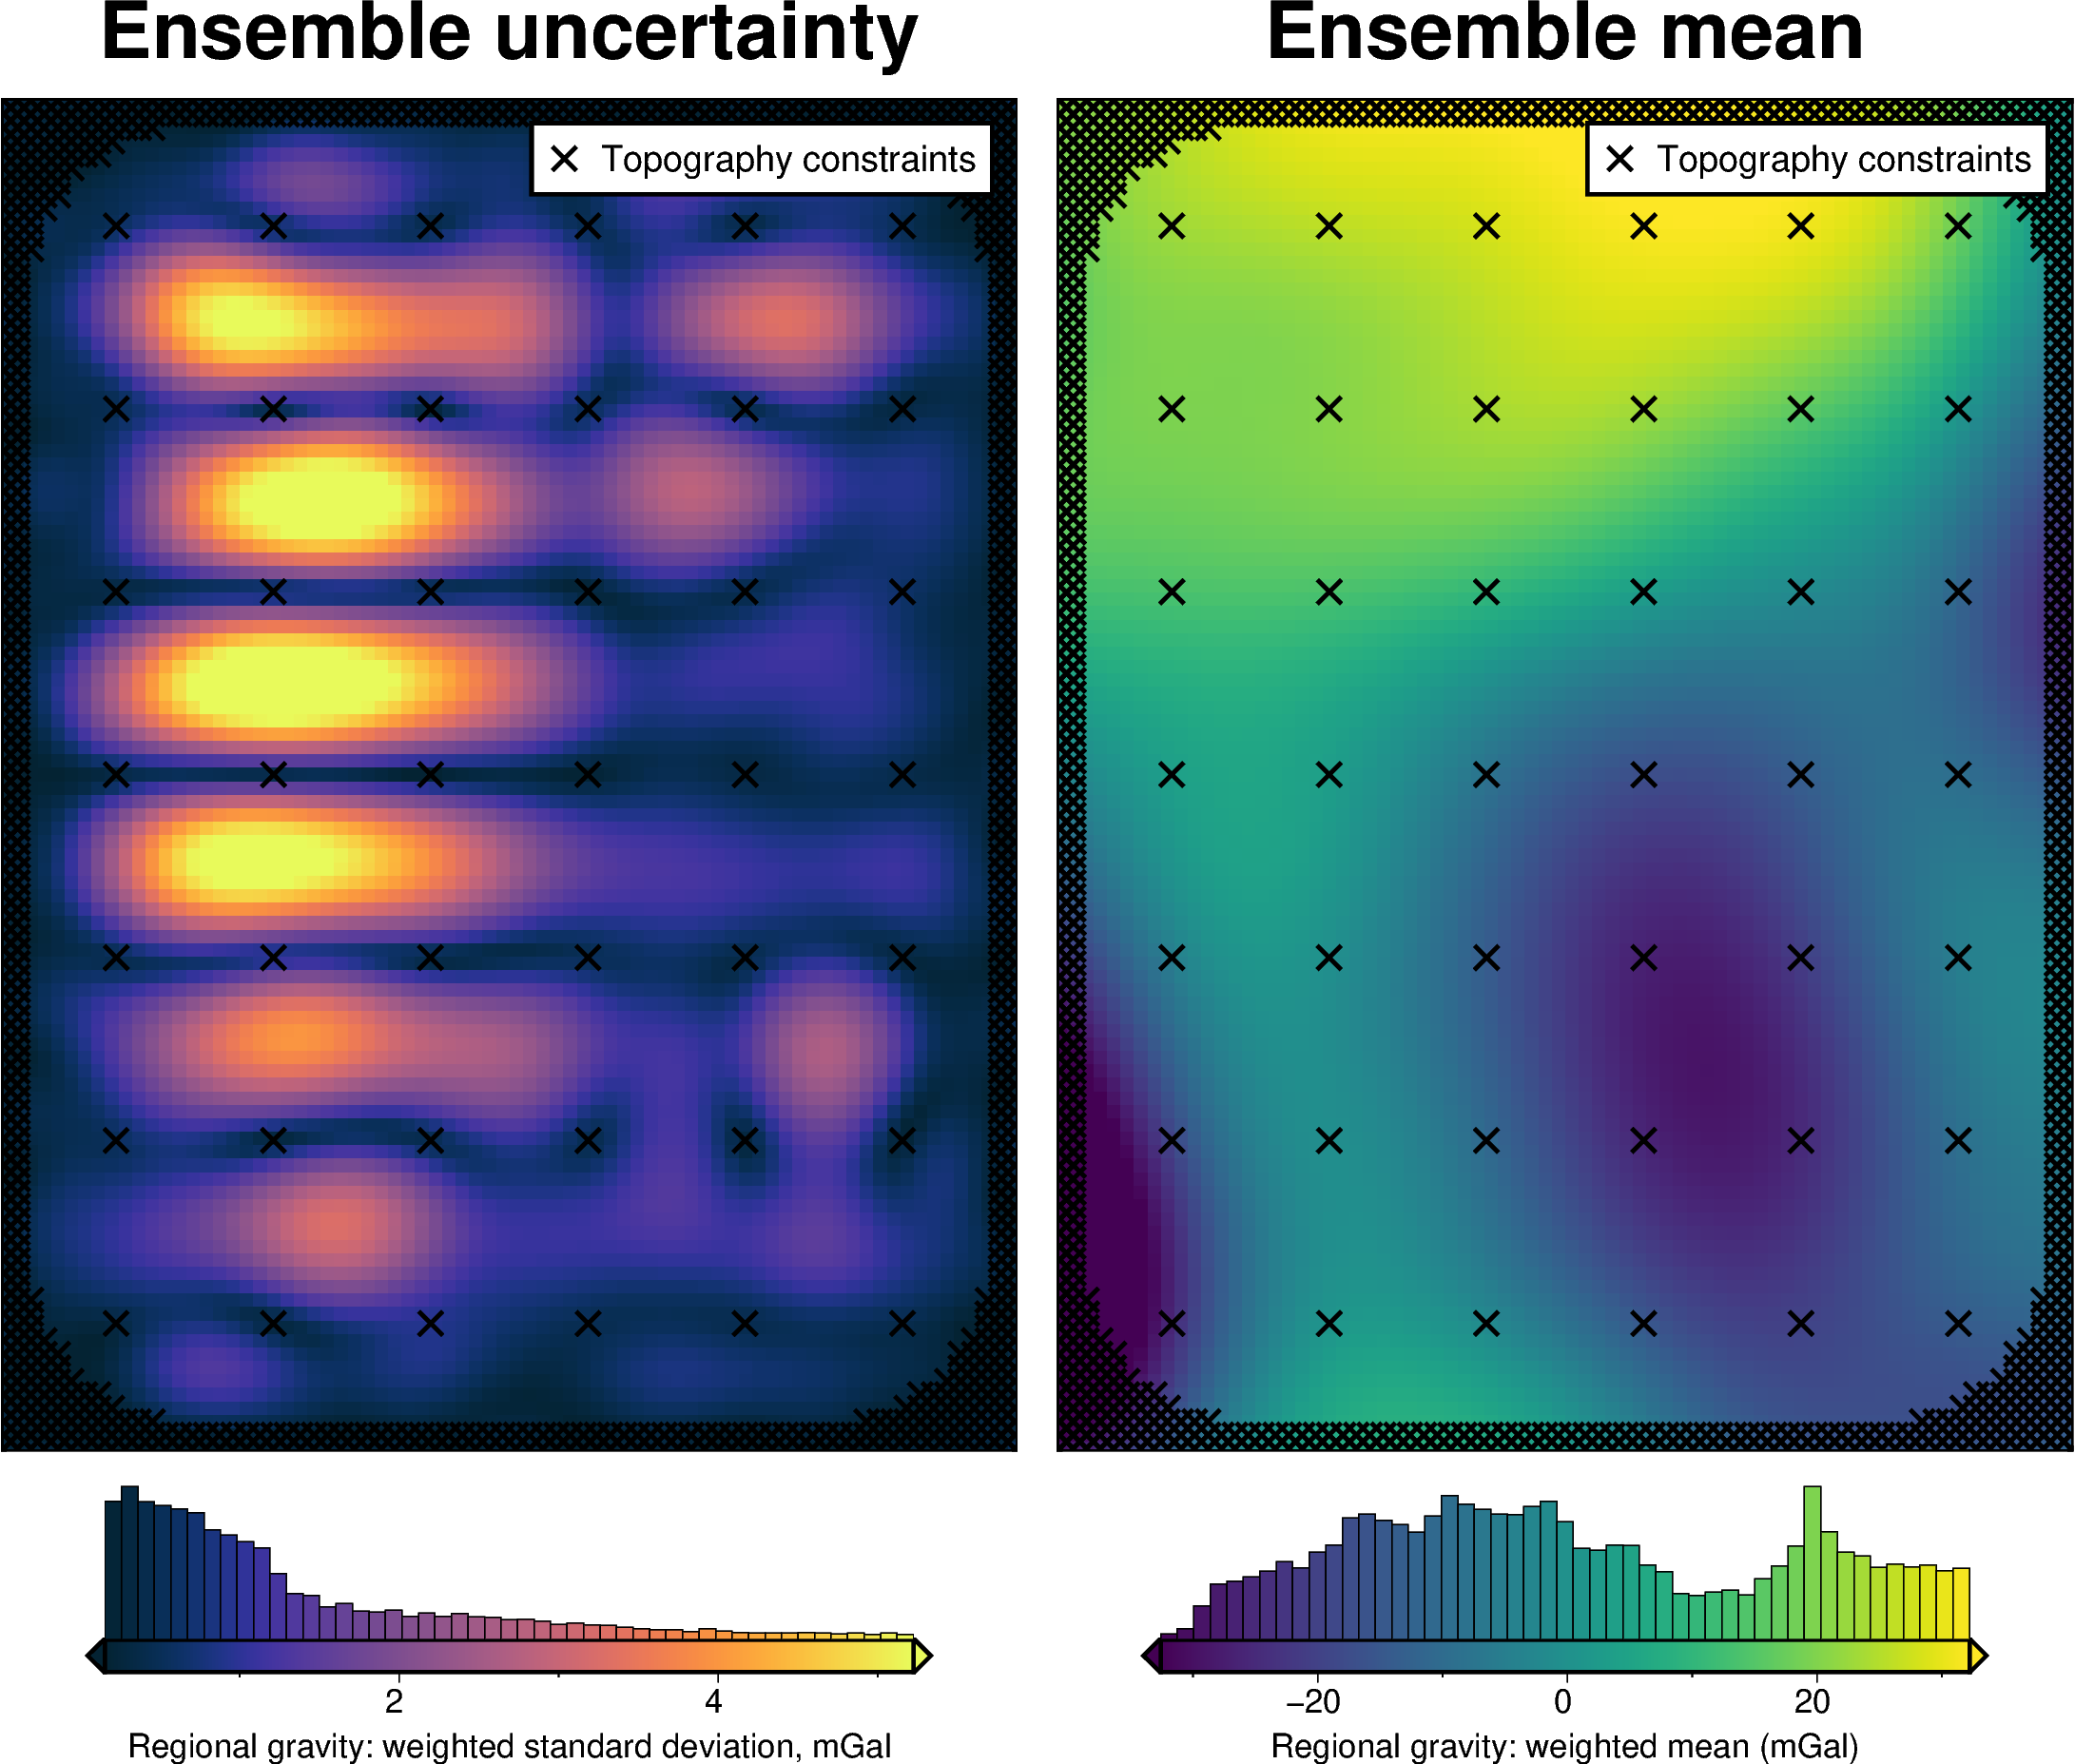
regional_misfit_stats, _ = uncertainty.regional_misfit_uncertainty(
runs=20,
parameter_dict=regional_misfit_parameter_dict,
plot_region=inversion_region,
true_regional=grav_df_true_density.set_index(["northing", "easting"])
.to_xarray()
.basement_grav,
weight_by="constraints",
grav_df=grav_df_true_density,
**new_true_density_reg_kwargs,
)
[56]:
regional_misfit_stats
[56]:
<xarray.Dataset> Size: 2MB
Dimensions: (northing: 101, easting: 76, runs: 20)
Coordinates:
* northing (northing) float64 808B -1.6e+06 -1.598e+06 ... -1.4e+06
* easting (easting) float64 608B -4e+04 -3.8e+04 ... 1.08e+05 1.1e+05
* runs (runs) <U6 480B 'run_0' 'run_1' ... 'run_18' 'run_19'
Data variables:
run_num (runs, northing, easting) float64 1MB -29.34 ... 2.249
z_mean (northing, easting) float64 61kB -29.32 -28.24 ... 3.258
z_stdev (northing, easting) float64 61kB 0.314 0.2289 ... 0.5696
weighted_mean (northing, easting) float64 61kB -29.32 -28.24 ... 3.258
weighted_stdev (northing, easting) float64 61kB 0.314 0.2288 ... 0.5697
z_min (northing, easting) float64 61kB -29.85 -28.59 ... 2.107
z_max (northing, easting) float64 61kB -28.69 -27.82 ... 4.165[57]:
grav_grid = grav_df_true_density.set_index(["northing", "easting"]).to_xarray()
grav_grid["reg_uncert"] = regional_misfit_stats.z_stdev
grav_df_true_density = vd.grid_to_table(grav_grid)
grav_df_true_density
[57]:
| northing | easting | upward | bathymetry_grav | basement_grav_normalized | basement_grav | gravity_anomaly_full_res_no_noise | gravity_anomaly_full_res | uncert | eqs_gravity_anomaly | gravity_anomaly | starting_gravity | true_res | misfit | reg | res | reg_uncert | |
|---|---|---|---|---|---|---|---|---|---|---|---|---|---|---|---|---|---|
| 0 | -1600000.0 | -40000.0 | 1000.0 | -35.551085 | -0.575645 | -36.300394 | -71.851479 | -72.911198 | 3 | -64.481389 | -64.481389 | -35.578561 | -3.009718 | -28.902828 | -29.704963 | 0.802136 | 0.314038 |
| 1 | -1600000.0 | -38000.0 | 1000.0 | -36.054683 | -0.523223 | -33.941405 | -69.996088 | -72.483909 | 3 | -64.163085 | -64.163085 | -36.042642 | -3.088852 | -28.120443 | -28.604746 | 0.484303 | 0.228852 |
| 2 | -1600000.0 | -36000.0 | 1000.0 | -36.473168 | -0.466365 | -31.382798 | -67.855967 | -68.870245 | 3 | -63.178870 | -63.178870 | -36.460095 | -3.125521 | -26.718775 | -27.043474 | 0.324699 | 0.287741 |
| 3 | -1600000.0 | -34000.0 | 1000.0 | -36.755627 | -0.406022 | -28.667352 | -65.422980 | -61.536475 | 3 | -61.636021 | -61.636021 | -36.784649 | -3.111132 | -24.851373 | -25.130963 | 0.279591 | 0.298262 |
| 4 | -1600000.0 | -32000.0 | 1000.0 | -36.951045 | -0.343163 | -25.838709 | -62.789754 | -65.528788 | 3 | -59.623519 | -59.623519 | -36.998469 | -3.110982 | -22.625050 | -22.965266 | 0.340216 | 0.269691 |
| ... | ... | ... | ... | ... | ... | ... | ... | ... | ... | ... | ... | ... | ... | ... | ... | ... | ... |
| 7671 | -1400000.0 | 102000.0 | 1000.0 | -25.760090 | 0.399167 | 7.566127 | -18.193963 | -19.271274 | 3 | -15.904465 | -15.904465 | -25.498180 | -2.438584 | 9.593715 | 9.315607 | 0.278108 | 0.144604 |
| 7672 | -1400000.0 | 104000.0 | 1000.0 | -25.911429 | 0.334798 | 4.669511 | -21.241918 | -24.226858 | 3 | -18.079420 | -18.079420 | -25.673780 | -2.429314 | 7.594360 | 7.339155 | 0.255205 | 0.170456 |
| 7673 | -1400000.0 | 106000.0 | 1000.0 | -26.032814 | 0.268741 | 1.696963 | -24.335851 | -19.966292 | 3 | -20.010773 | -20.010773 | -25.808792 | -2.427211 | 5.798019 | 5.556890 | 0.241129 | 0.176501 |
| 7674 | -1400000.0 | 108000.0 | 1000.0 | -26.121903 | 0.201716 | -1.319170 | -27.441073 | -21.510609 | 3 | -21.483911 | -21.483911 | -25.904533 | -2.428732 | 4.420623 | 4.104041 | 0.316582 | 0.240133 |
| 7675 | -1400000.0 | 110000.0 | 1000.0 | -26.206160 | 0.134418 | -4.347560 | -30.553720 | -34.929273 | 3 | -22.365574 | -22.365574 | -25.981733 | -2.442381 | 3.616158 | 3.141822 | 0.474336 | 0.569622 |
7676 rows × 17 columns
[58]:
grav_df_true_density.to_csv(f"{fpath}_grav_df_true_density.csv", index=False)
Uncertainty analysis
Inversion error
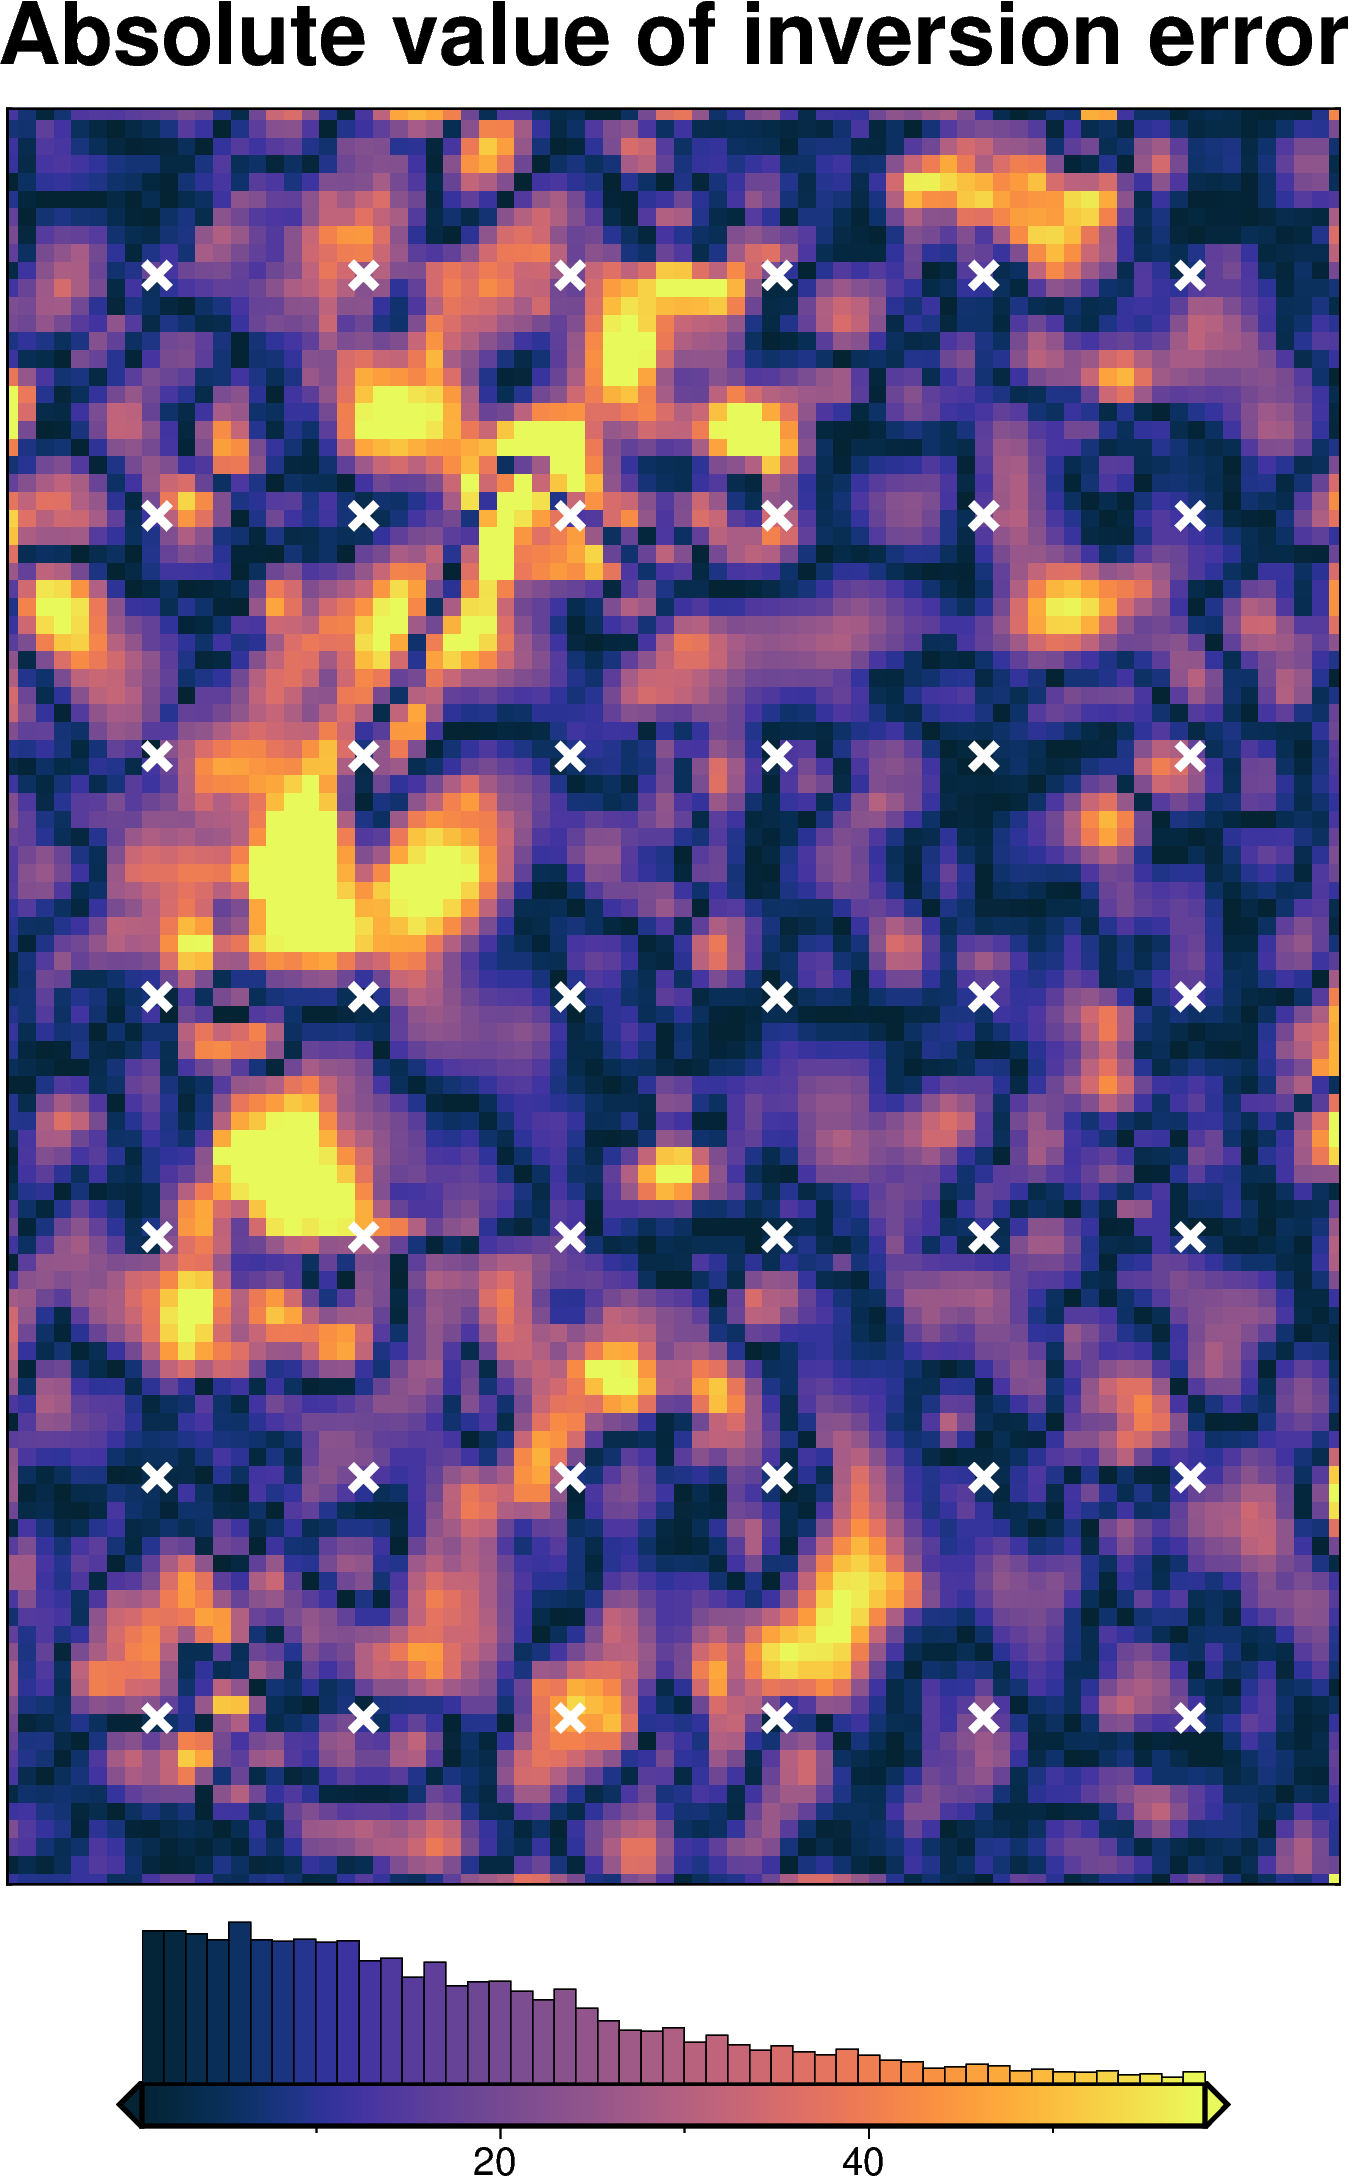
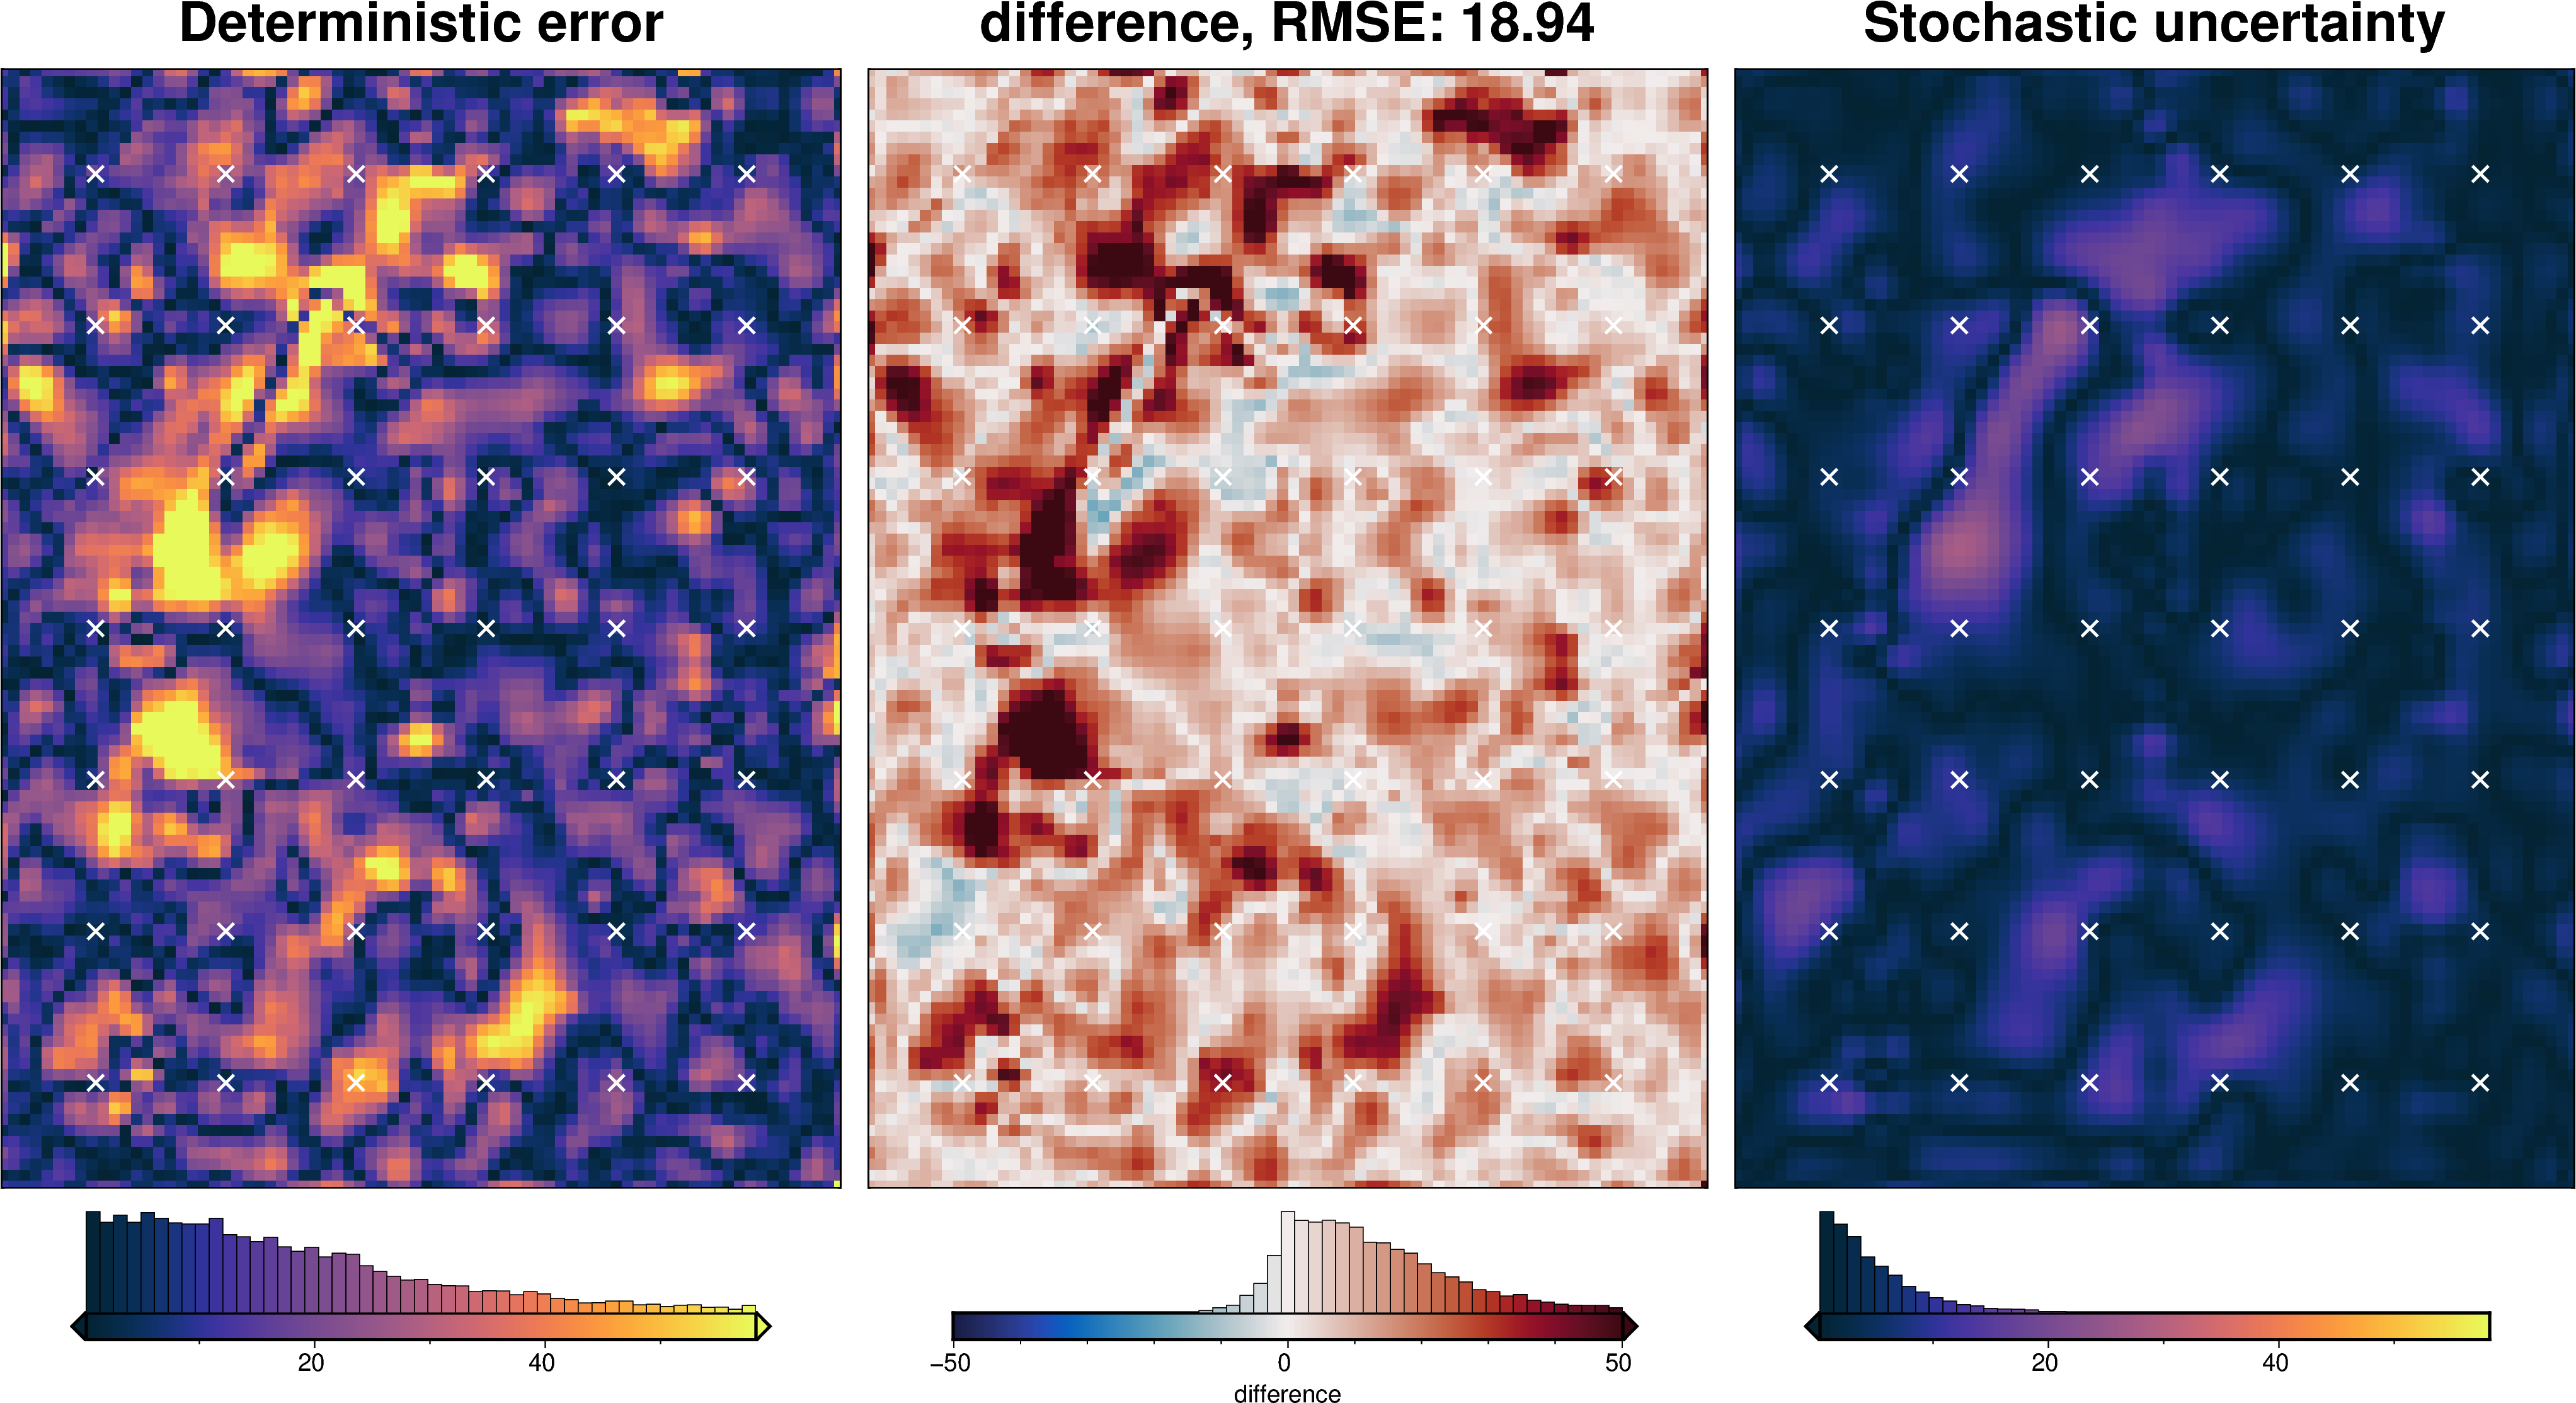
[59]:
inversion_error = np.abs(bathymetry - final_topography)
fig = maps.plot_grd(
inversion_error,
region=inversion_region,
hist=True,
cmap="thermal",
title="Absolute value of inversion error",
robust=True,
points=constraint_points[constraint_points.inside],
points_style="x.3c",
points_fill="white",
points_pen="2p",
)
fig.show()
[60]:
# re-load the study from the saved pickle file
with pathlib.Path(f"{regional_grav_kwargs.get('cv_kwargs').get('fname')}.pickle").open(
"rb"
) as f:
study = pickle.load(f)
reg_eq_depth = min(study.best_trials, key=lambda t: t.values[0]).params["depth"] # noqa: PD011
reg_eq_damping = None
new_regional_grav_kwargs = dict(
method="constraints",
grid_method="eq_sources",
constraints_df=constraint_points,
damping=reg_eq_damping,
depth=reg_eq_depth,
block_size=None,
)
reg_eq_depth, reg_eq_damping
[60]:
(272567.6395660266, None)
[61]:
# kwargs to reuse for all uncertainty analyses
uncert_kwargs = dict(
grav_df=grav_df,
density_contrast=best_density_contrast,
zref=zref,
starting_prisms=starting_prisms,
starting_topography=starting_bathymetry,
regional_grav_kwargs=new_regional_grav_kwargs,
**kwargs,
)
Solver damping component
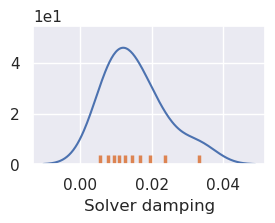
[62]:
# load study
with pathlib.Path(f"{fpath}_damping_cv_damping_cv_study.pickle").open("rb") as f:
study = pickle.load(f)
study_df = study.trials_dataframe().drop(columns=["user_attrs_results"])
study_df = study_df.sort_values("value")
# calculate zscores of values
study_df["value_zscore"] = sp.stats.zscore(study_df["value"])
# drop outliers (values with zscore > |2|)
study_df2 = study_df[(np.abs(study_df.value_zscore) < 2)]
# pick damping standard deviation based on optimization
# to have a normal distribution a log scale, use the stdev of the log of the values
stdev = np.log10(study_df2.params_damping).std()
print(f"calculated stdev: {stdev}")
stdev = stdev / 2
print(f"using stdev: {stdev}")
calculated stdev: 0.47543893517832486
using stdev: 0.23771946758916243
[63]:
fig = plotting.plot_cv_scores(
study_df.value,
study_df.params_damping,
param_name="Damping",
logx=True,
logy=True,
)
ax = fig.axes[0]
y_lims = ax.get_ylim()
# plot the best value
best = float(study_df2.params_damping.iloc[0])
ax.vlines(best, ymin=y_lims[0], ymax=y_lims[1], color="r")
# for a log scale, use the log of the best value, stdev already in log scale
upper = float(10 ** (np.log10(best) + stdev))
lower = float(10 ** (np.log10(best) - stdev))
ax.vlines(upper, ymin=y_lims[0], ymax=y_lims[1], label="+/- std")
ax.vlines(lower, ymin=y_lims[0], ymax=y_lims[1])
x_lims = ax.get_xlim()
ax.set_xlim(
min(x_lims[0], lower),
max(x_lims[1], upper),
)
ax.legend()
print("best:", best, "\nstd:", stdev, "\n+1std:", upper, "\n-1std:", lower)
best: 0.013422413235354692
std: 0.23771946758916243
+1std: 0.023203316976077755
-1std: 0.007764457868087053

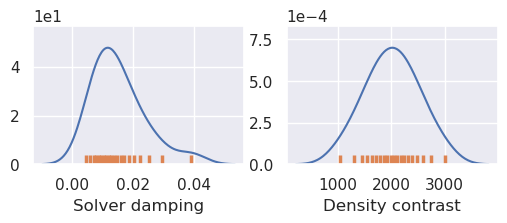
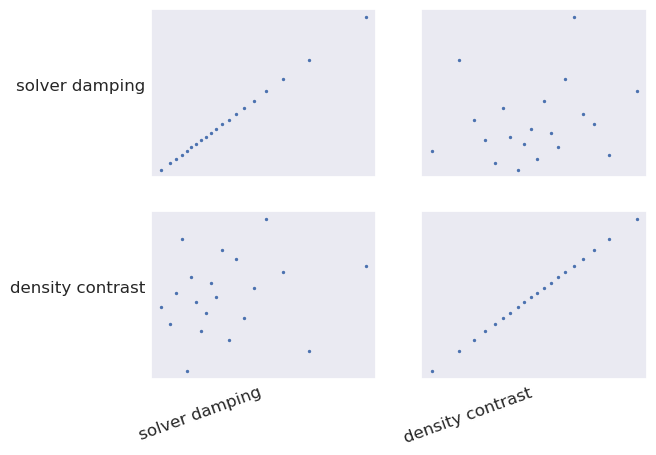
[64]:
solver_dict = {
"solver_damping": {
"distribution": "normal",
"loc": np.log10(
best_damping
), # mean of base 10 exponent, supply log10(value) here
"scale": stdev, # stdev of base 10 exponent, already in log10 form
"log": True,
},
}
fname = f"{fpath}_uncertainty_damping"
# delete files if already exist
for p in pathlib.Path().glob(f"{fname}*"):
p.unlink(missing_ok=True)
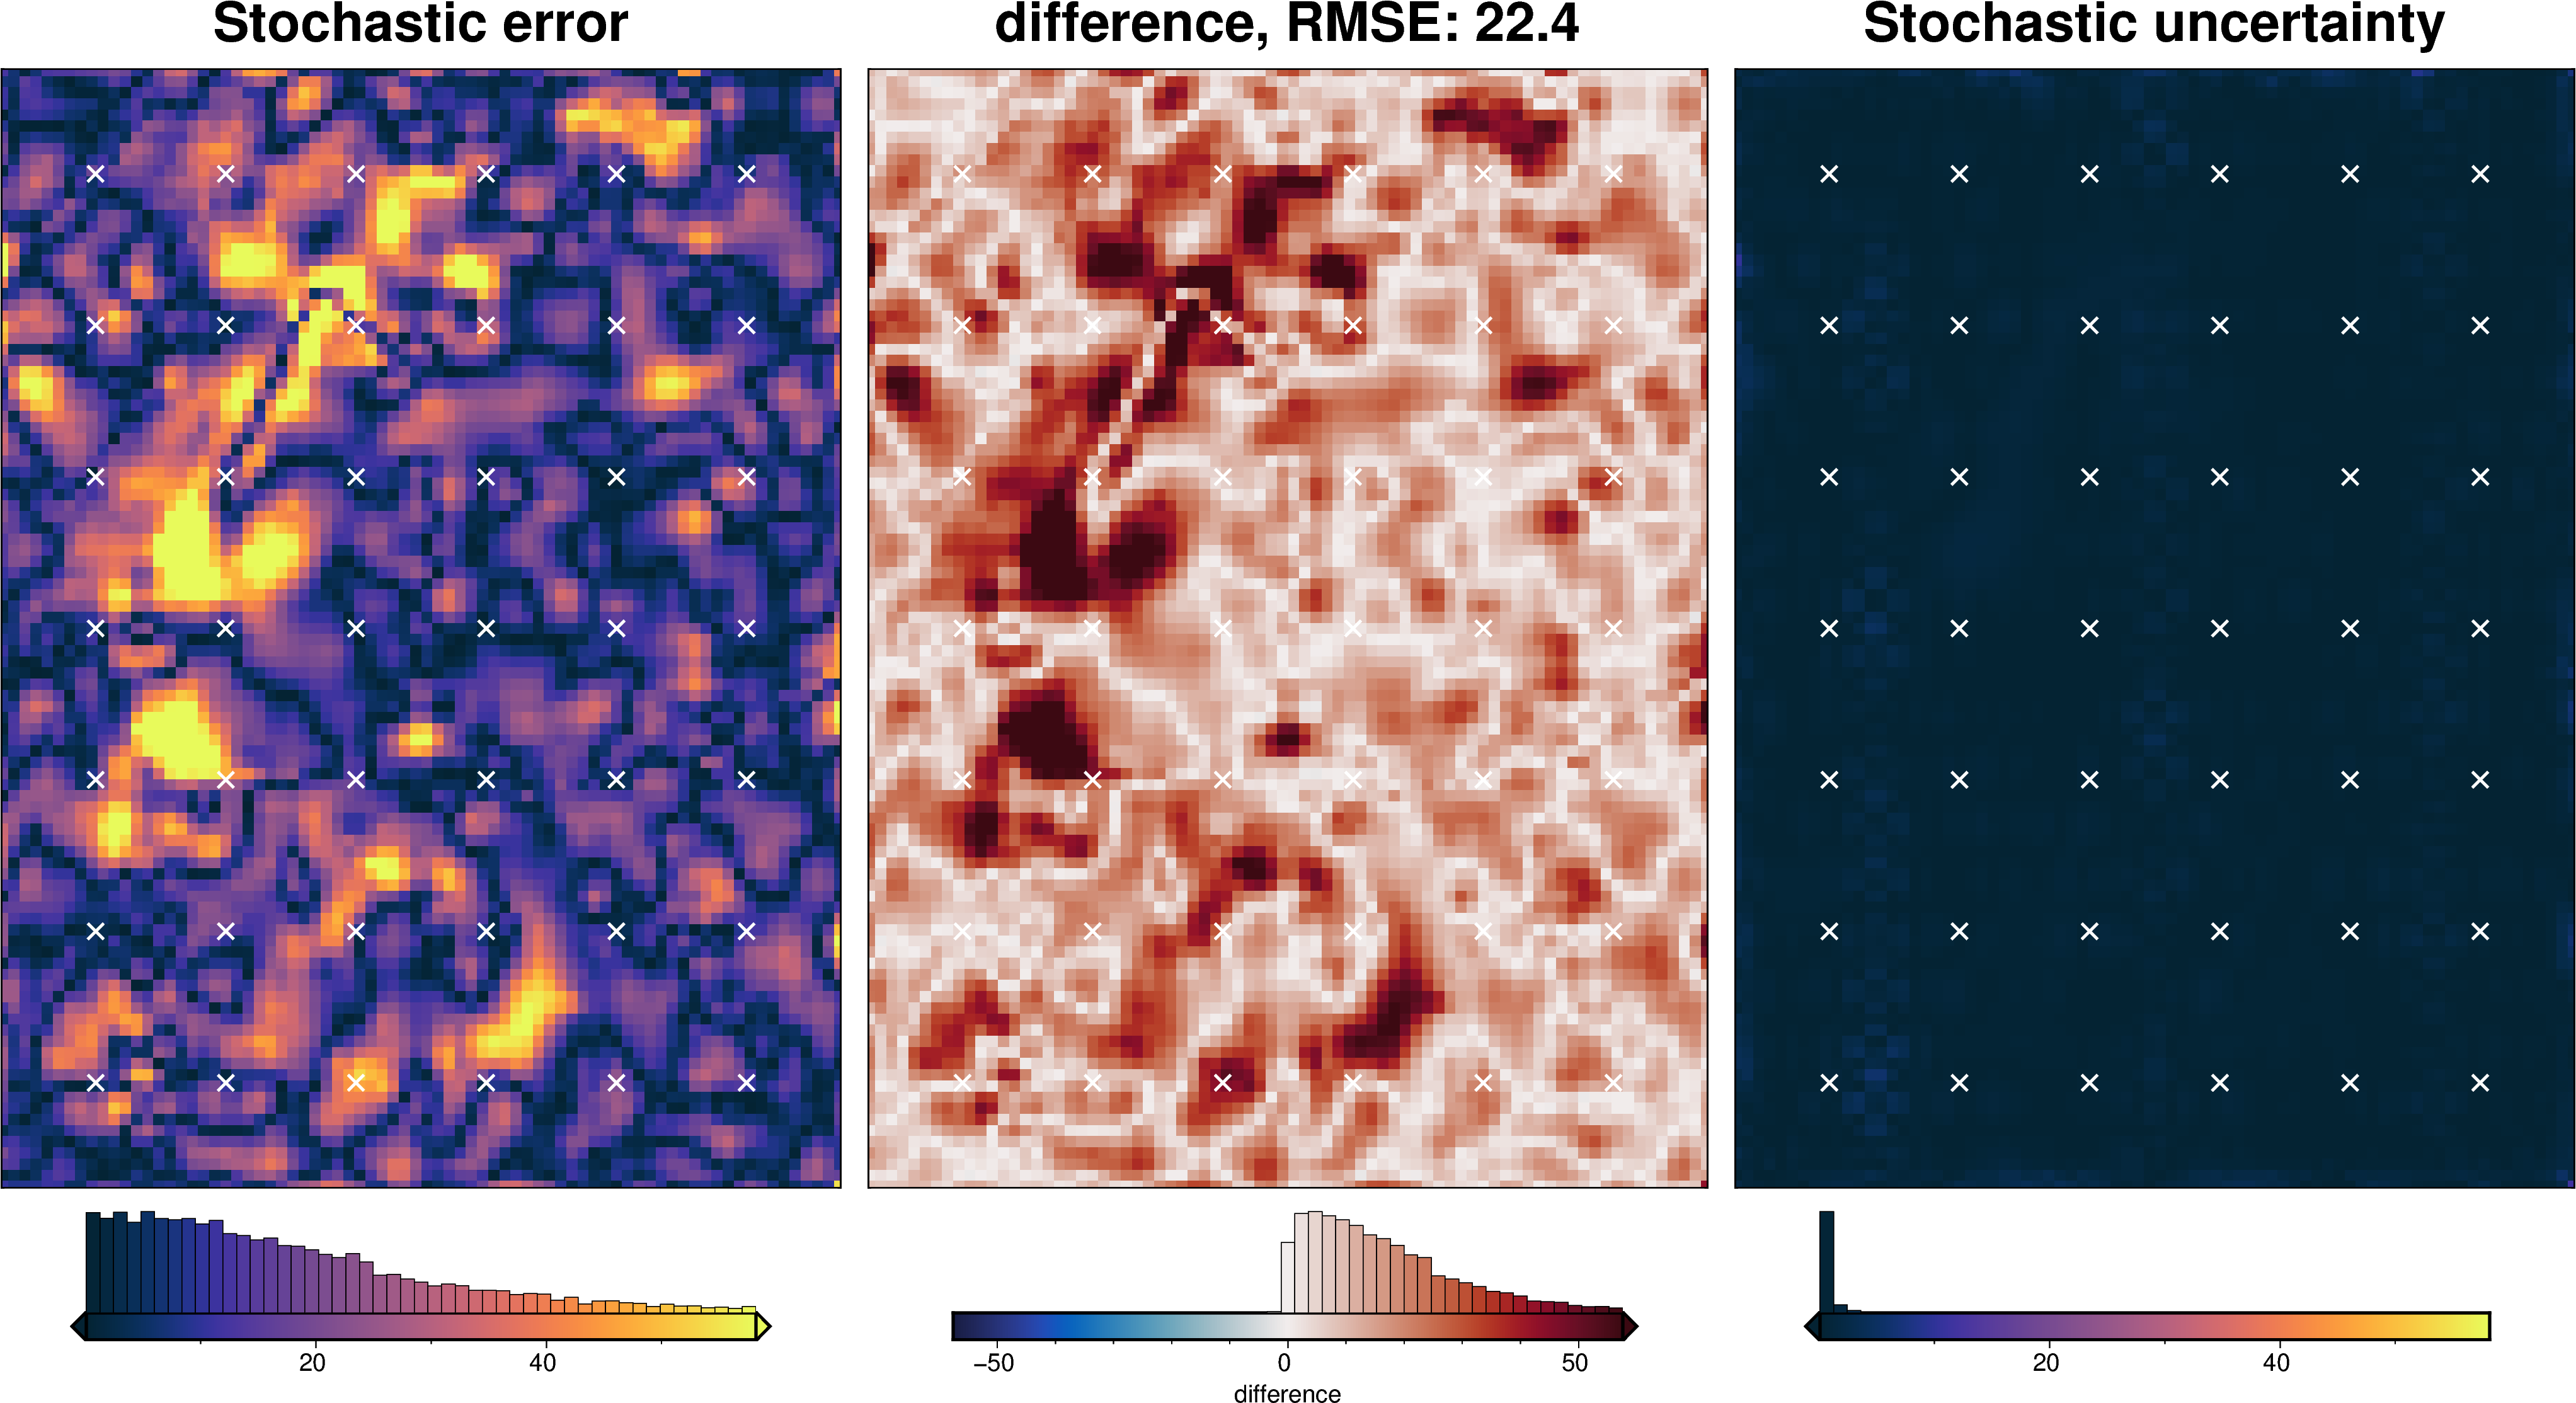
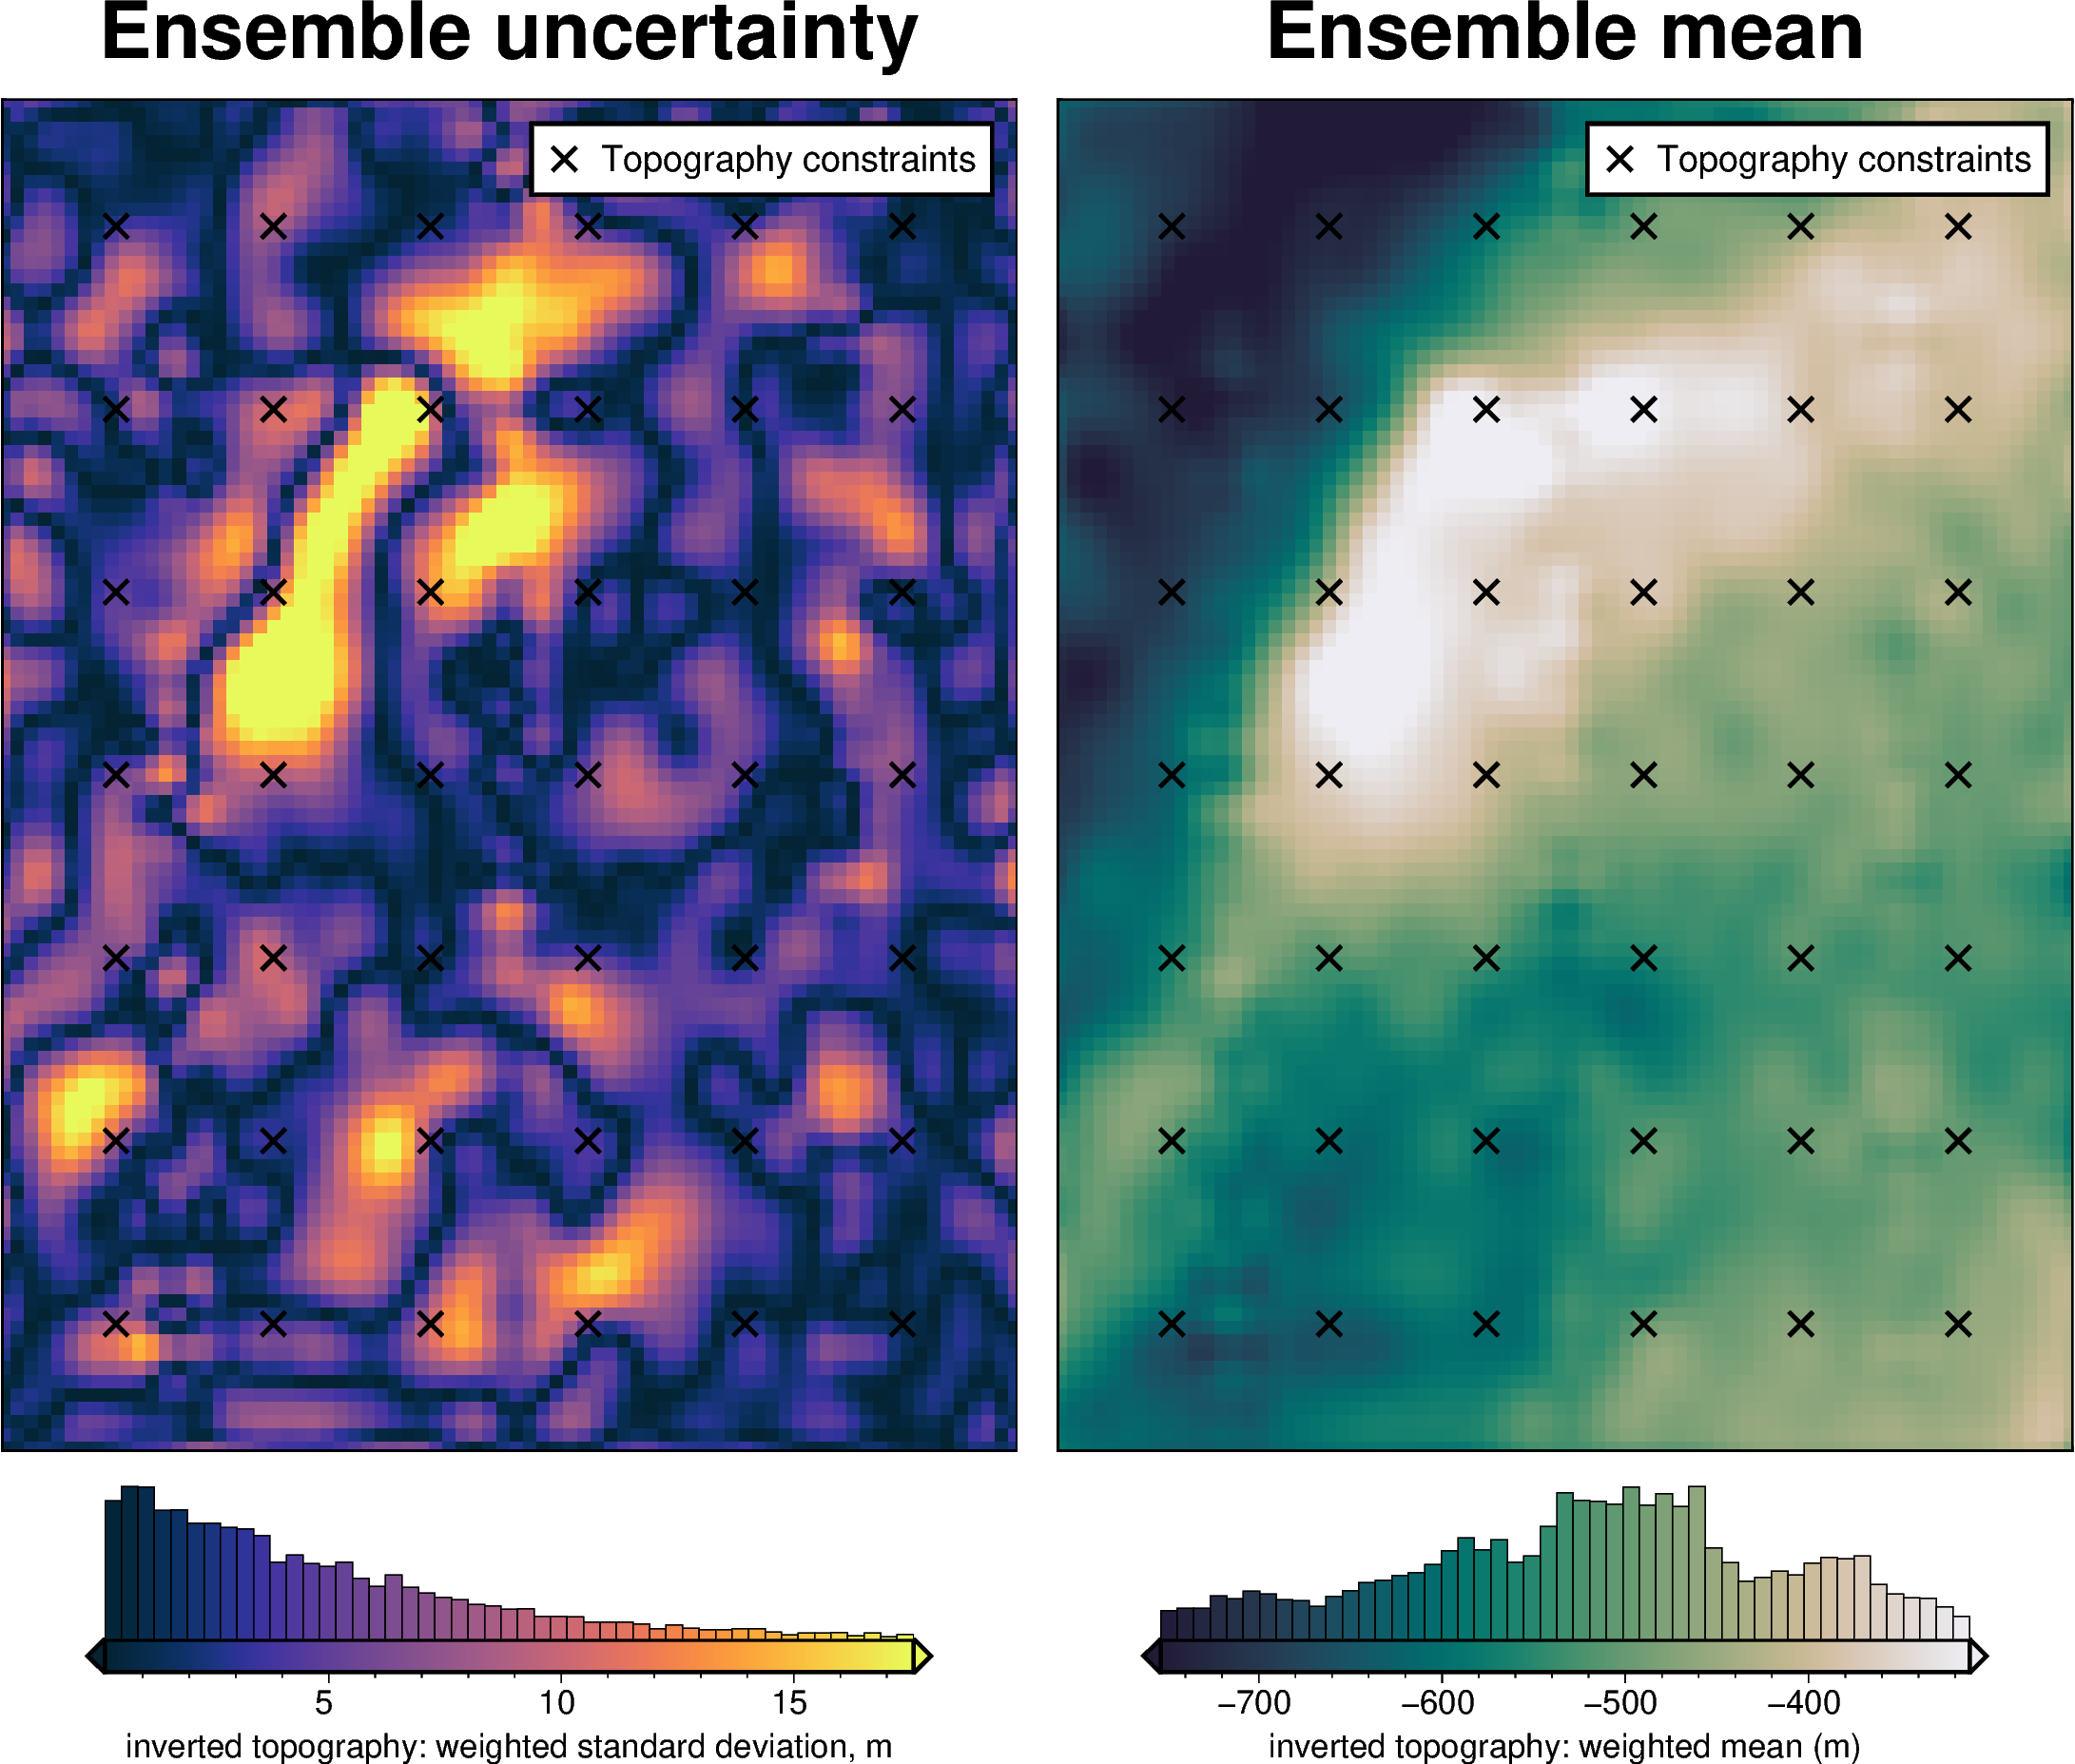
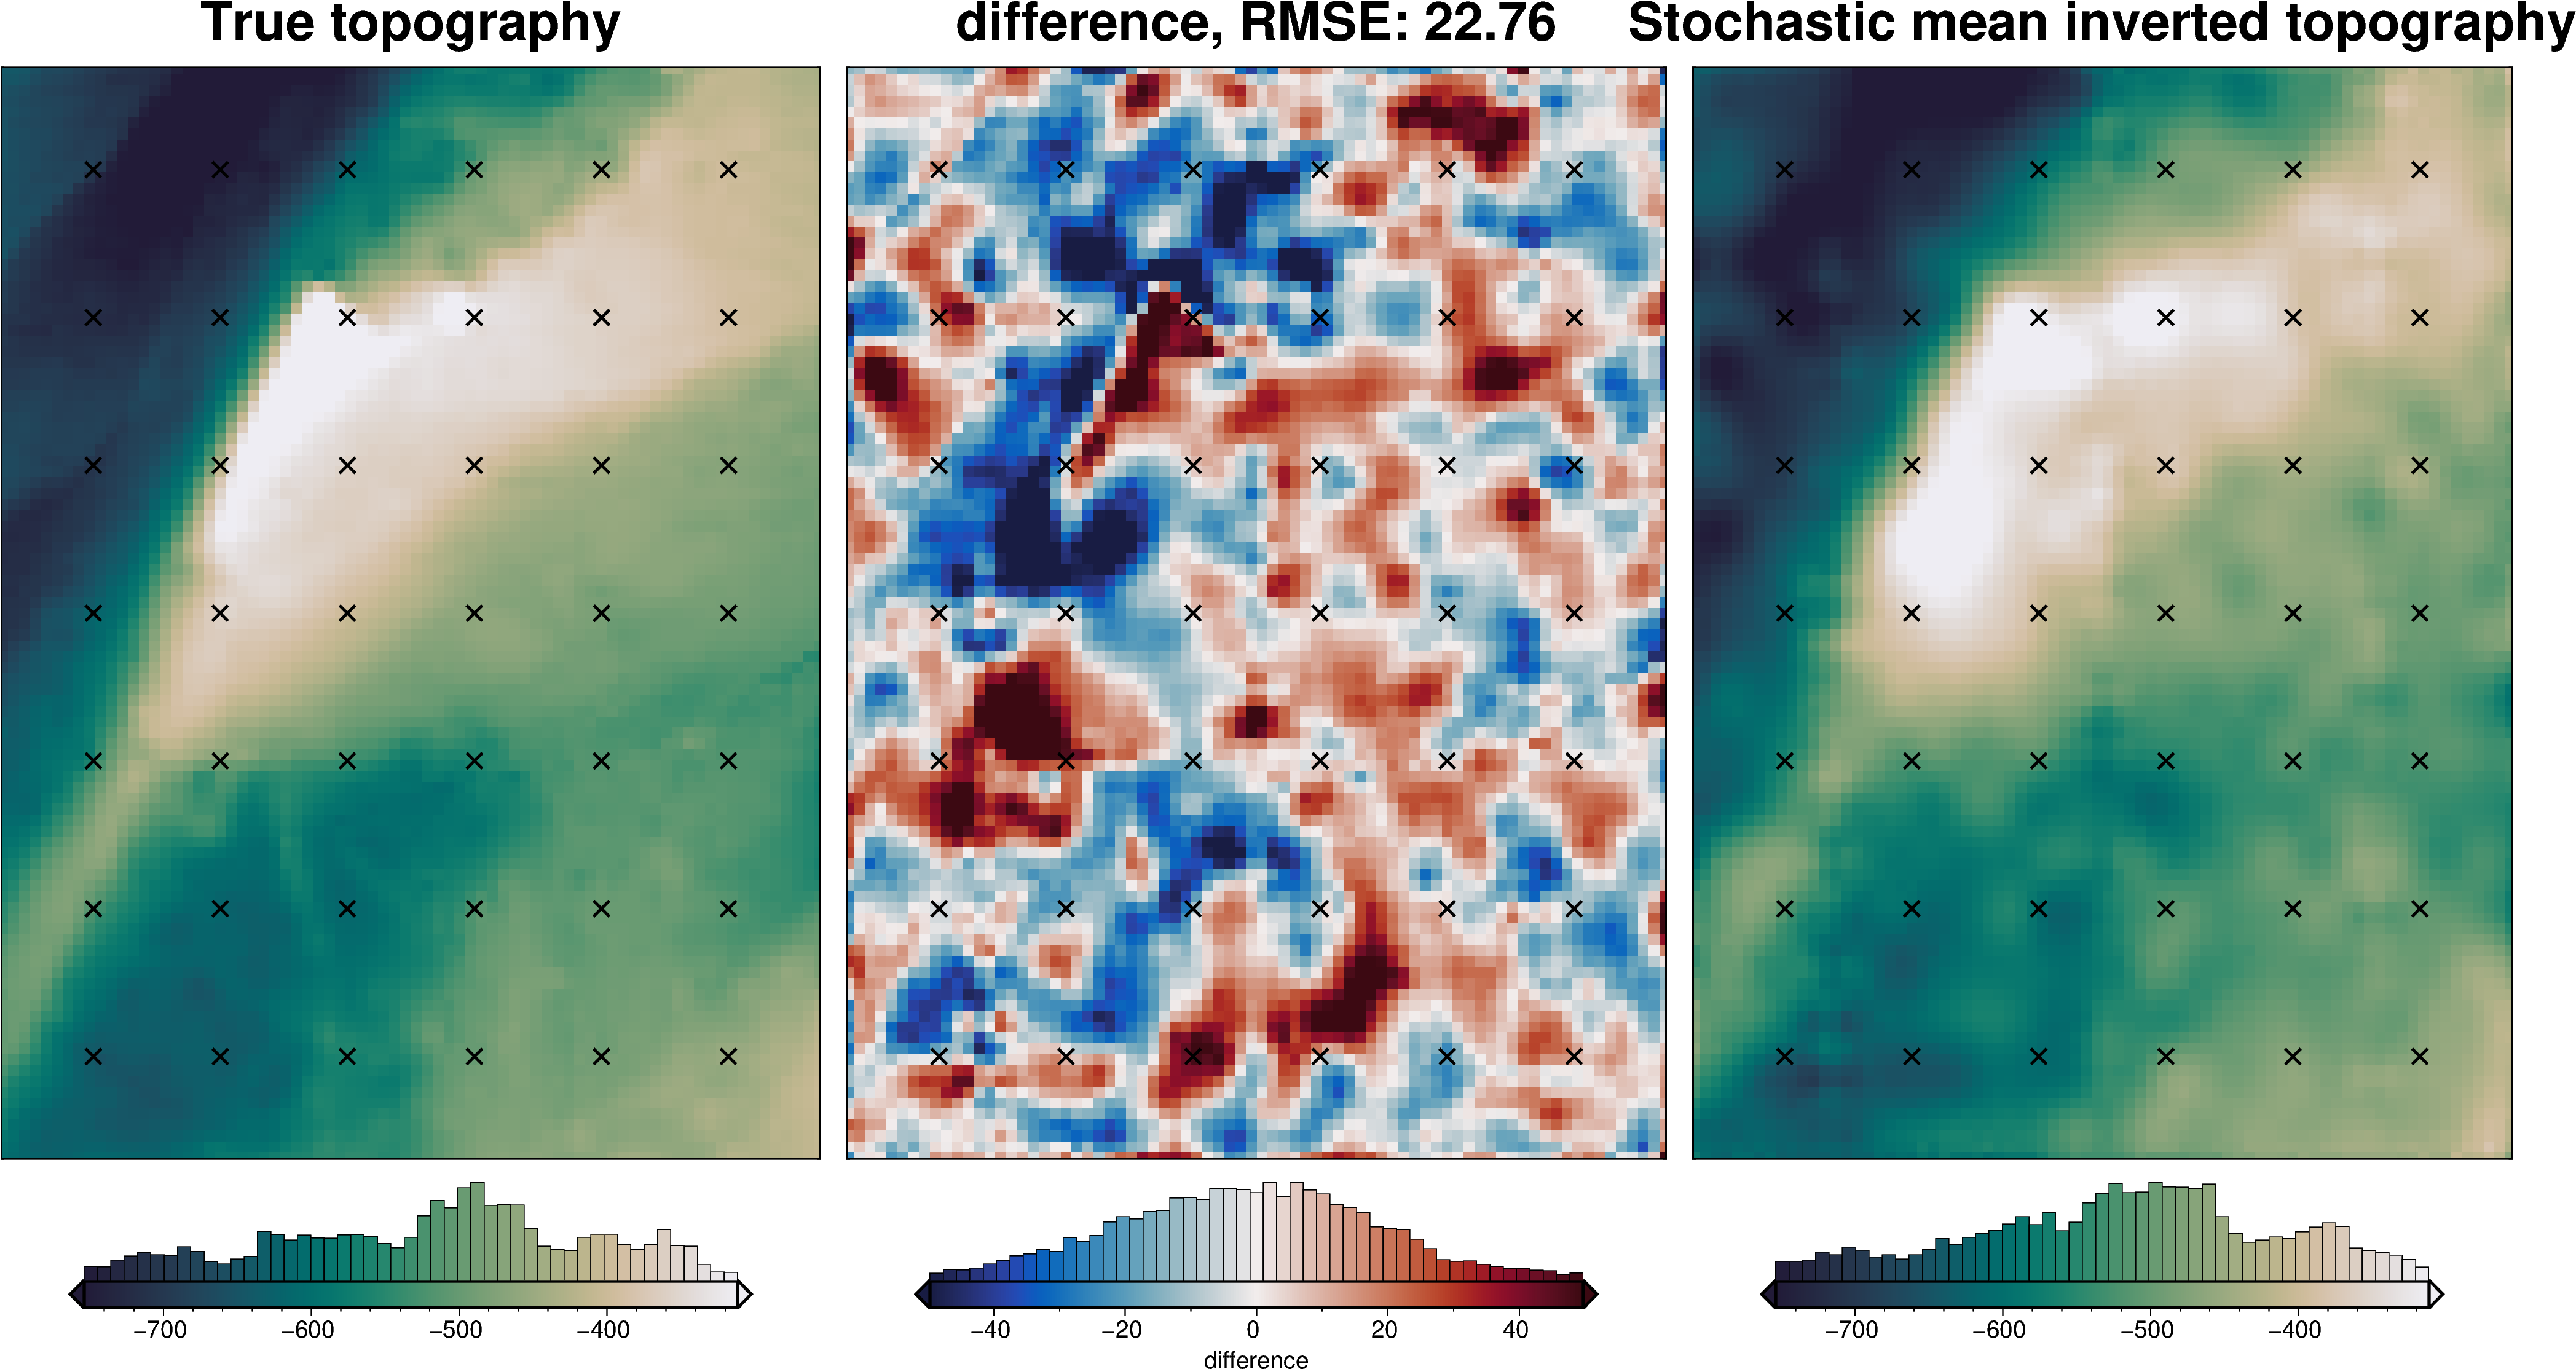
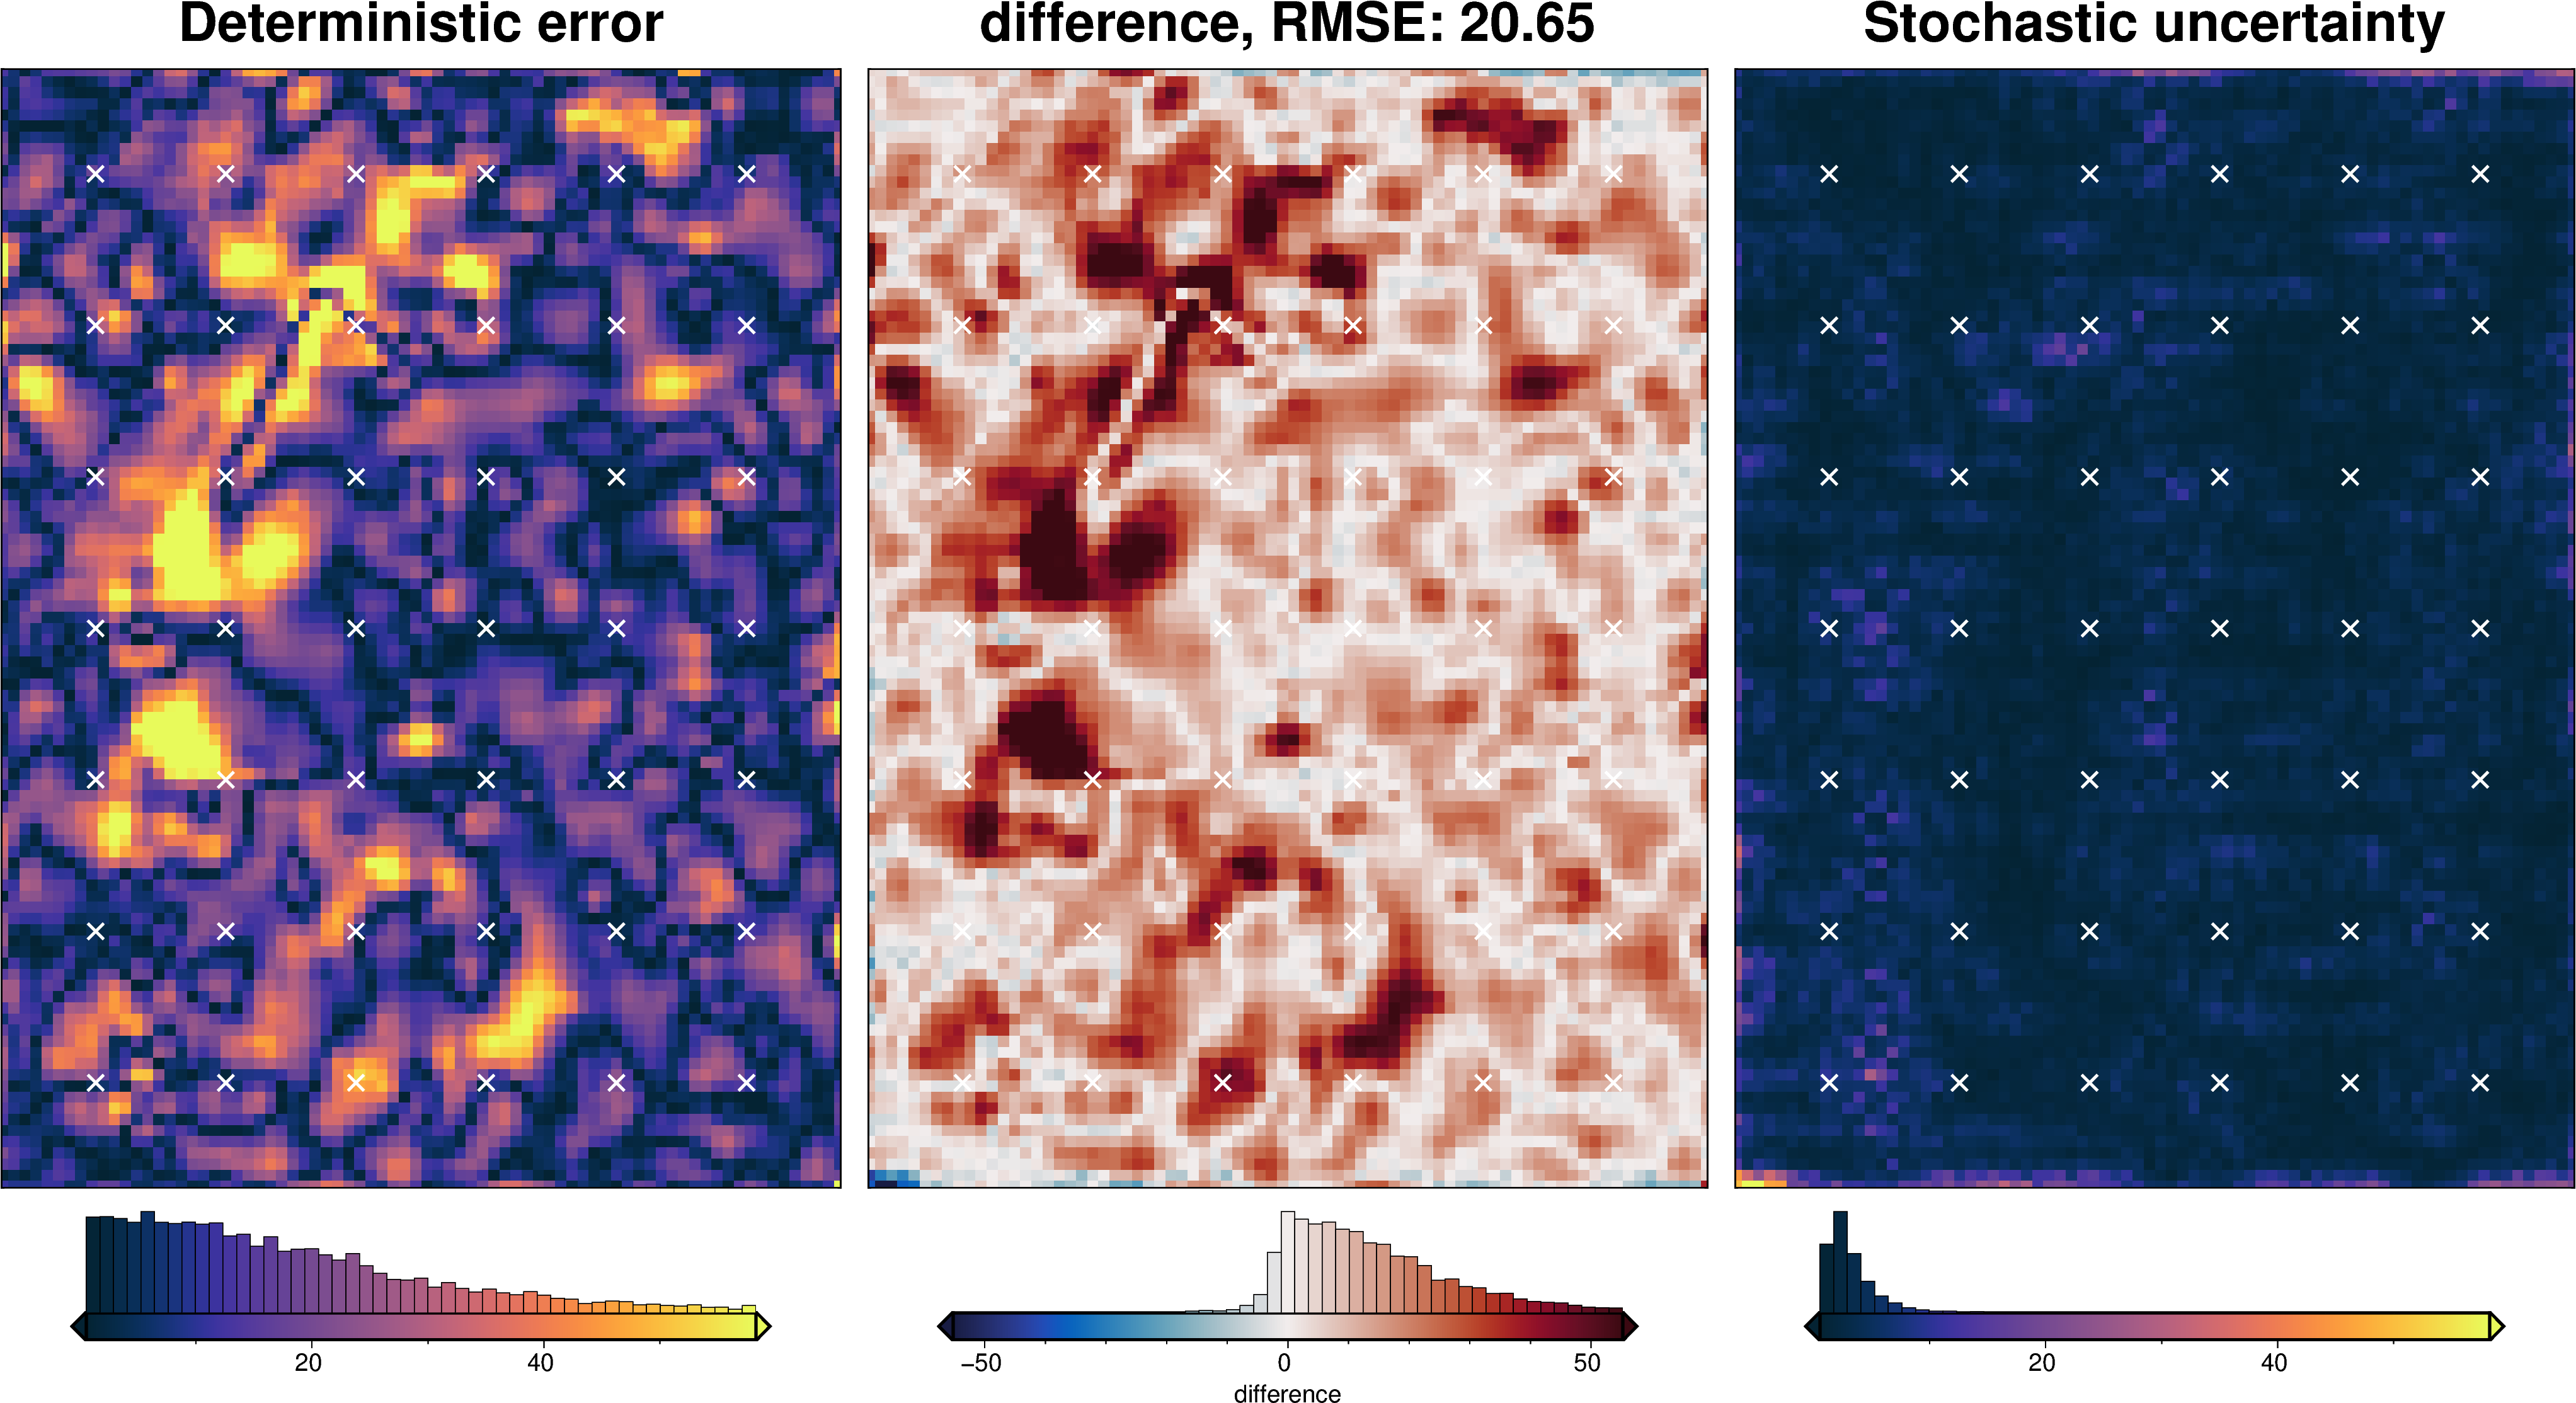
uncert_damping_results = uncertainty.full_workflow_uncertainty_loop(
fname=fname,
runs=10,
parameter_dict=solver_dict,
**uncert_kwargs,
)
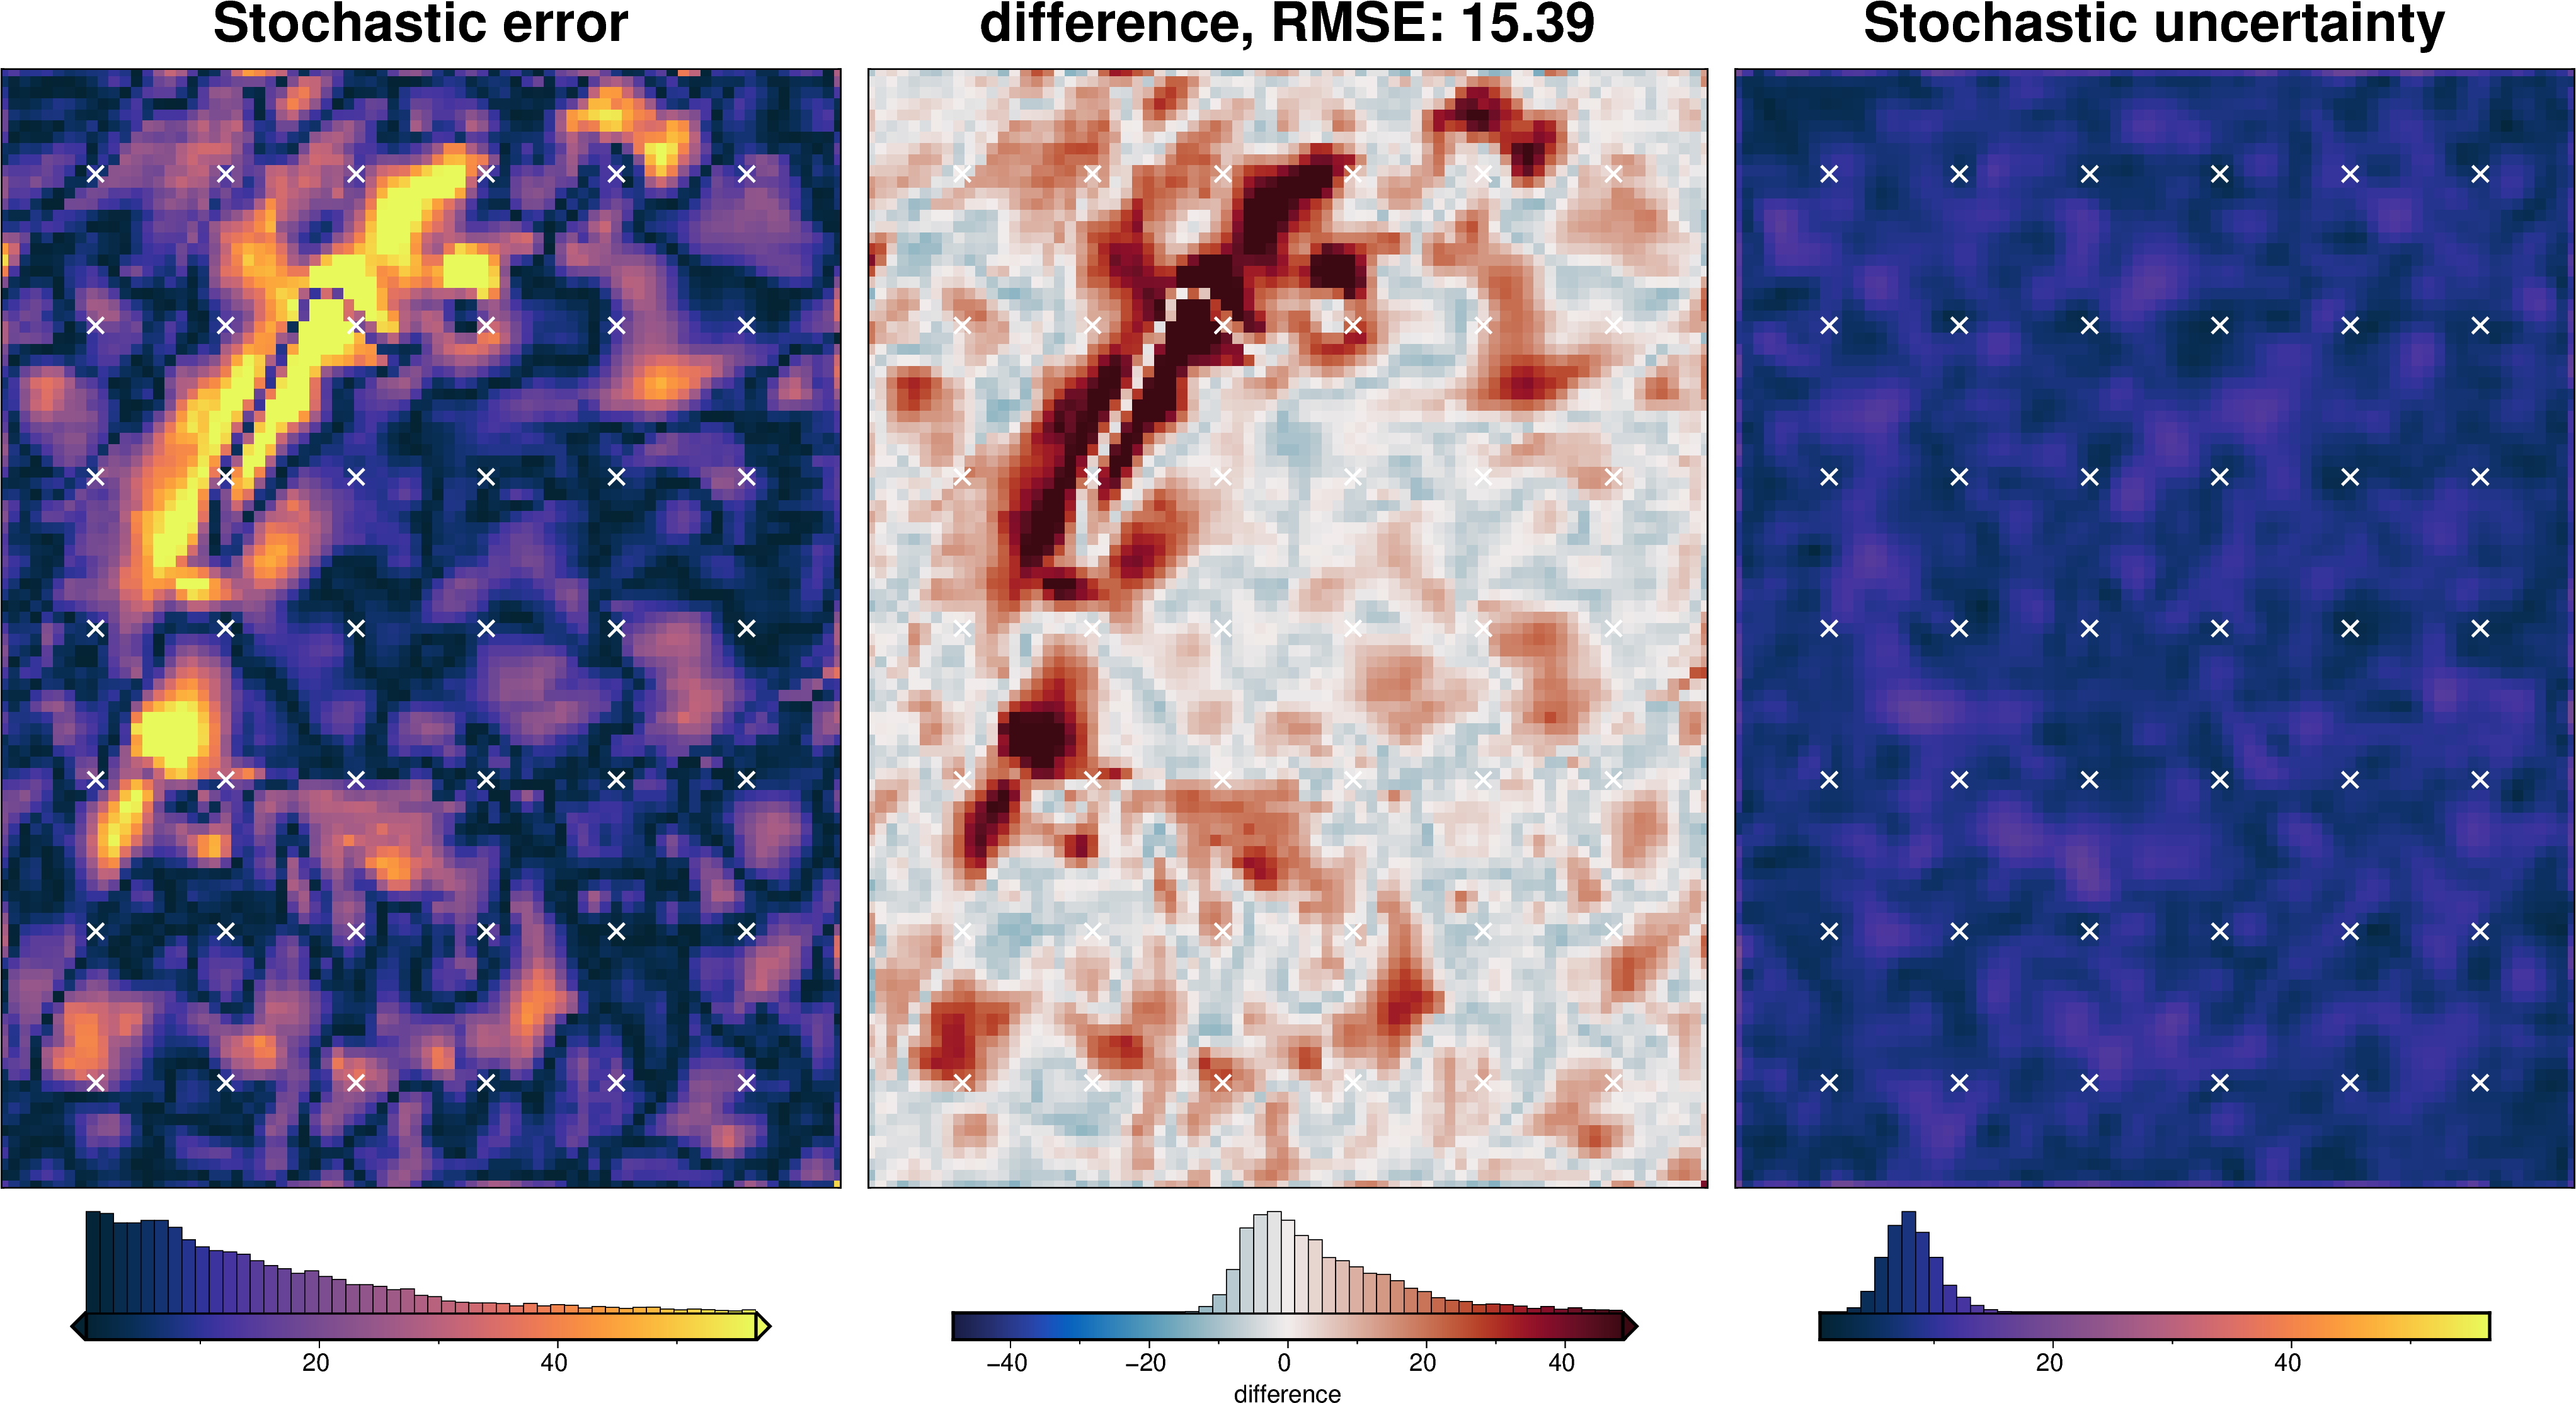
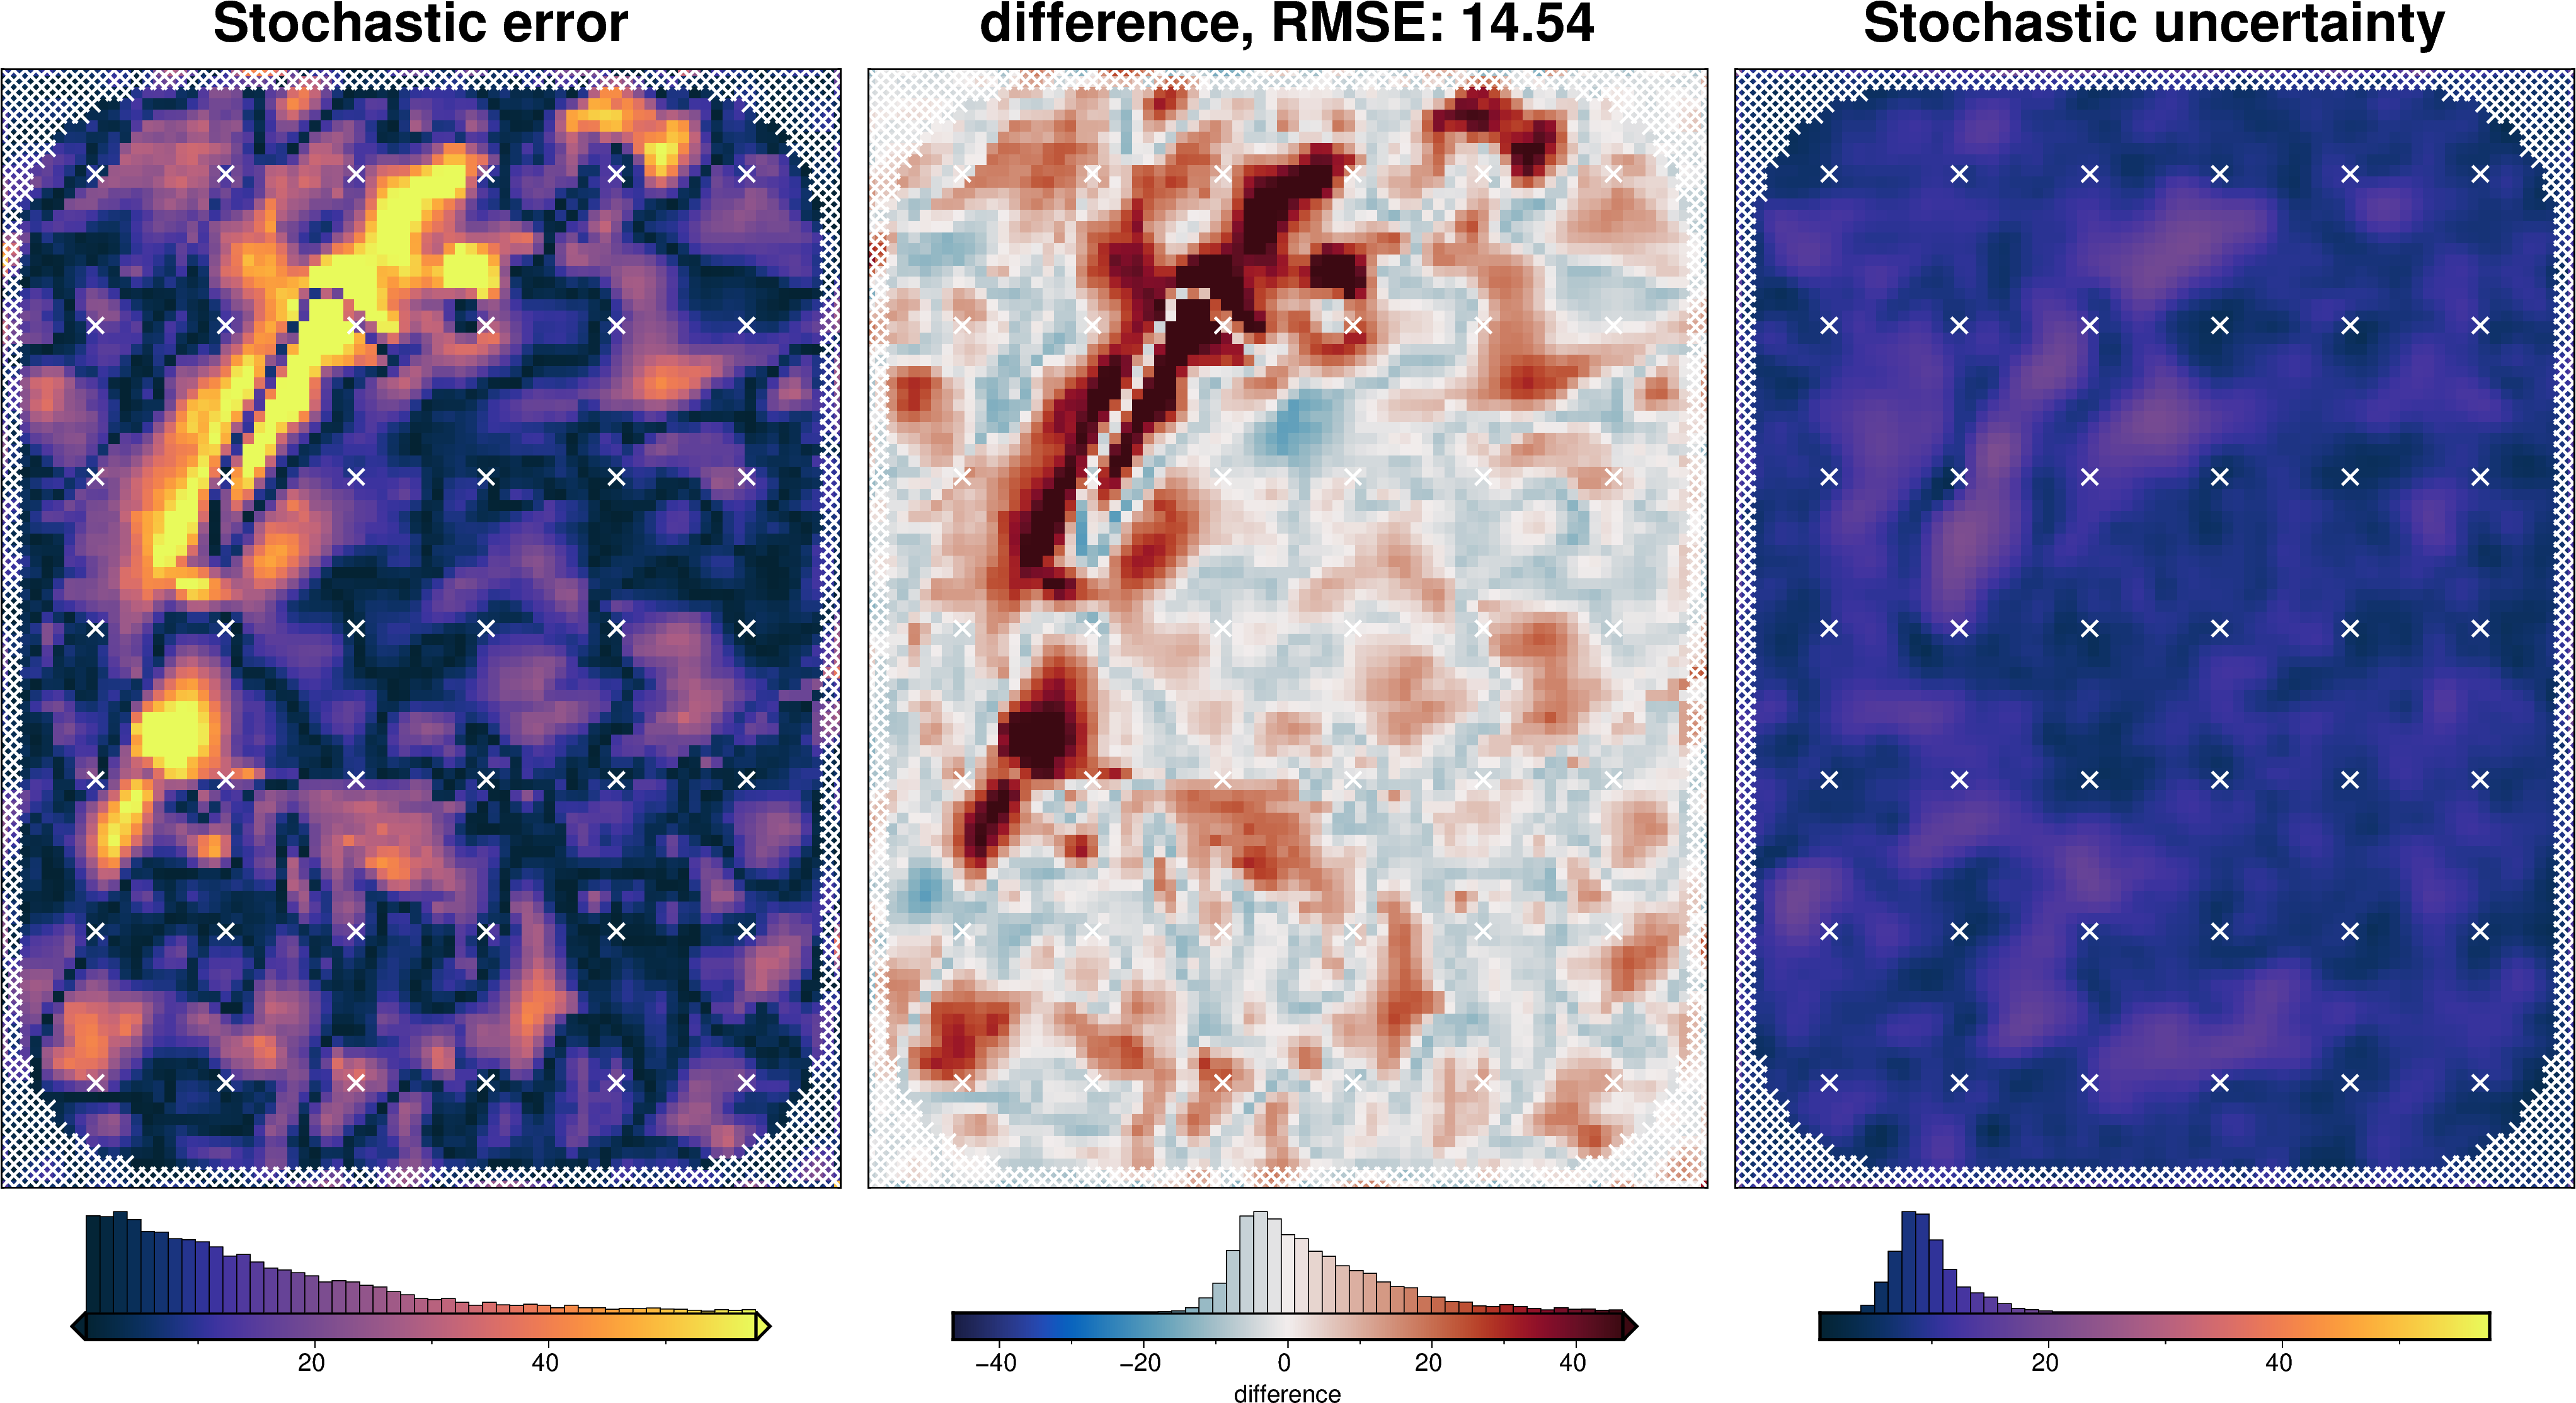
stats_ds = synth_plotting.uncert_plots(
uncert_damping_results,
inversion_region,
bathymetry,
deterministic_bathymetry=final_topography,
constraint_points=constraint_points[constraint_points.inside],
weight_by="constraints",
)
plotting.plot_latin_hypercube(
uncert_damping_results[-1],
)

Density component
[65]:
# load study
with pathlib.Path(f"{fpath}_density_cv_kfolds_study.pickle").open("rb") as f:
study = pickle.load(f)
study_df = study.trials_dataframe()
study_df = study_df.sort_values("value")
# calculate zscores of values
study_df["value_zscore"] = sp.stats.zscore(study_df["value"])
# drop outliers (values with zscore > |2|)
study_df2 = study_df[(np.abs(study_df.value_zscore) < 2)]
stdev = study_df2.params_density_contrast.std()
print(f"calculated stdev: {stdev}")
# manually pick a stdev
stdev = 500
print(f"using stdev: {stdev}")
print(
f"density estimation error: {np.abs(true_density_contrast - best_density_contrast)}"
)
calculated stdev: 228.88266148241271
using stdev: 500
density estimation error: 541
[ ]:
fig = plotting.plot_cv_scores(
study.trials_dataframe().value.to_numpy(),
study.trials_dataframe().params_density_contrast.values,
param_name="Density",
logx=False,
logy=False,
)
ax = fig.axes[0]
best = study_df2.params_density_contrast.iloc[0]
upper = best + stdev
lower = best - stdev
y_lims = ax.get_ylim()
ax.vlines(best, ymin=y_lims[0], ymax=y_lims[1], color="r")
ax.vlines(upper, ymin=y_lims[0], ymax=y_lims[1], label="+/- std")
ax.vlines(lower, ymin=y_lims[0], ymax=y_lims[1])
x_lims = ax.get_xlim()
ax.set_xlim(
min(x_lims[0], lower),
max(x_lims[1], upper),
)
ax.legend()
print("best:", best, "\nstd:", stdev, "\n+1std:", upper, "\n-1std:", lower)
best: 2017
std: 500
+1std: 2517
-1std: 1517

[67]:
density_dict = {
"density_contrast": {
"distribution": "normal",
"loc": best_density_contrast,
"scale": stdev,
},
}
fname = f"{fpath}_uncertainty_density"
# delete files if already exist
for p in pathlib.Path().glob(f"{fname}*"):
p.unlink(missing_ok=True)
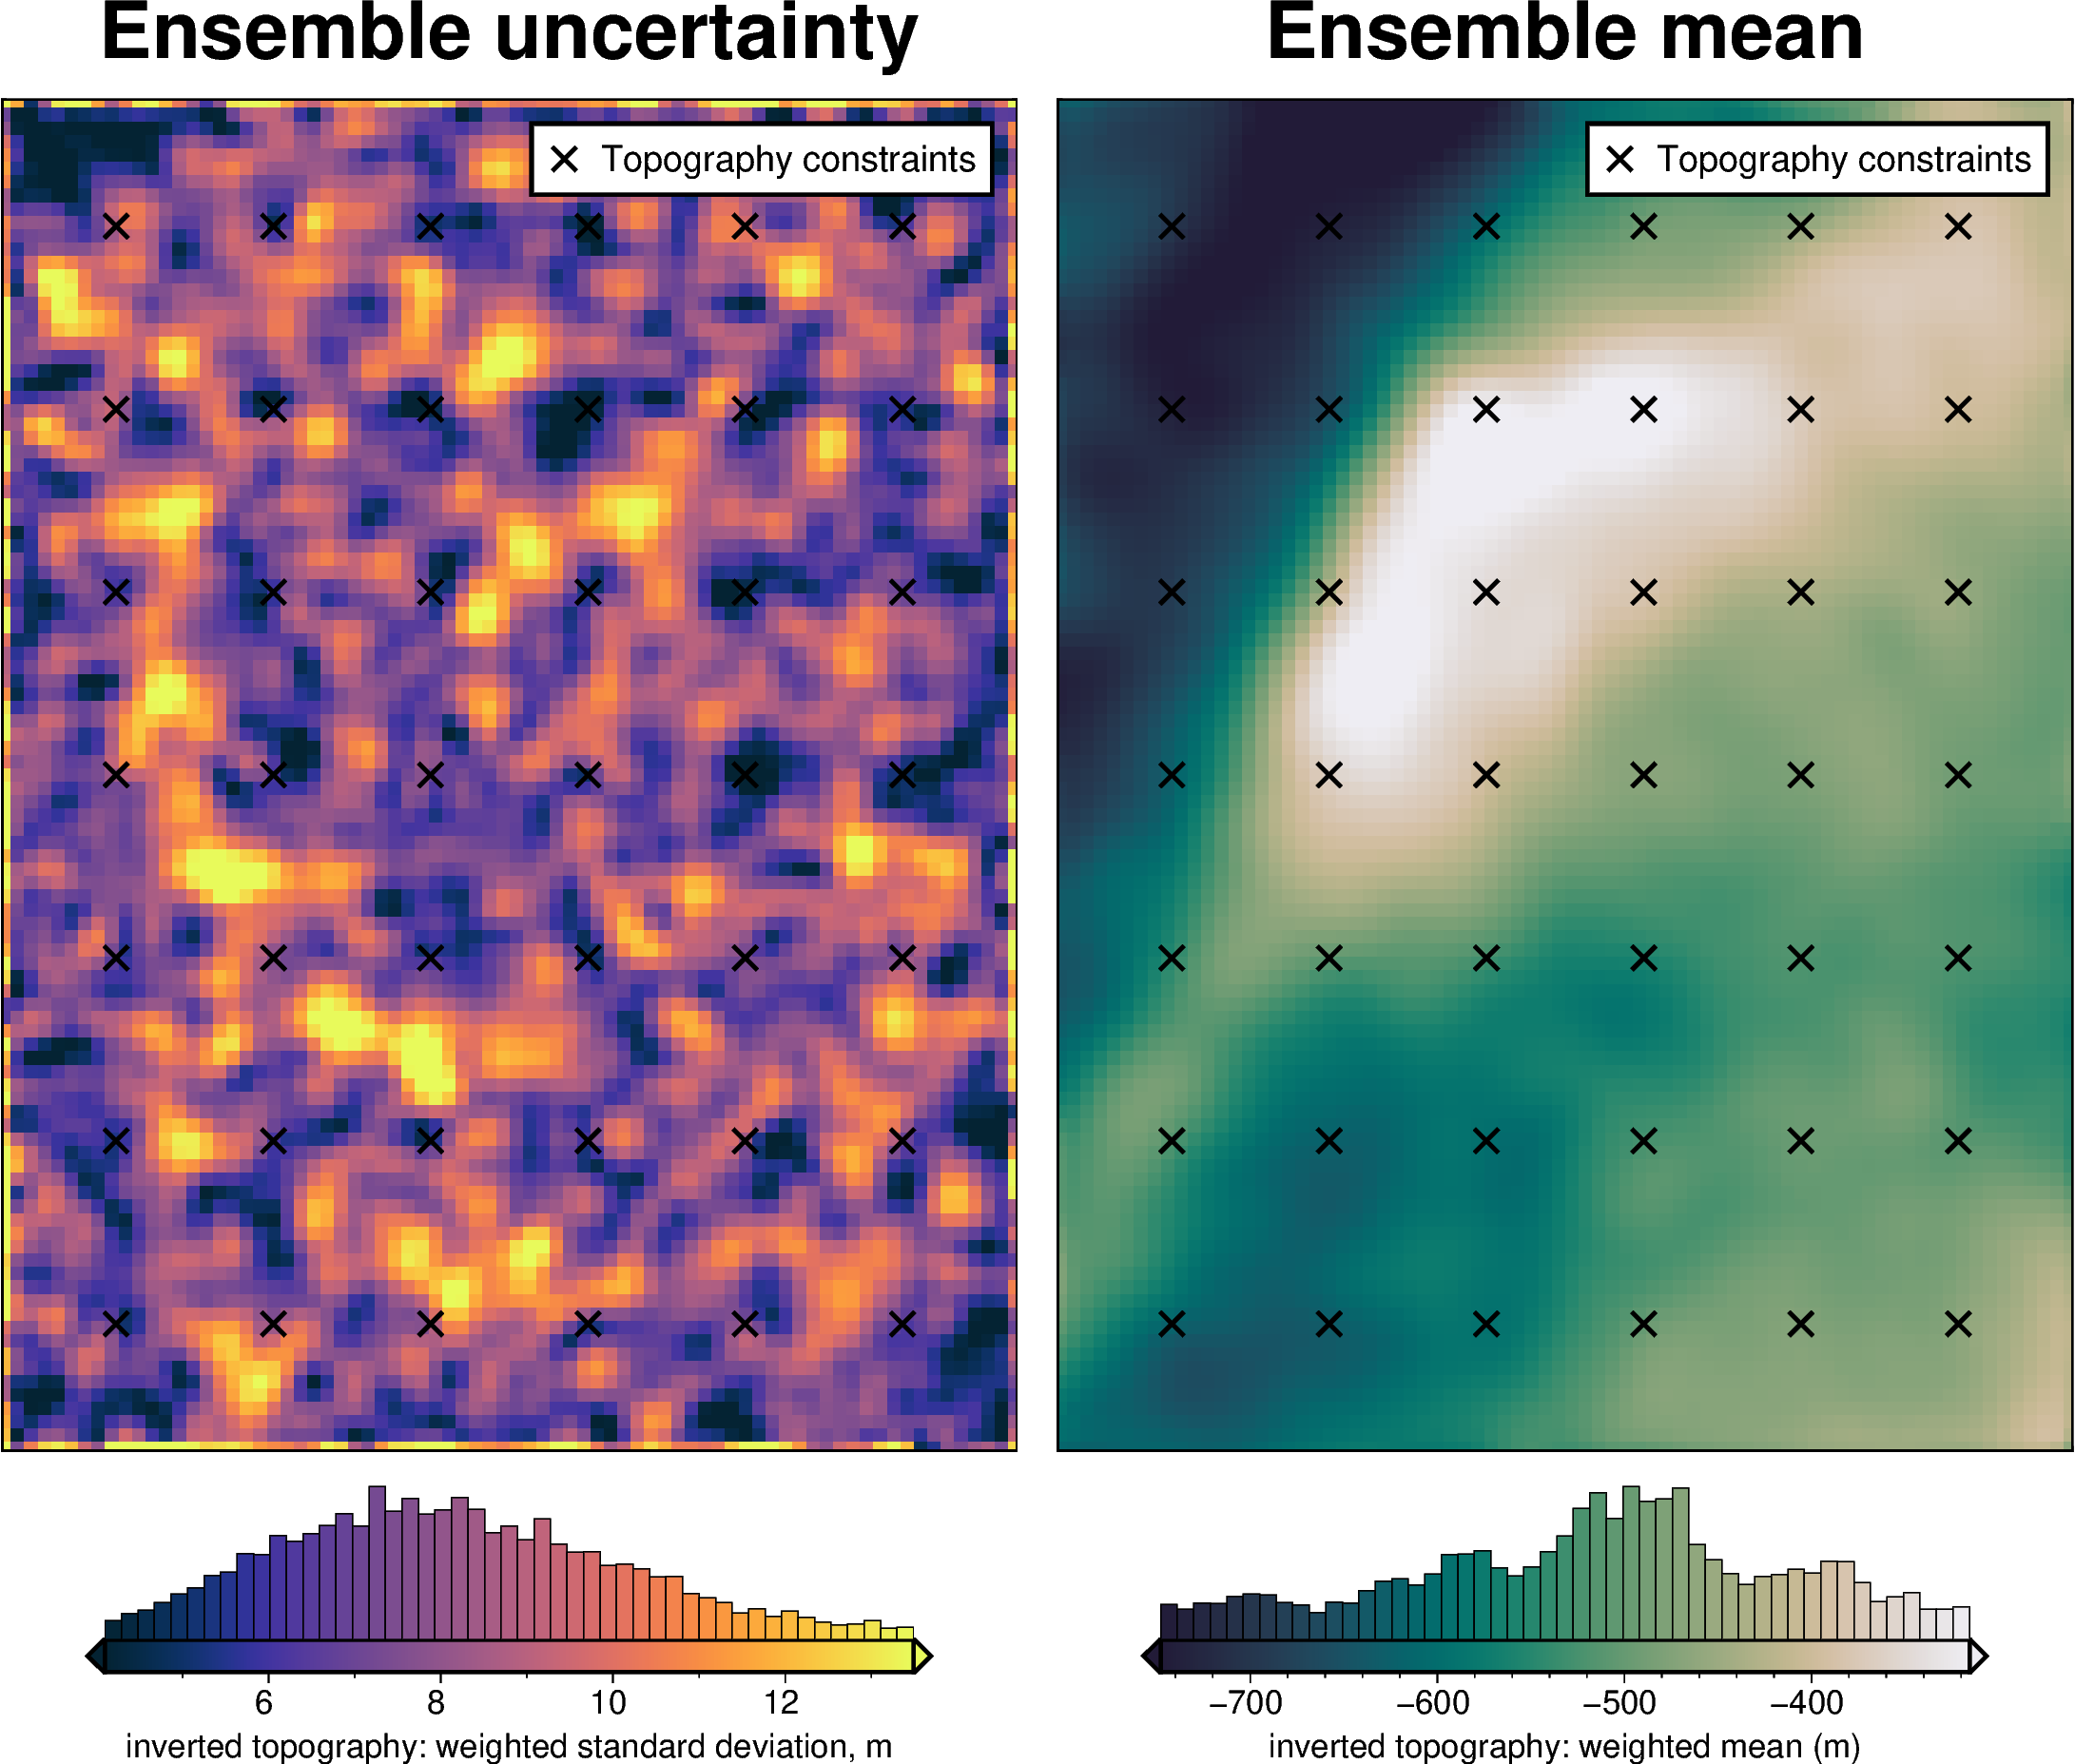
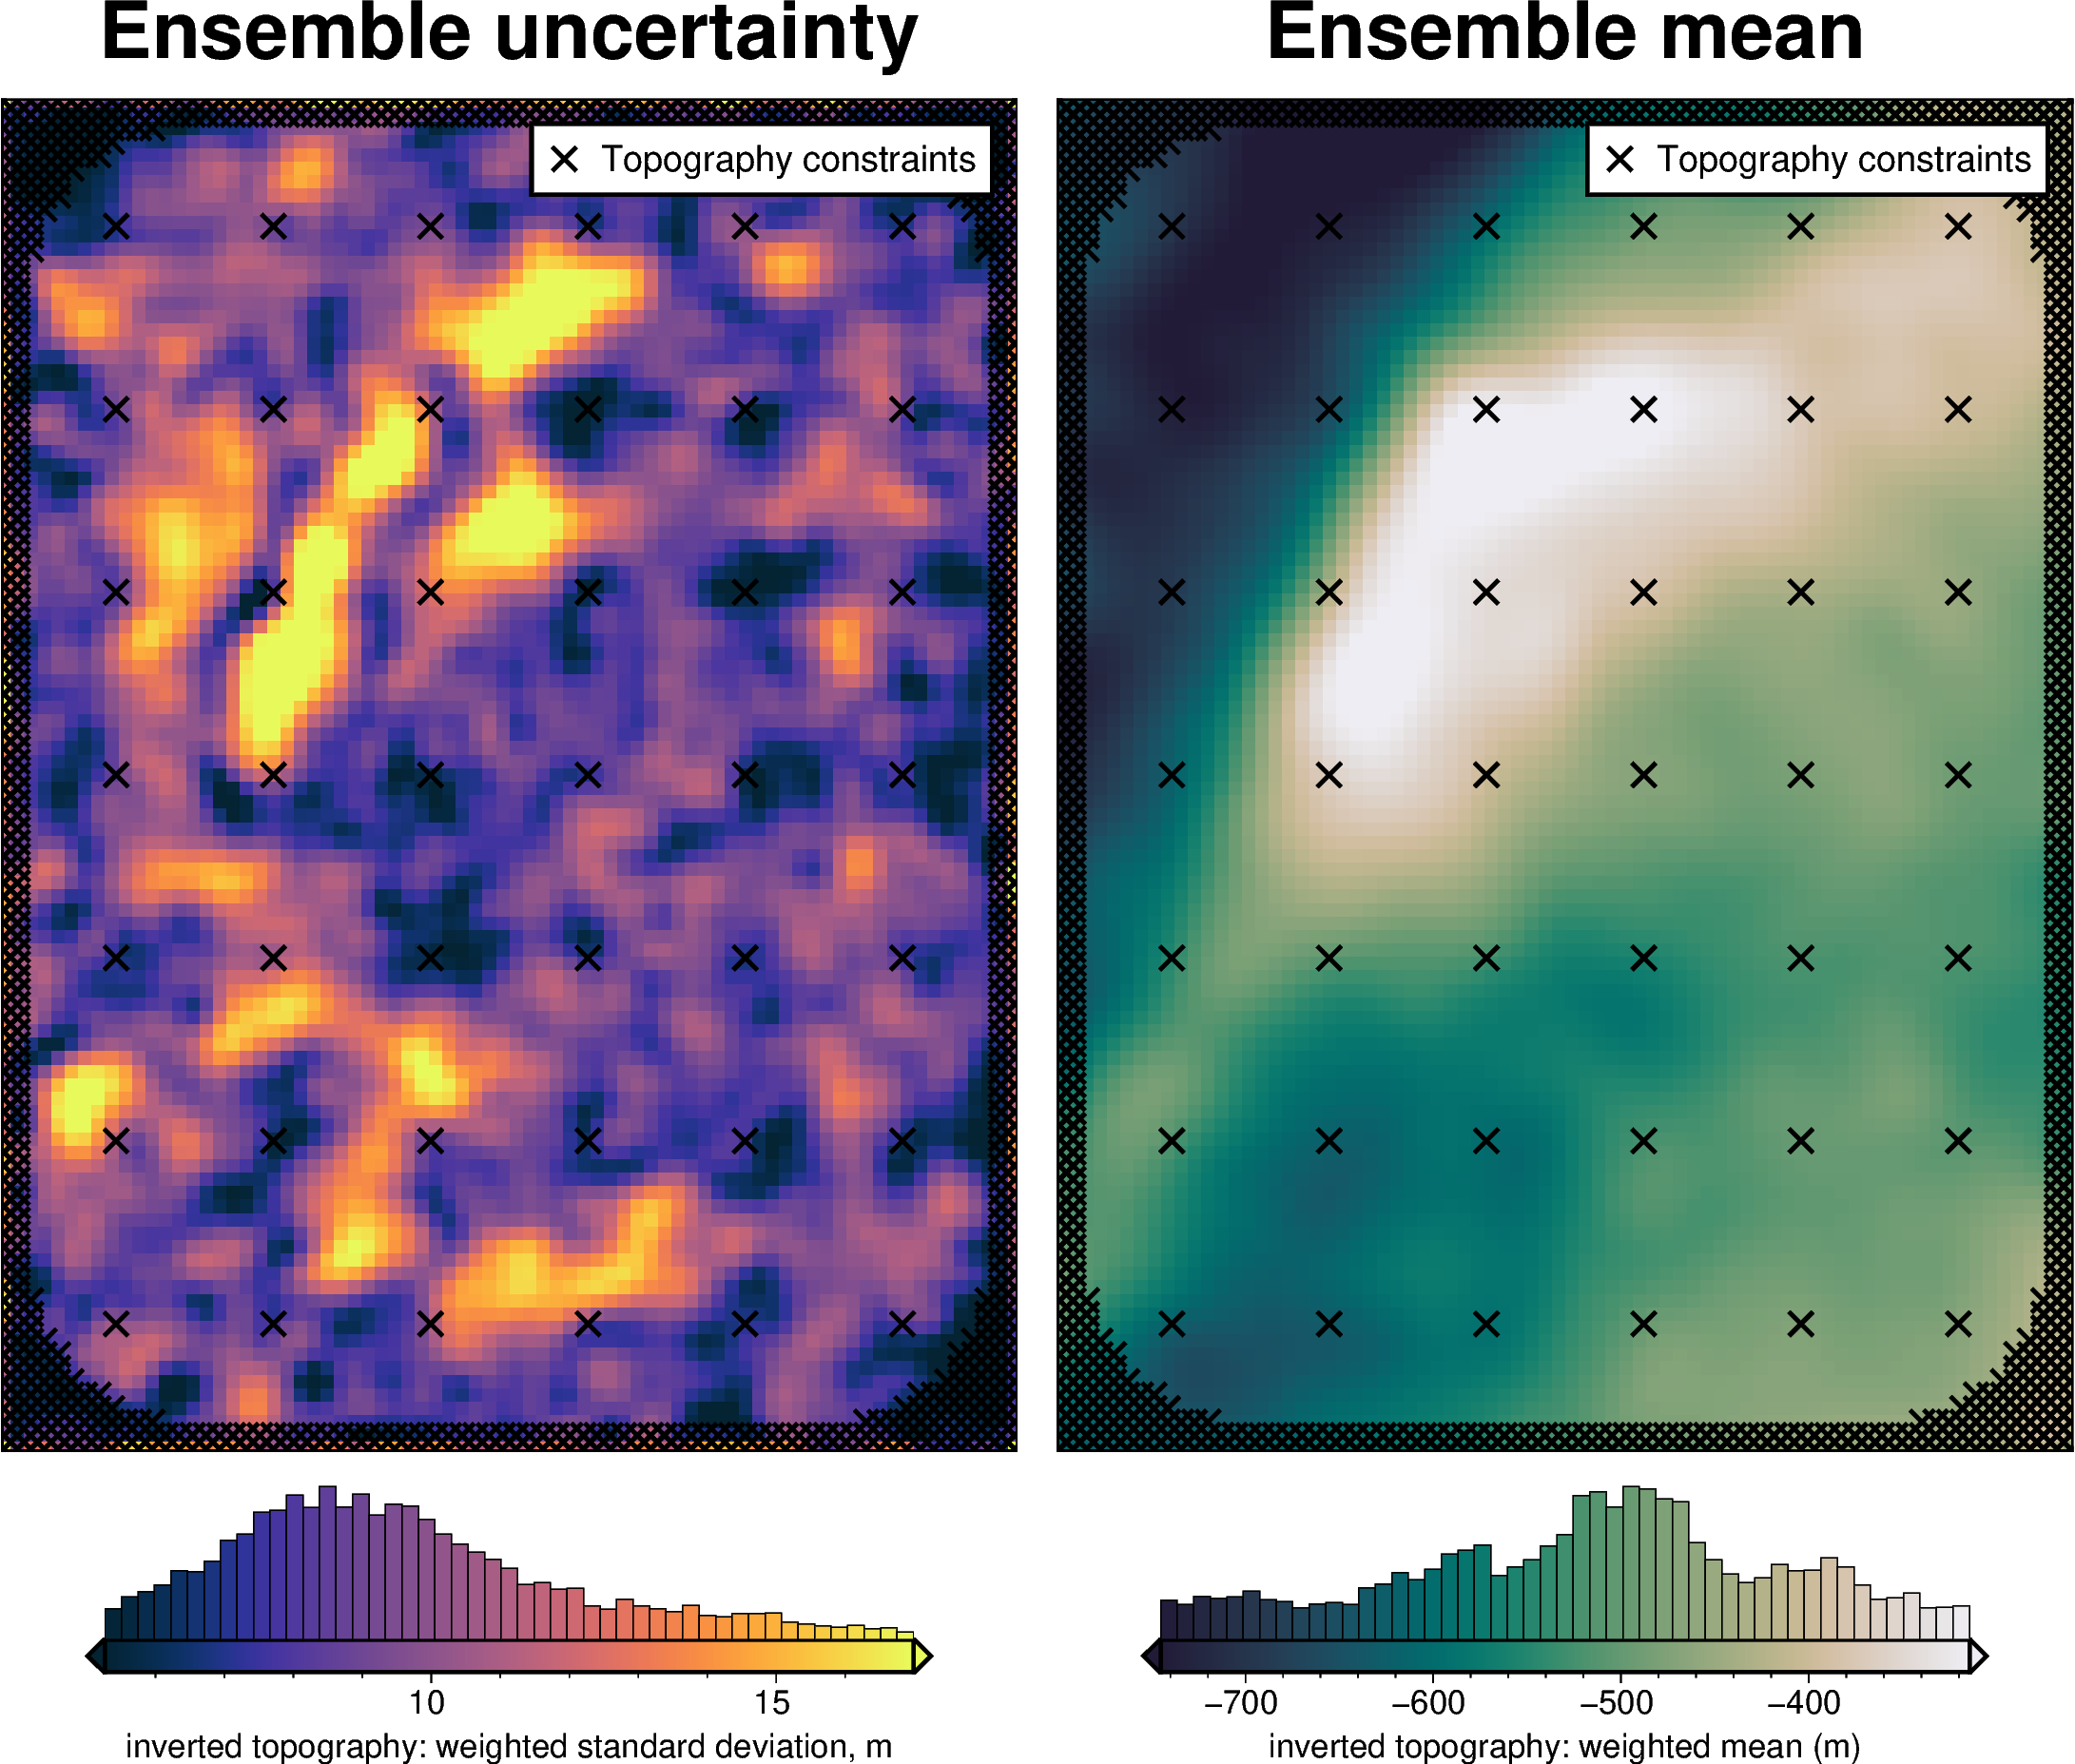
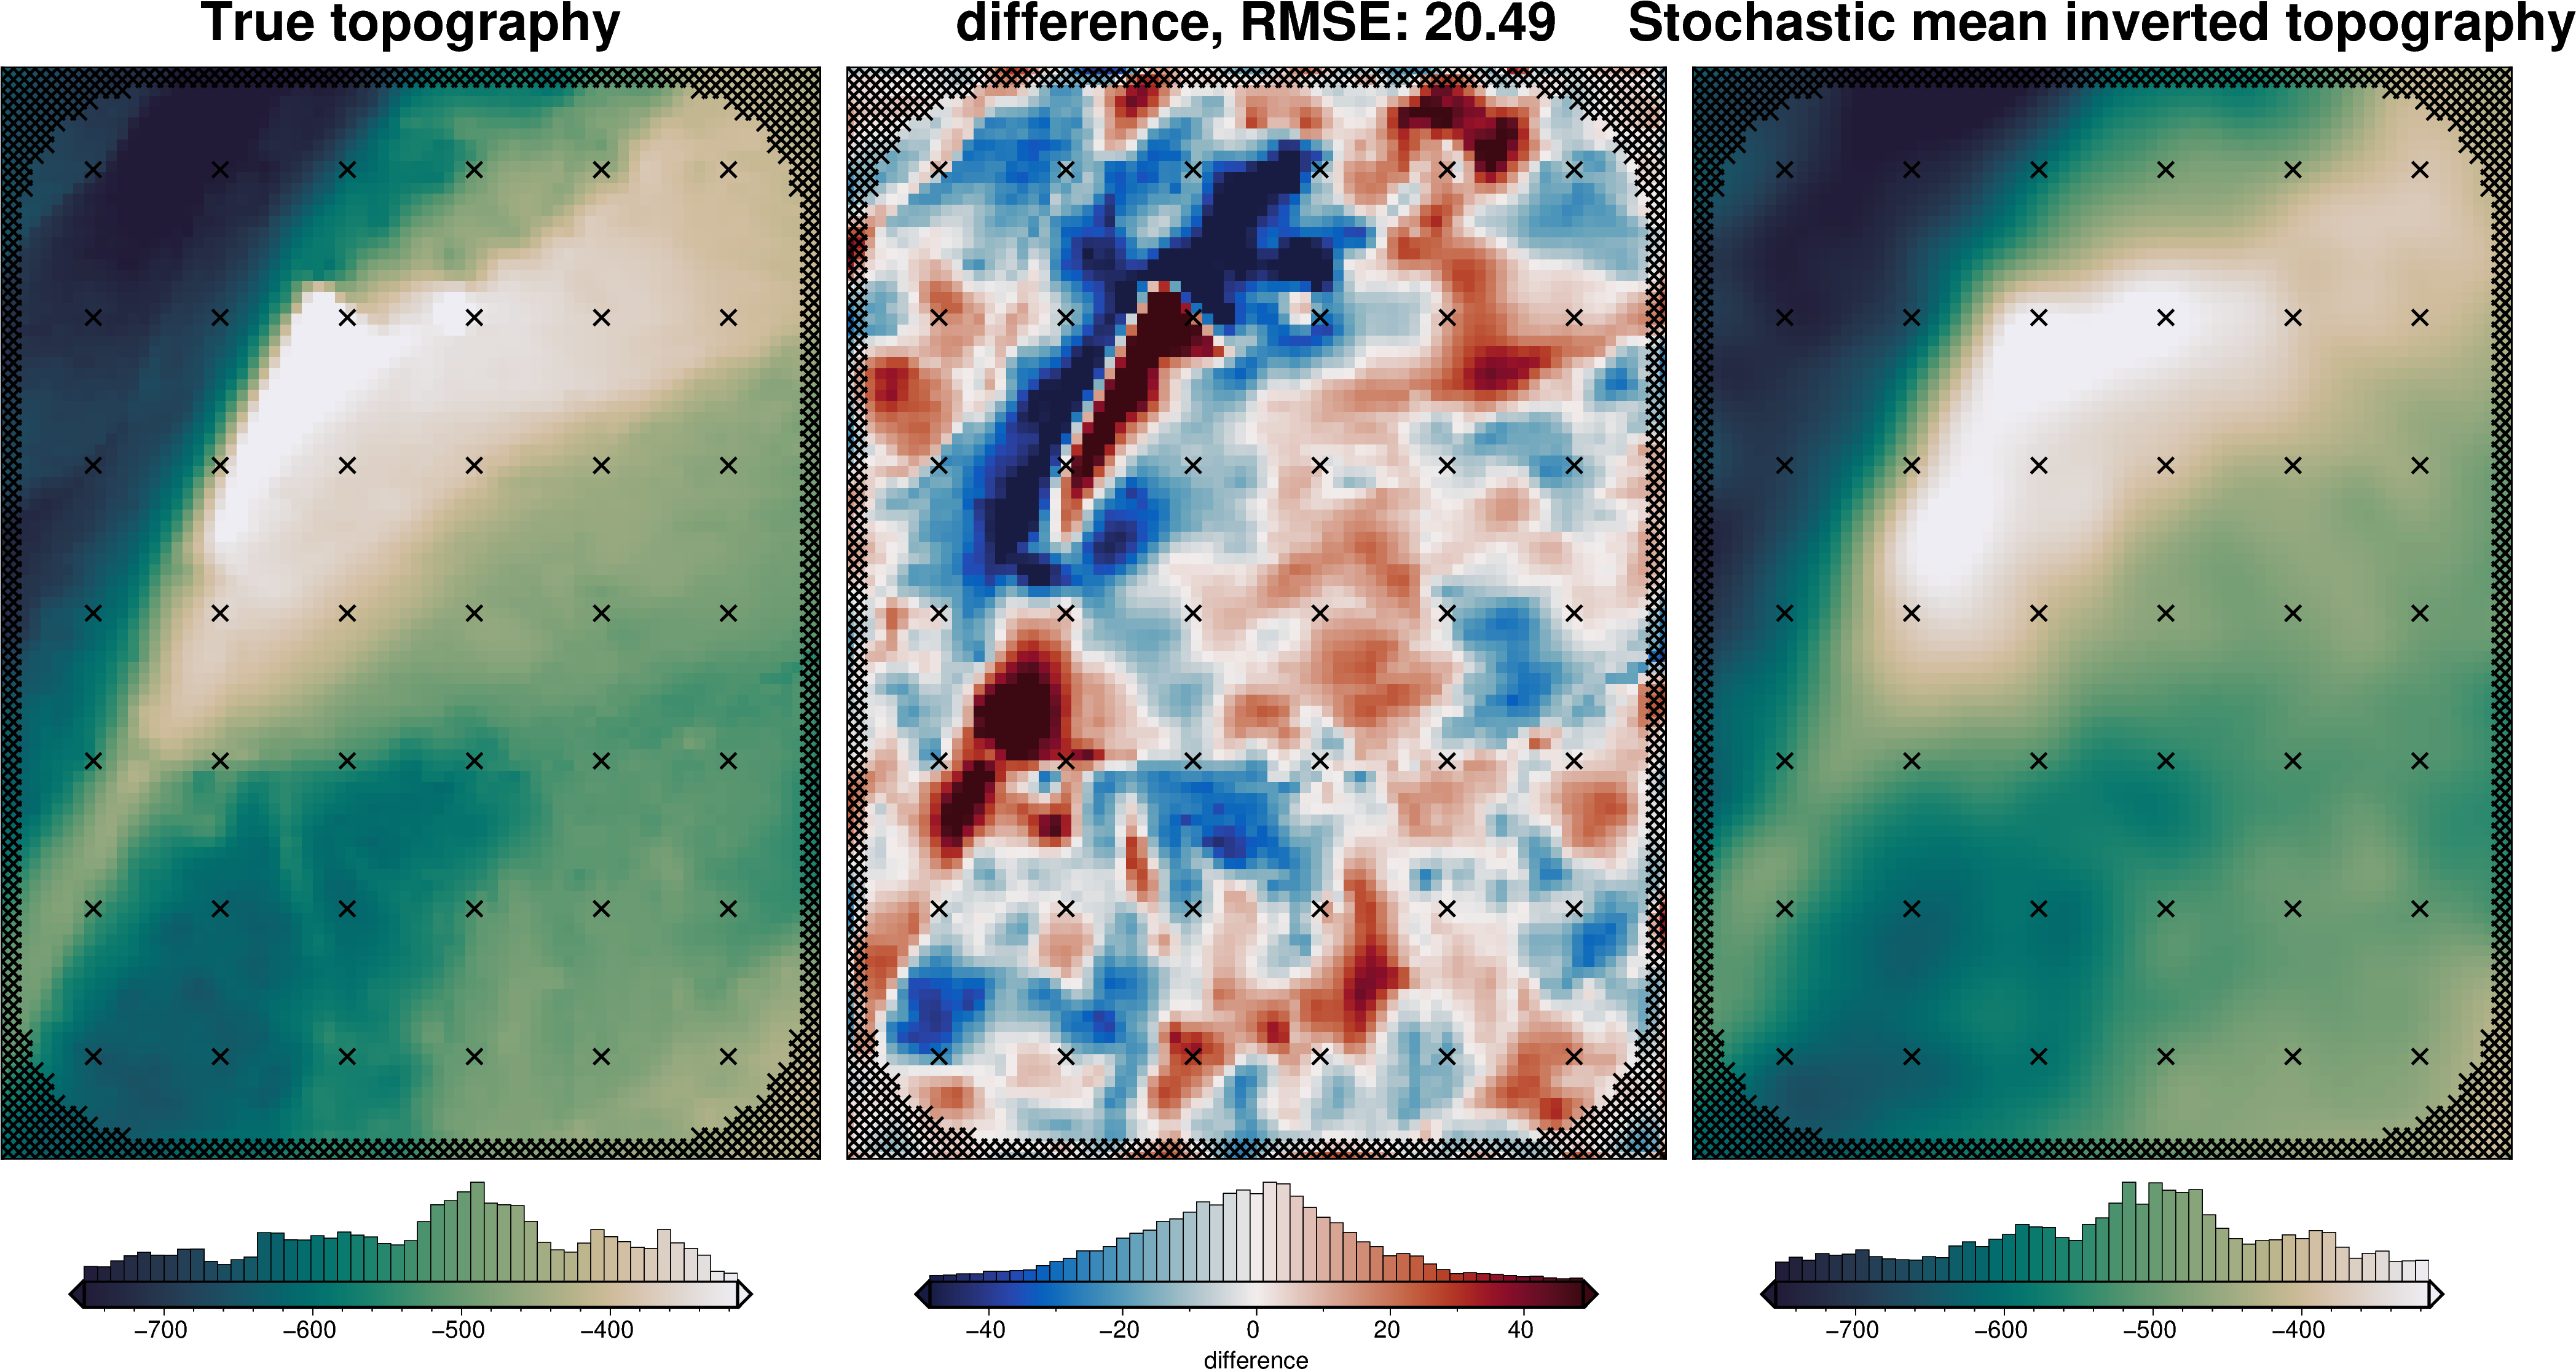
uncert_density_results = uncertainty.full_workflow_uncertainty_loop(
fname=fname,
runs=10,
parameter_dict=density_dict,
**uncert_kwargs,
)
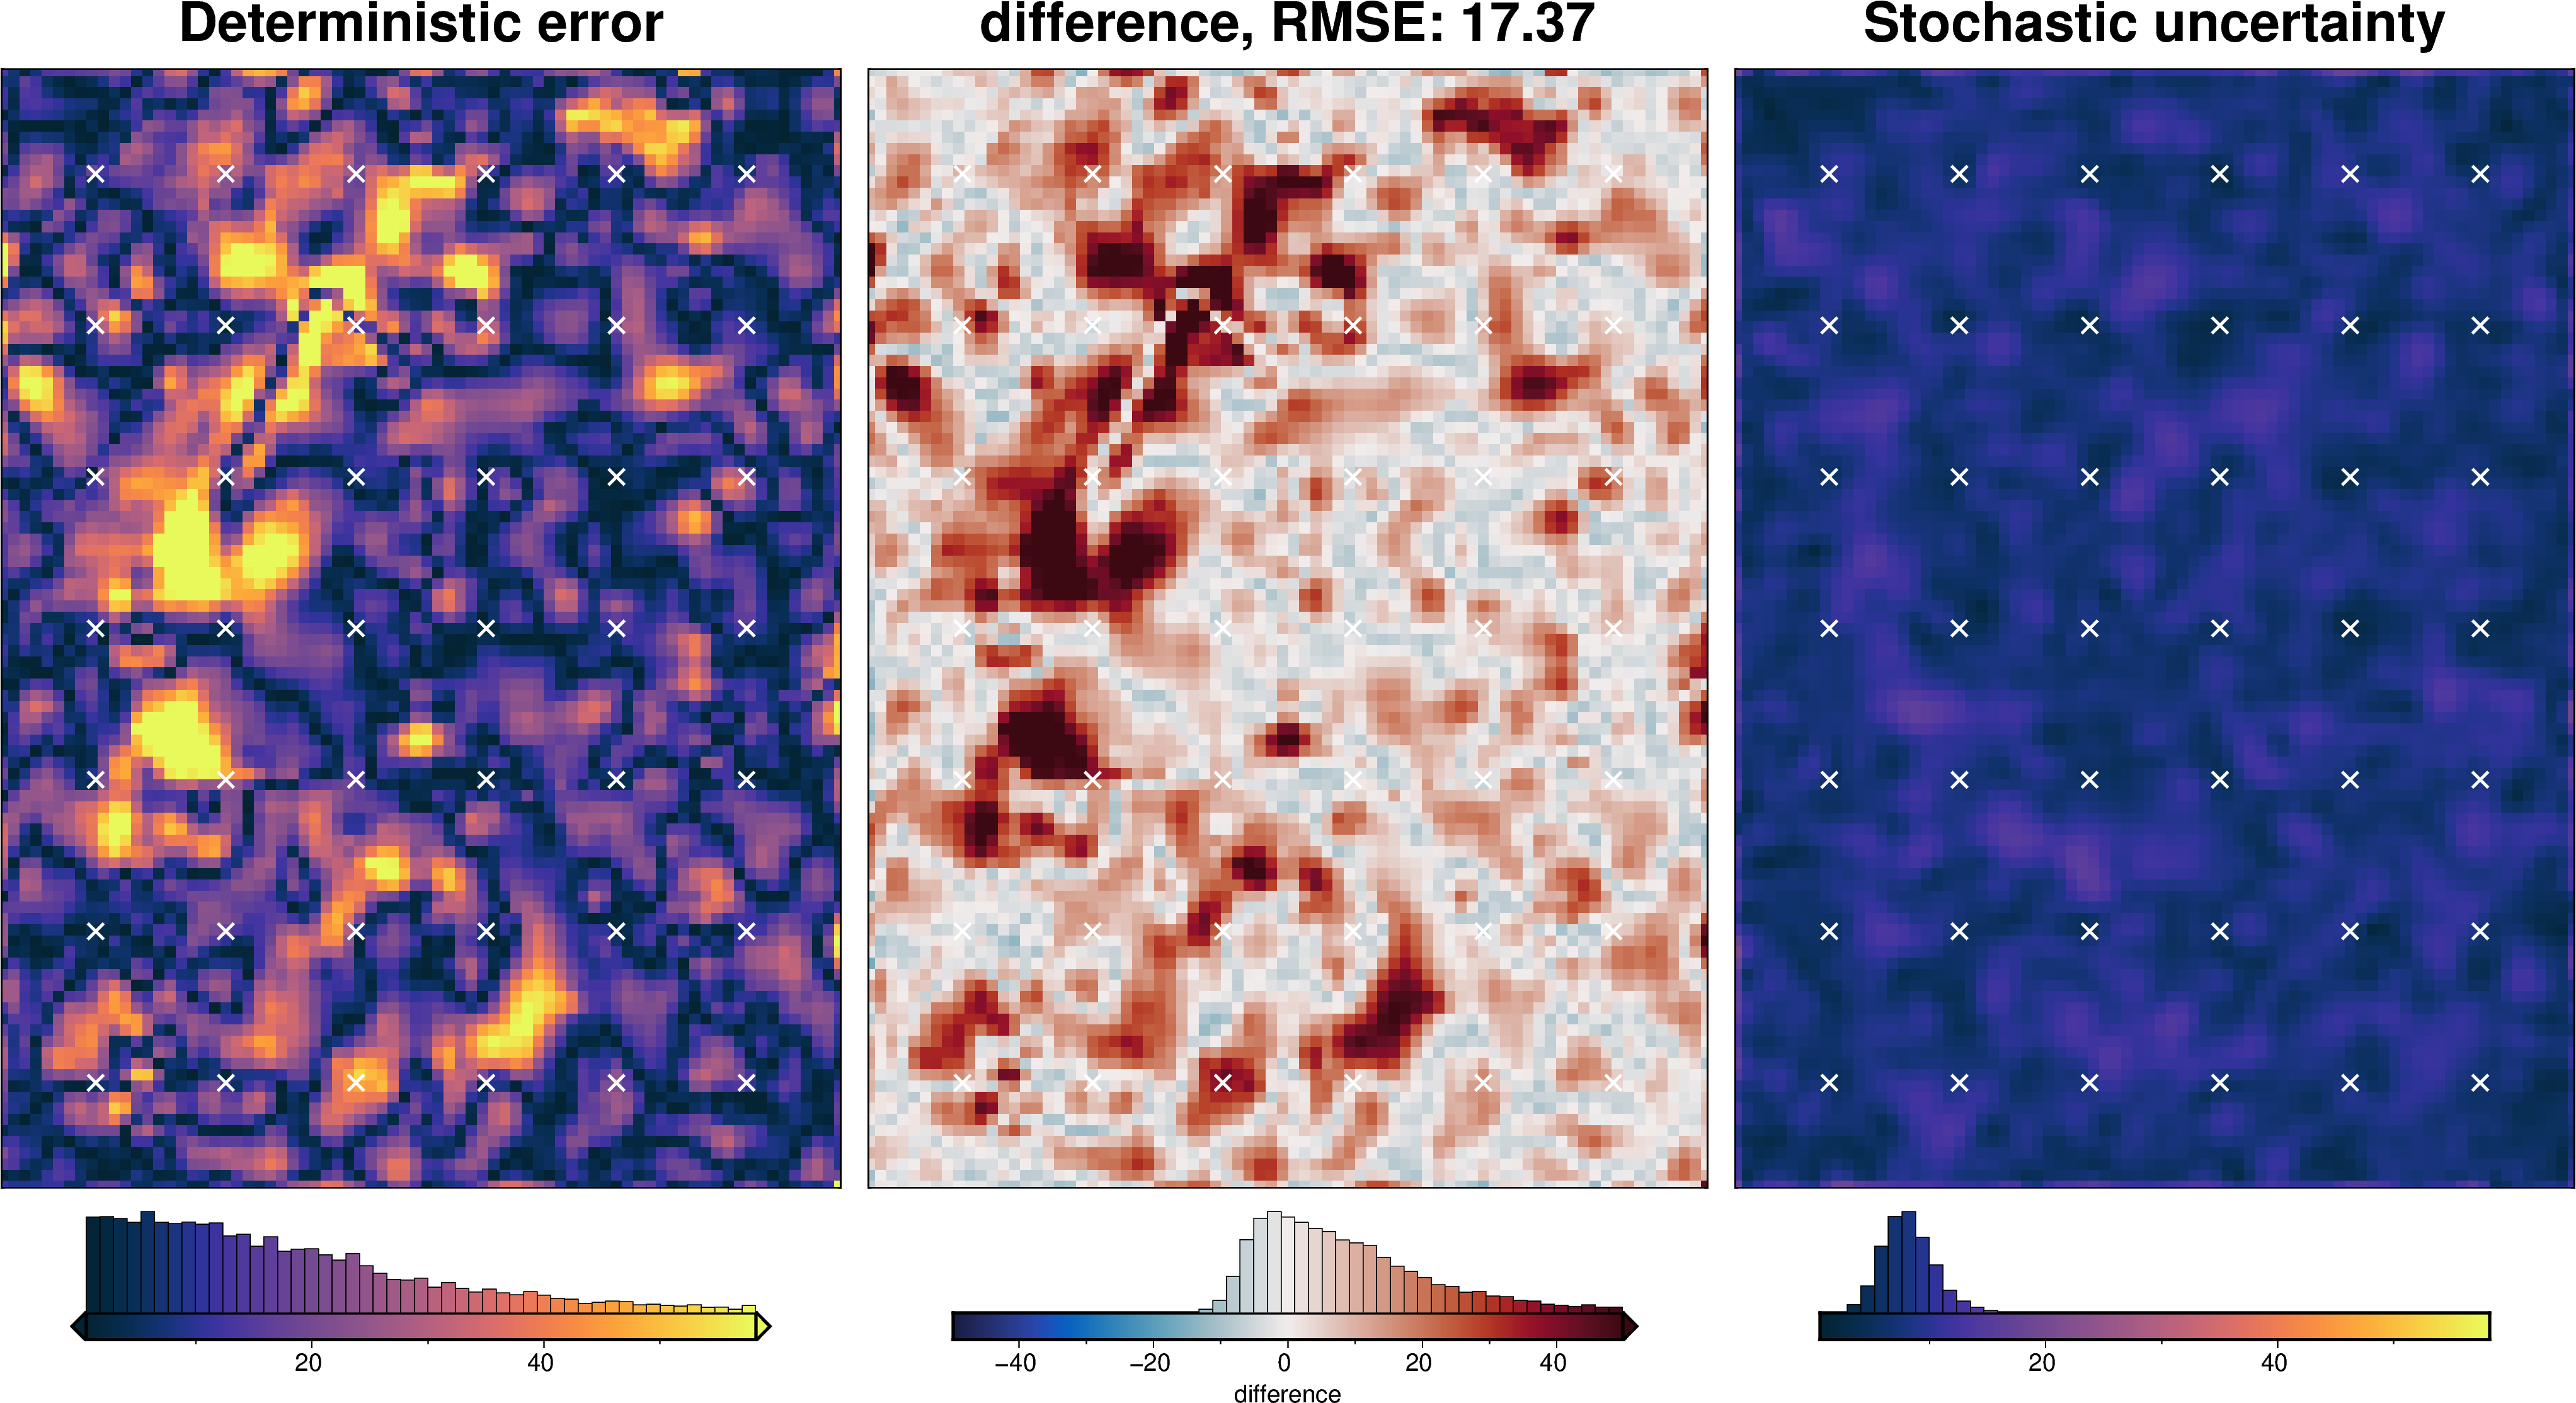
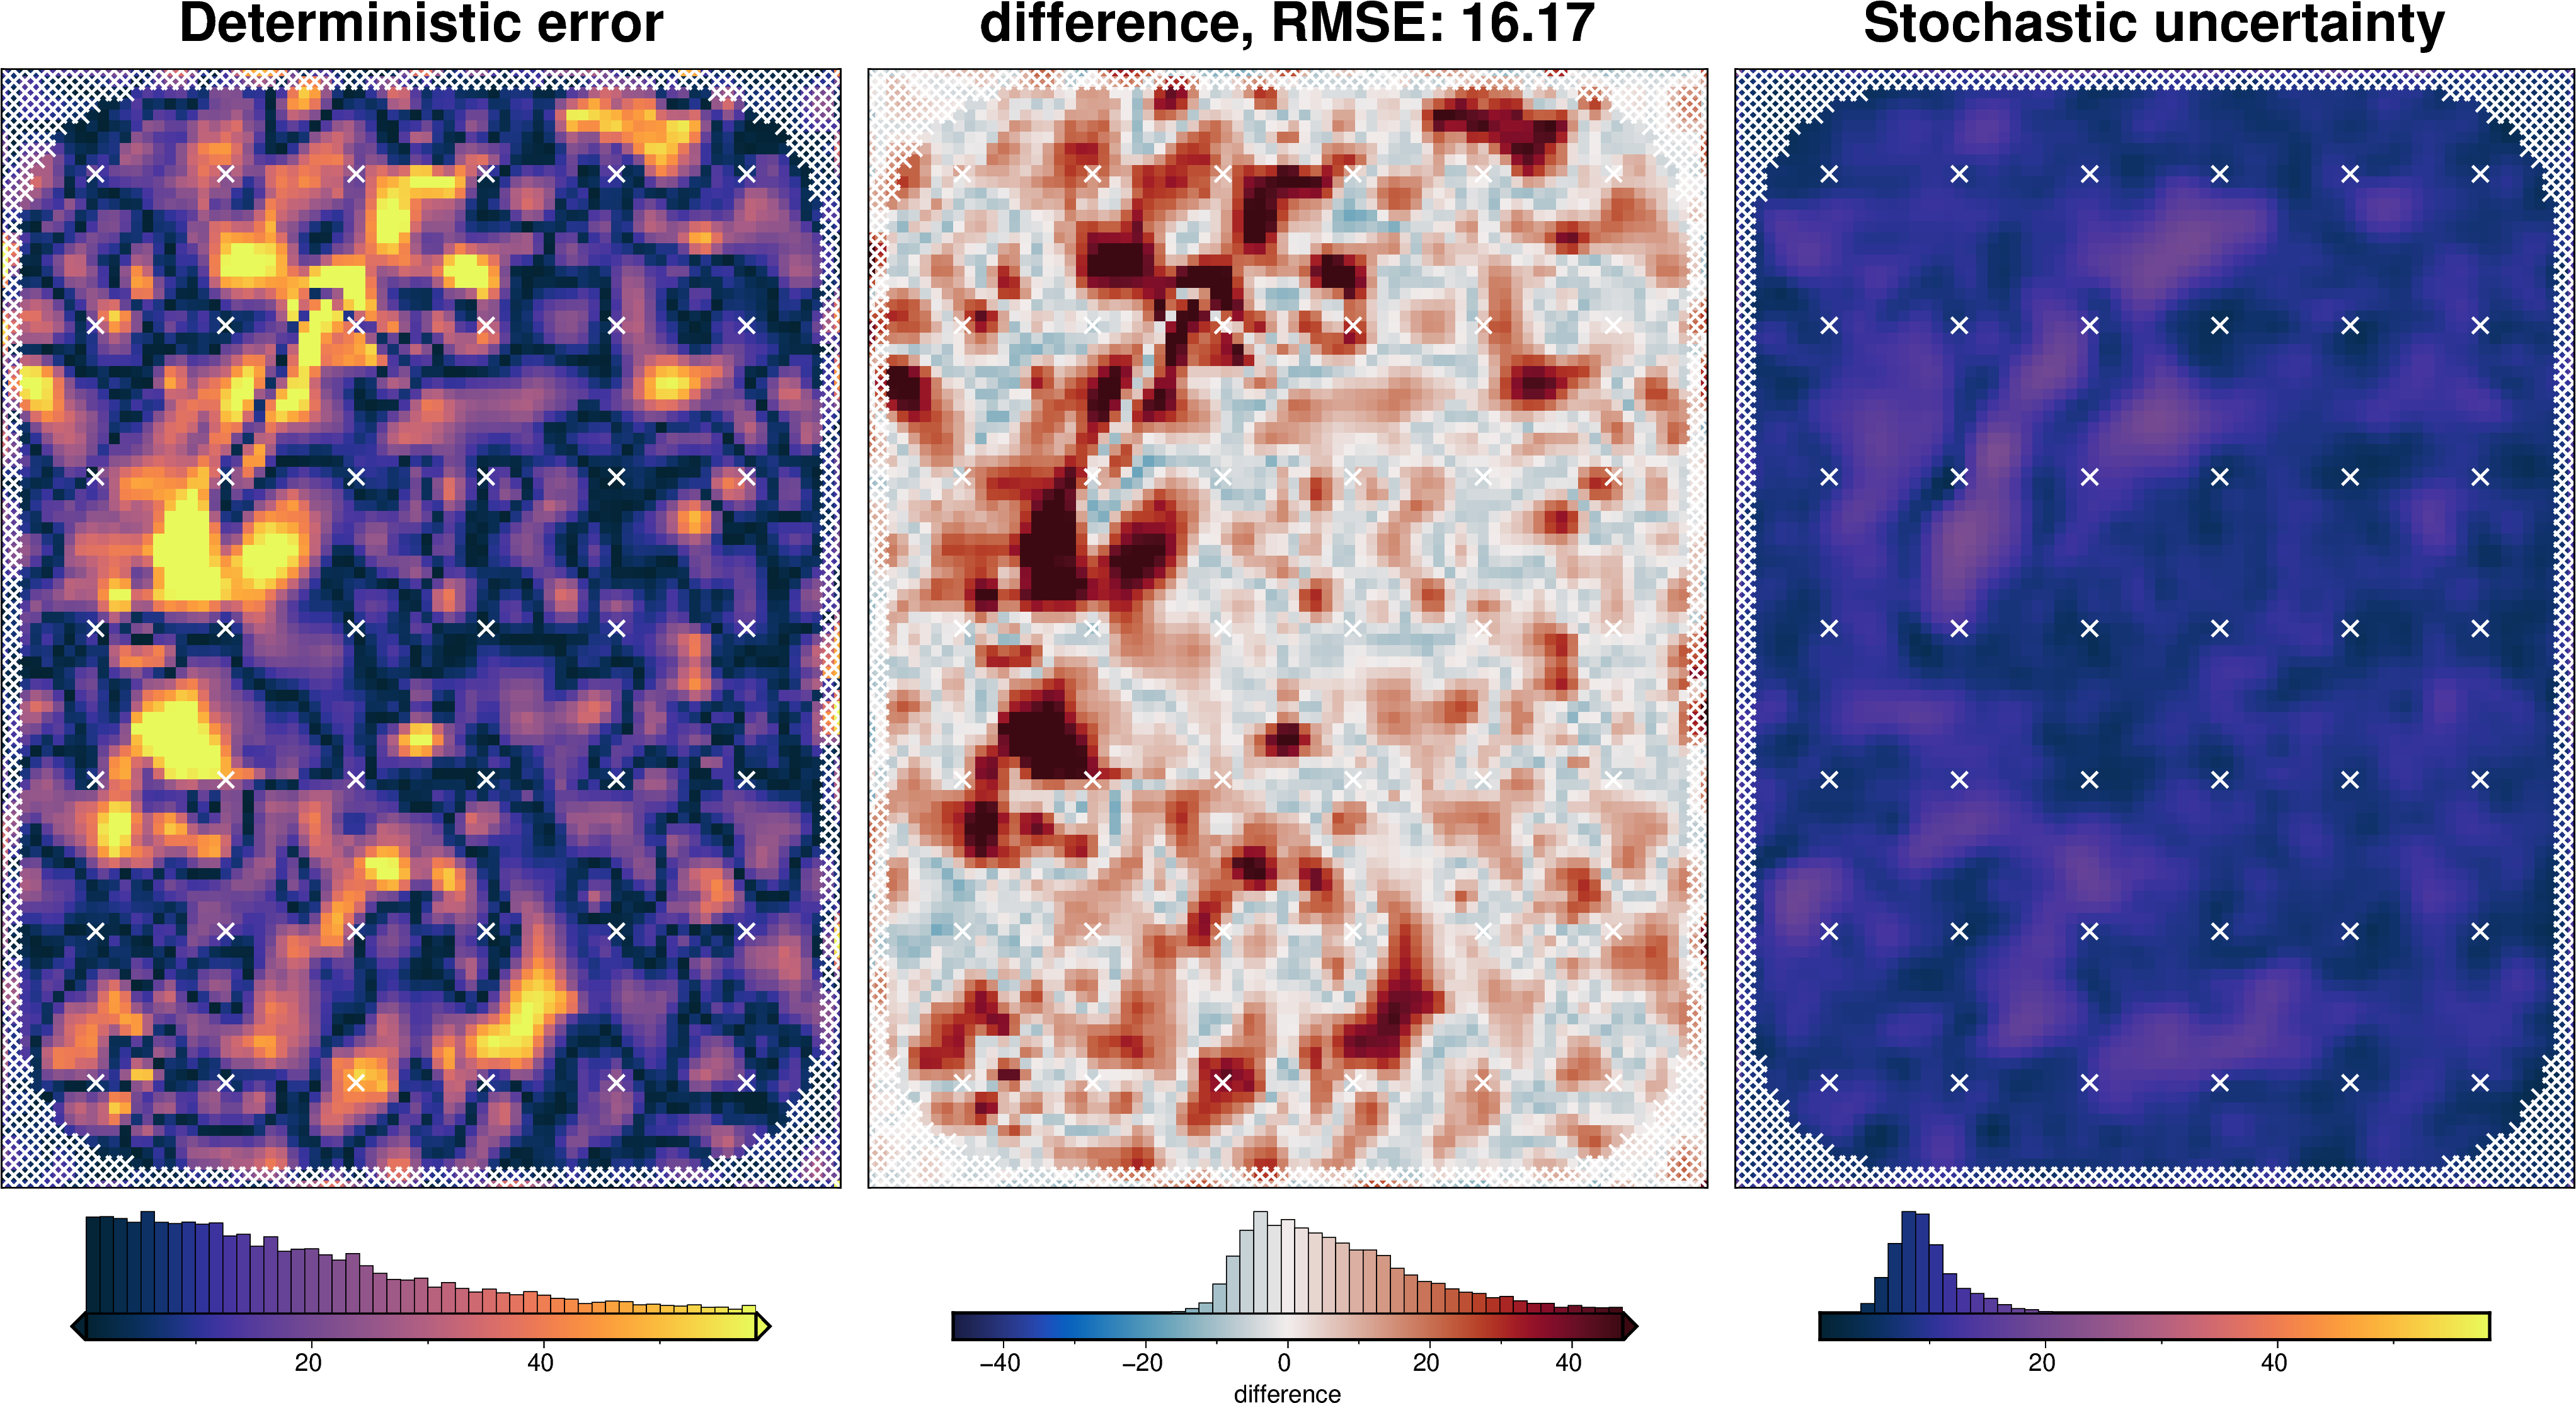
stats_ds = synth_plotting.uncert_plots(
uncert_density_results,
inversion_region,
bathymetry,
deterministic_bathymetry=final_topography,
constraint_points=constraint_points[constraint_points.inside],
weight_by="constraints",
)
plotting.plot_latin_hypercube(
uncert_density_results[-1],
)


Gravity component
[68]:
fname = f"{fpath}_uncertainty_grav_filter"
# delete files if already exist
for p in pathlib.Path().glob(f"{fname}*"):
p.unlink(missing_ok=True)
uncert_grav_results = uncertainty.full_workflow_uncertainty_loop(
fname=fname,
runs=10,
sample_gravity=True,
gravity_filter_width=filt_width,
**uncert_kwargs,
)
stats_ds = synth_plotting.uncert_plots(
uncert_grav_results,
inversion_region,
bathymetry,
deterministic_bathymetry=final_topography,
constraint_points=constraint_points[constraint_points.inside],
weight_by="constraints",
)
Equivalent source gridding component
[69]:
eqs.depth, eqs.damping
[69]:
(10002.265810449084, 0.00018602392746886265)
[70]:
# grid the airborne survey data over the whole grid
coords = (grav_survey_df.easting, grav_survey_df.northing, grav_survey_df.upward)
data = grav_survey_df.gravity_anomaly
equivalent_source_parameter_dict = {
"depth": {
"distribution": "normal",
"loc": eqs.depth, # mean
"scale": eqs.depth / 4, # standard deviation
},
"damping": {
"log": True,
"distribution": "normal",
"loc": np.log10(
eqs.damping
), # mean of base 10 exponent, supply log10(value) here
"scale": 2,
},
}
eqs_kwargs = dict(
block_size=spacing,
damping=eqs.damping,
depth=eqs.depth,
)
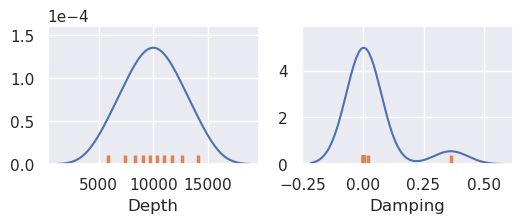
eqs_stats, eqs_sampled_params = uncertainty.equivalent_sources_uncertainty(
runs=10,
data=data,
coords=coords,
grid_points=grav_df,
parameter_dict=equivalent_source_parameter_dict,
plot_region=inversion_region,
true_gravity=grav_df.set_index(["northing", "easting"])
.to_xarray()
.gravity_anomaly_full_res_no_noise,
**eqs_kwargs,
)

[71]:
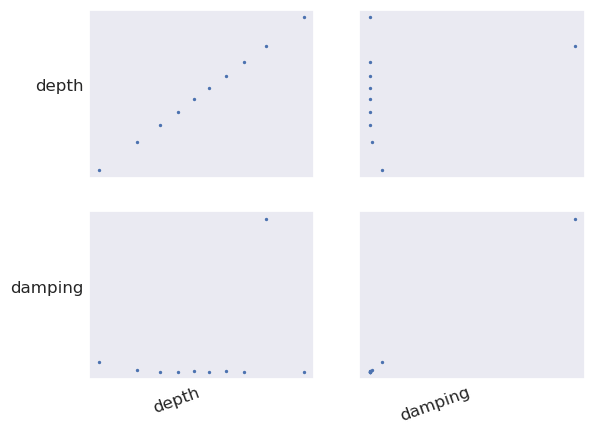
plotting.plot_latin_hypercube(
eqs_sampled_params,
)
[72]:
grav_df = utils.sample_grids(
grav_df,
eqs_stats.z_stdev,
sampled_name="eqs_uncert",
coord_names=["easting", "northing"],
)
grav_df = utils.sample_grids(
grav_df,
eqs_stats.z_mean,
sampled_name="gravity_anomaly_eqs_mean",
coord_names=["easting", "northing"],
)
grav_df
[72]:
| northing | easting | upward | bathymetry_grav | basement_grav_normalized | basement_grav | gravity_anomaly_full_res_no_noise | gravity_anomaly_full_res | uncert | eqs_gravity_anomaly | gravity_anomaly | starting_gravity | true_res | misfit | reg | res | predicted_grav | eqs_uncert | gravity_anomaly_eqs_mean | |
|---|---|---|---|---|---|---|---|---|---|---|---|---|---|---|---|---|---|---|---|
| 0 | -1600000.0 | -40000.0 | 1000.0 | -35.551085 | -0.575645 | -36.300394 | -71.851479 | -72.911198 | 3 | -64.481389 | -64.481389 | -48.619213 | -3.009718 | -15.862176 | -16.122599 | 0.260423 | -63.548020 | 1.537731 | -64.071709 |
| 1 | -1600000.0 | -38000.0 | 1000.0 | -36.054683 | -0.523223 | -33.941405 | -69.996088 | -72.483909 | 3 | -64.163085 | -64.163085 | -49.253393 | -3.088852 | -14.909692 | -15.170638 | 0.260946 | -63.265430 | 1.318696 | -63.840919 |
| 2 | -1600000.0 | -36000.0 | 1000.0 | -36.473168 | -0.466365 | -31.382798 | -67.855967 | -68.870245 | 3 | -63.178870 | -63.178870 | -49.823856 | -3.125521 | -13.355014 | -13.664288 | 0.309273 | -62.373919 | 1.168135 | -62.895153 |
| 3 | -1600000.0 | -34000.0 | 1000.0 | -36.755627 | -0.406022 | -28.667352 | -65.422980 | -61.536475 | 3 | -61.636021 | -61.636021 | -50.267369 | -3.111132 | -11.368652 | -11.745396 | 0.376744 | -60.927827 | 0.998435 | -61.368729 |
| 4 | -1600000.0 | -32000.0 | 1000.0 | -36.951045 | -0.343163 | -25.838709 | -62.789754 | -65.528788 | 3 | -59.623519 | -59.623519 | -50.559560 | -3.110982 | -9.063958 | -9.536508 | 0.472549 | -59.029803 | 0.823200 | -59.381863 |
| ... | ... | ... | ... | ... | ... | ... | ... | ... | ... | ... | ... | ... | ... | ... | ... | ... | ... | ... | ... |
| 7671 | -1400000.0 | 102000.0 | 1000.0 | -25.760090 | 0.399167 | 7.566127 | -18.193963 | -19.271274 | 3 | -15.904465 | -15.904465 | -34.844057 | -2.438584 | 18.939592 | 19.012037 | -0.072445 | -15.257679 | 0.453509 | -15.803412 |
| 7672 | -1400000.0 | 104000.0 | 1000.0 | -25.911429 | 0.334798 | 4.669511 | -21.241918 | -24.226858 | 3 | -18.079420 | -18.079420 | -35.084020 | -2.429314 | 17.004601 | 17.116225 | -0.111625 | -17.438494 | 0.543577 | -17.979362 |
| 7673 | -1400000.0 | 106000.0 | 1000.0 | -26.032814 | 0.268741 | 1.696963 | -24.335851 | -19.966292 | 3 | -20.010773 | -20.010773 | -35.268519 | -2.427211 | 15.257745 | 15.278755 | -0.021010 | -19.340789 | 0.641431 | -19.894672 |
| 7674 | -1400000.0 | 108000.0 | 1000.0 | -26.121903 | 0.201716 | -1.319170 | -27.441073 | -21.510609 | 3 | -21.483911 | -21.483911 | -35.399352 | -2.428732 | 13.915441 | 13.543247 | 0.372195 | -20.793058 | 0.727924 | -21.352880 |
| 7675 | -1400000.0 | 110000.0 | 1000.0 | -26.206160 | 0.134418 | -4.347560 | -30.553720 | -34.929273 | 3 | -22.365574 | -22.365574 | -35.504847 | -2.442381 | 13.139273 | 11.959733 | 1.179540 | -21.680134 | 0.833954 | -22.235901 |
7676 rows × 19 columns
[73]:
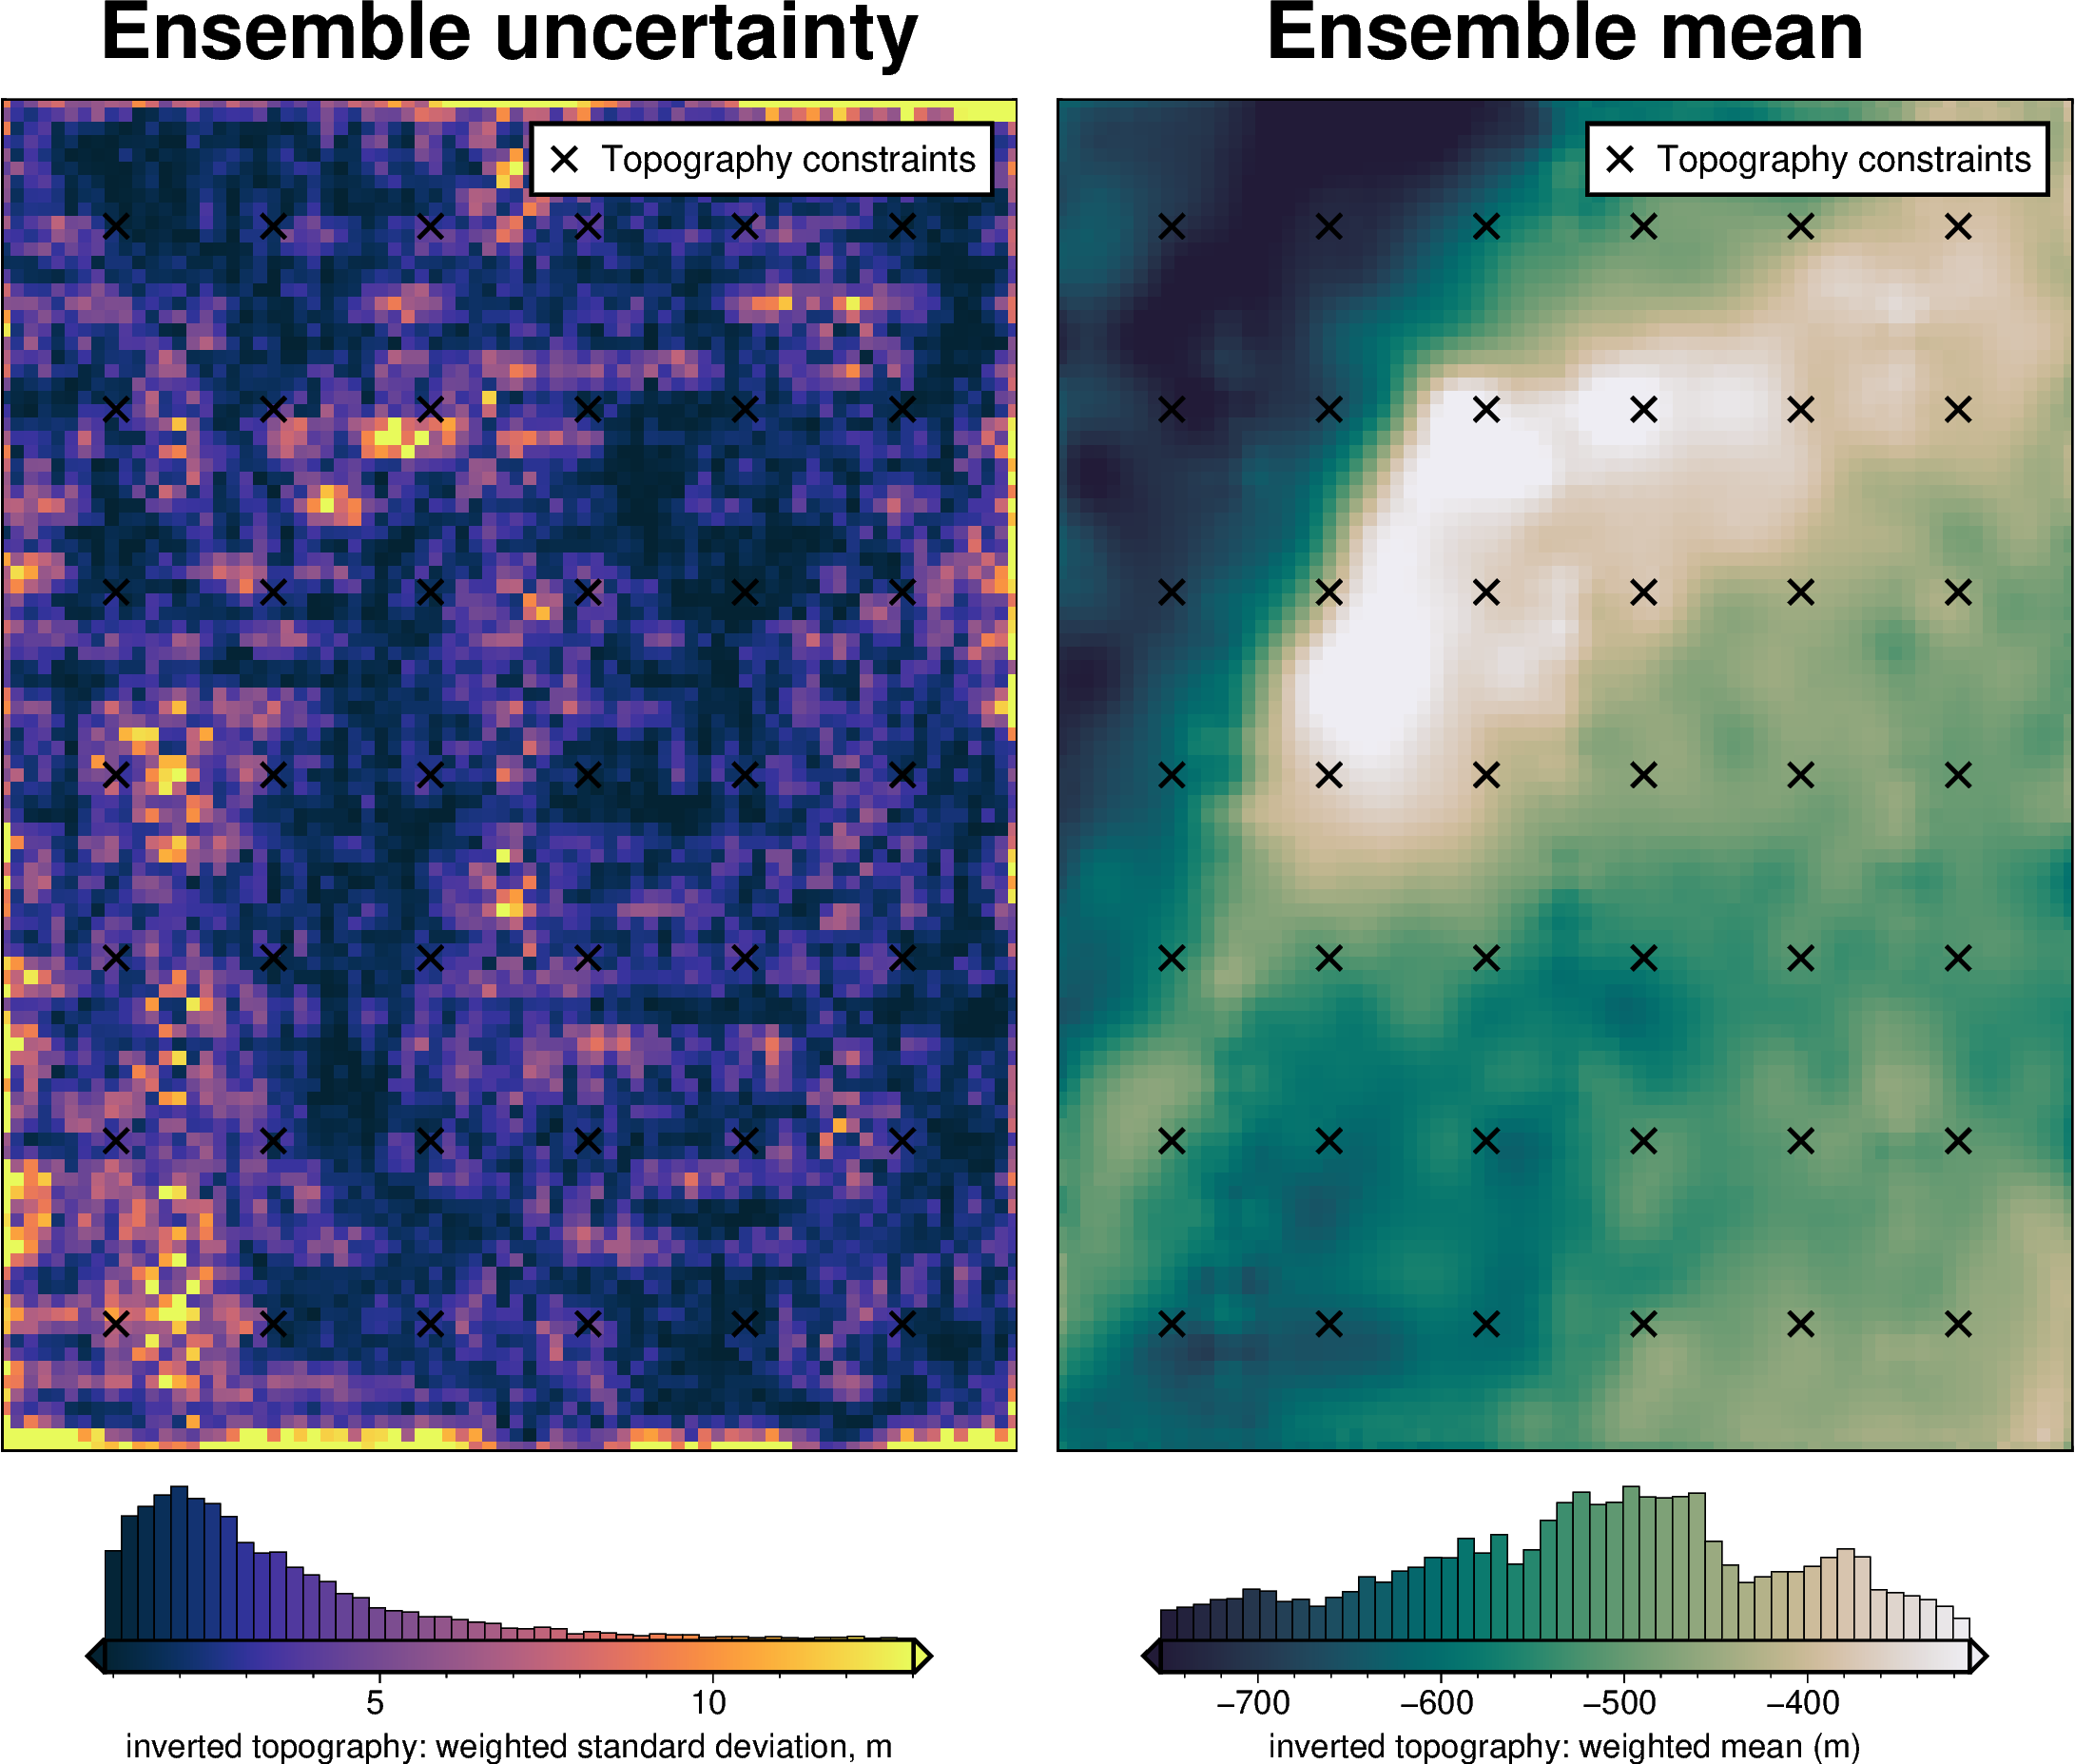
grav_grid = grav_df.set_index(["northing", "easting"]).to_xarray()
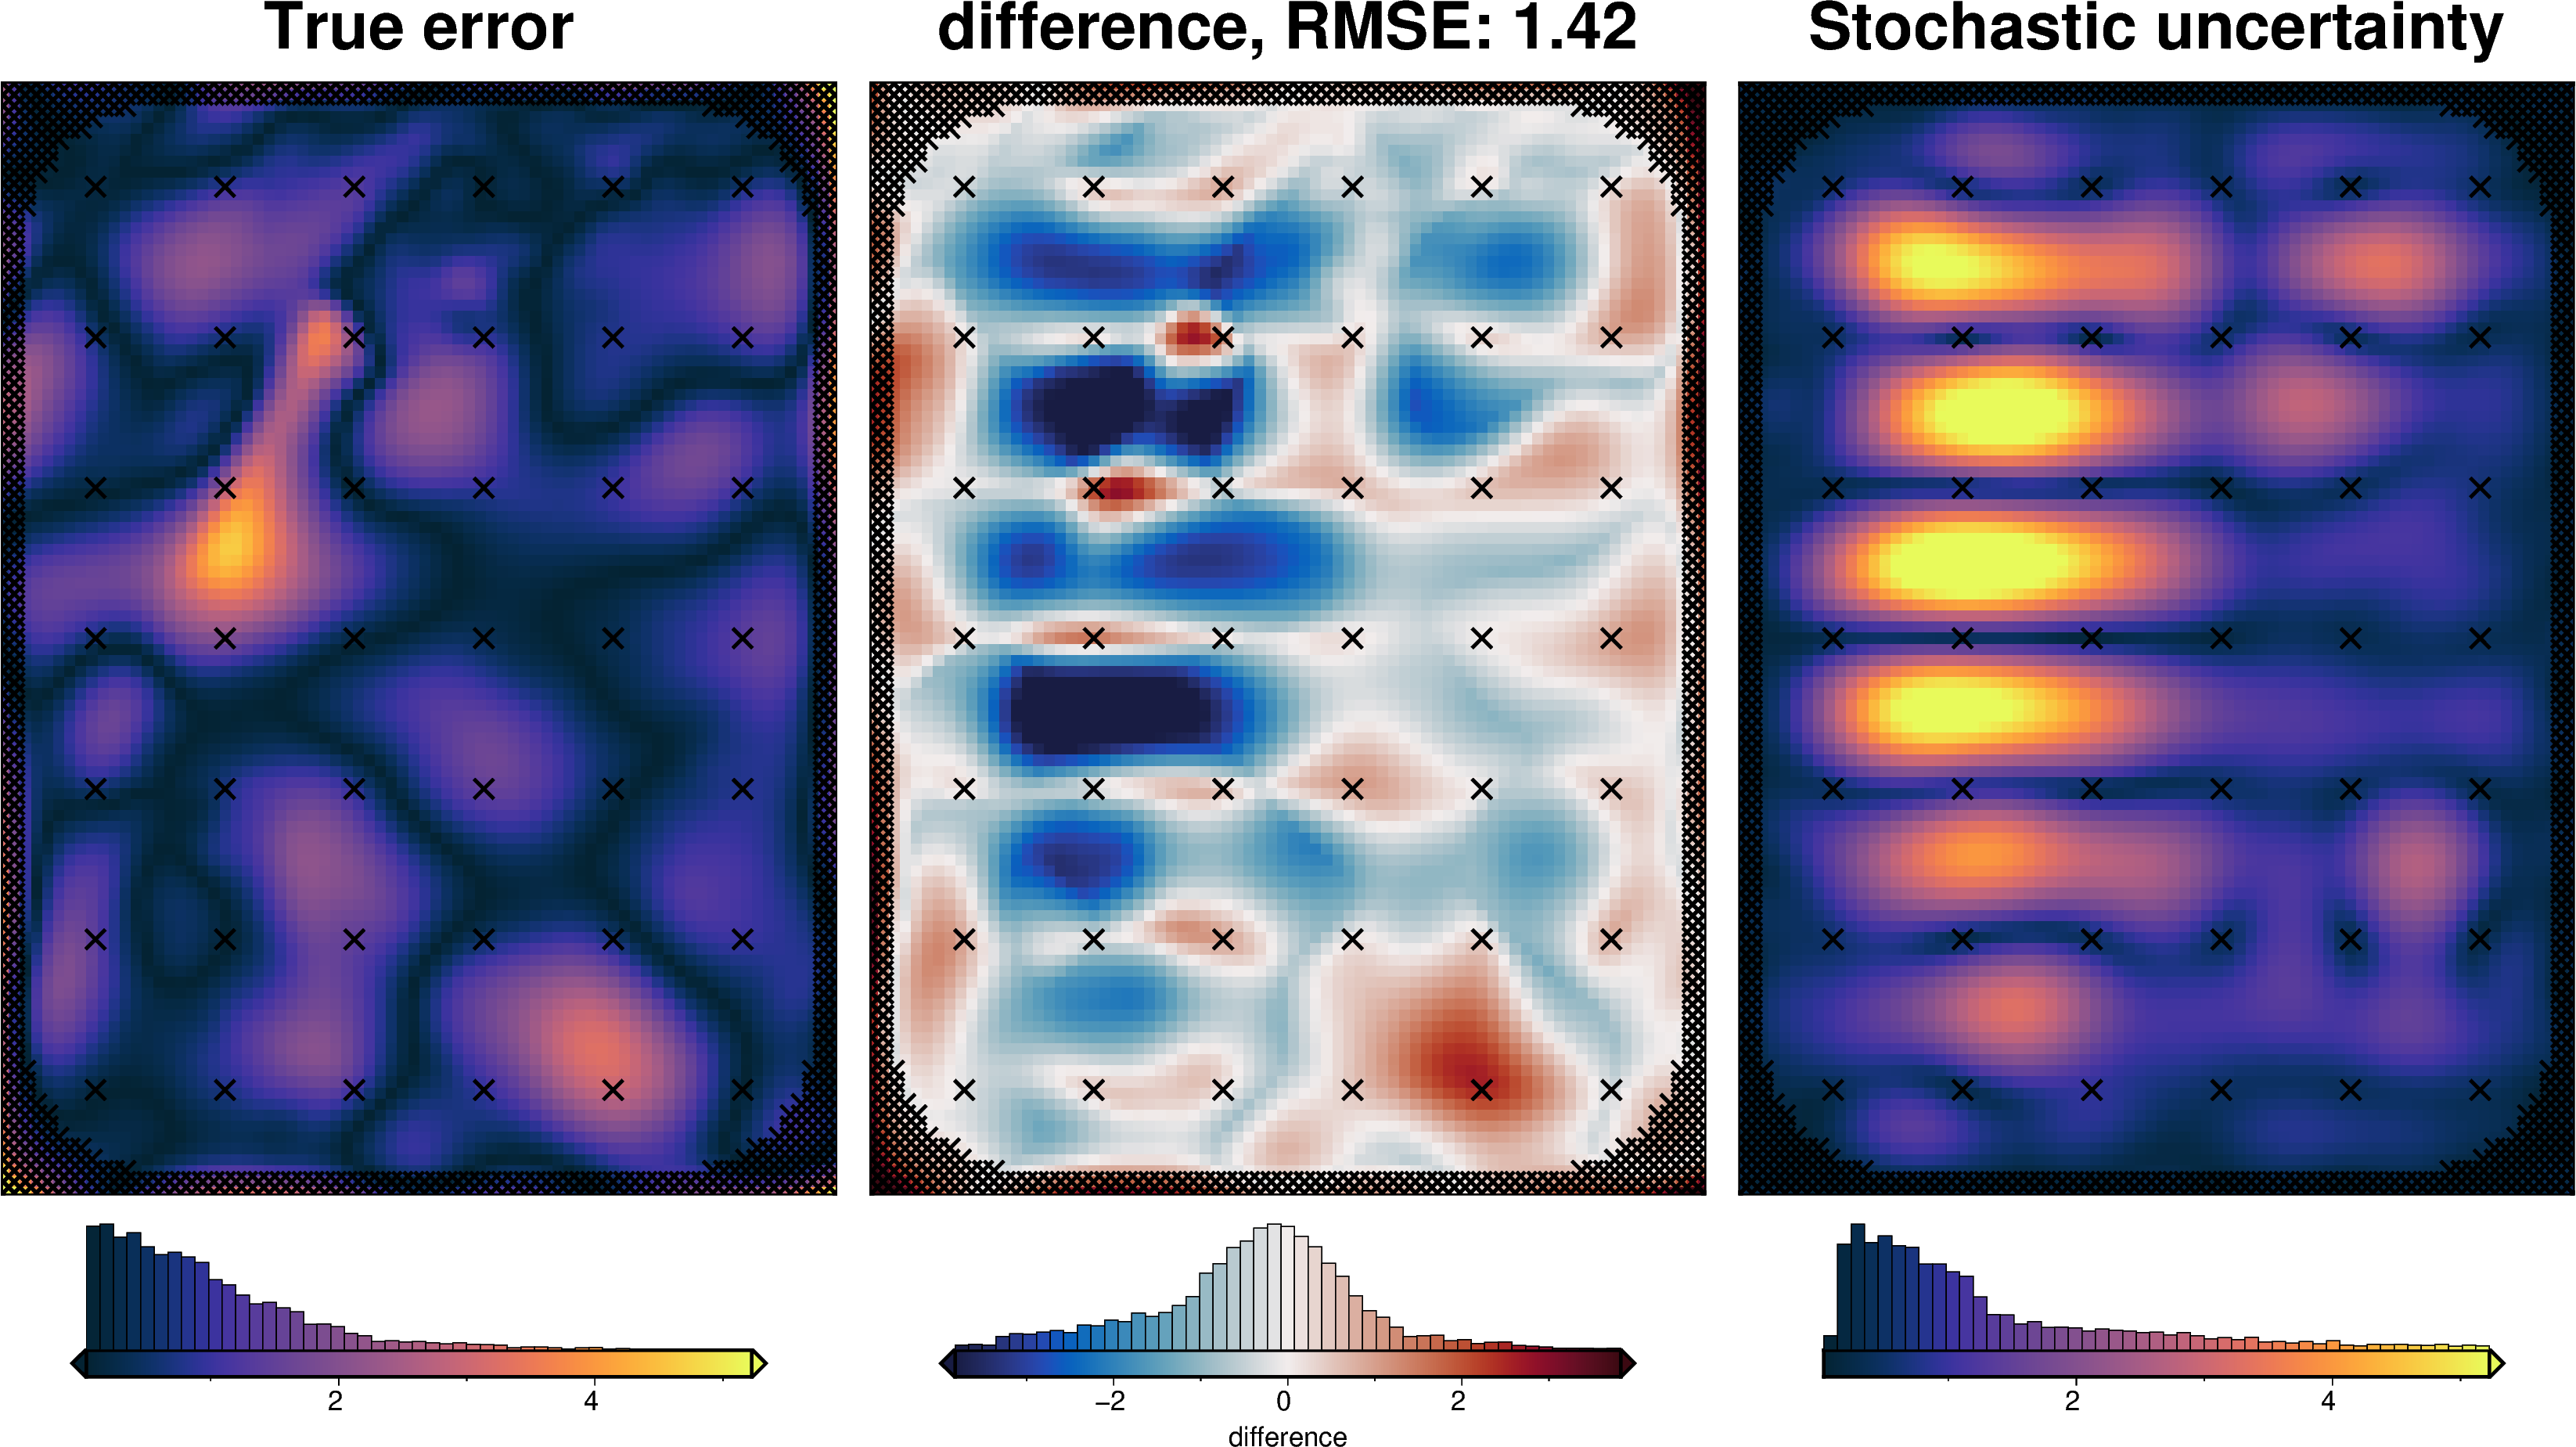
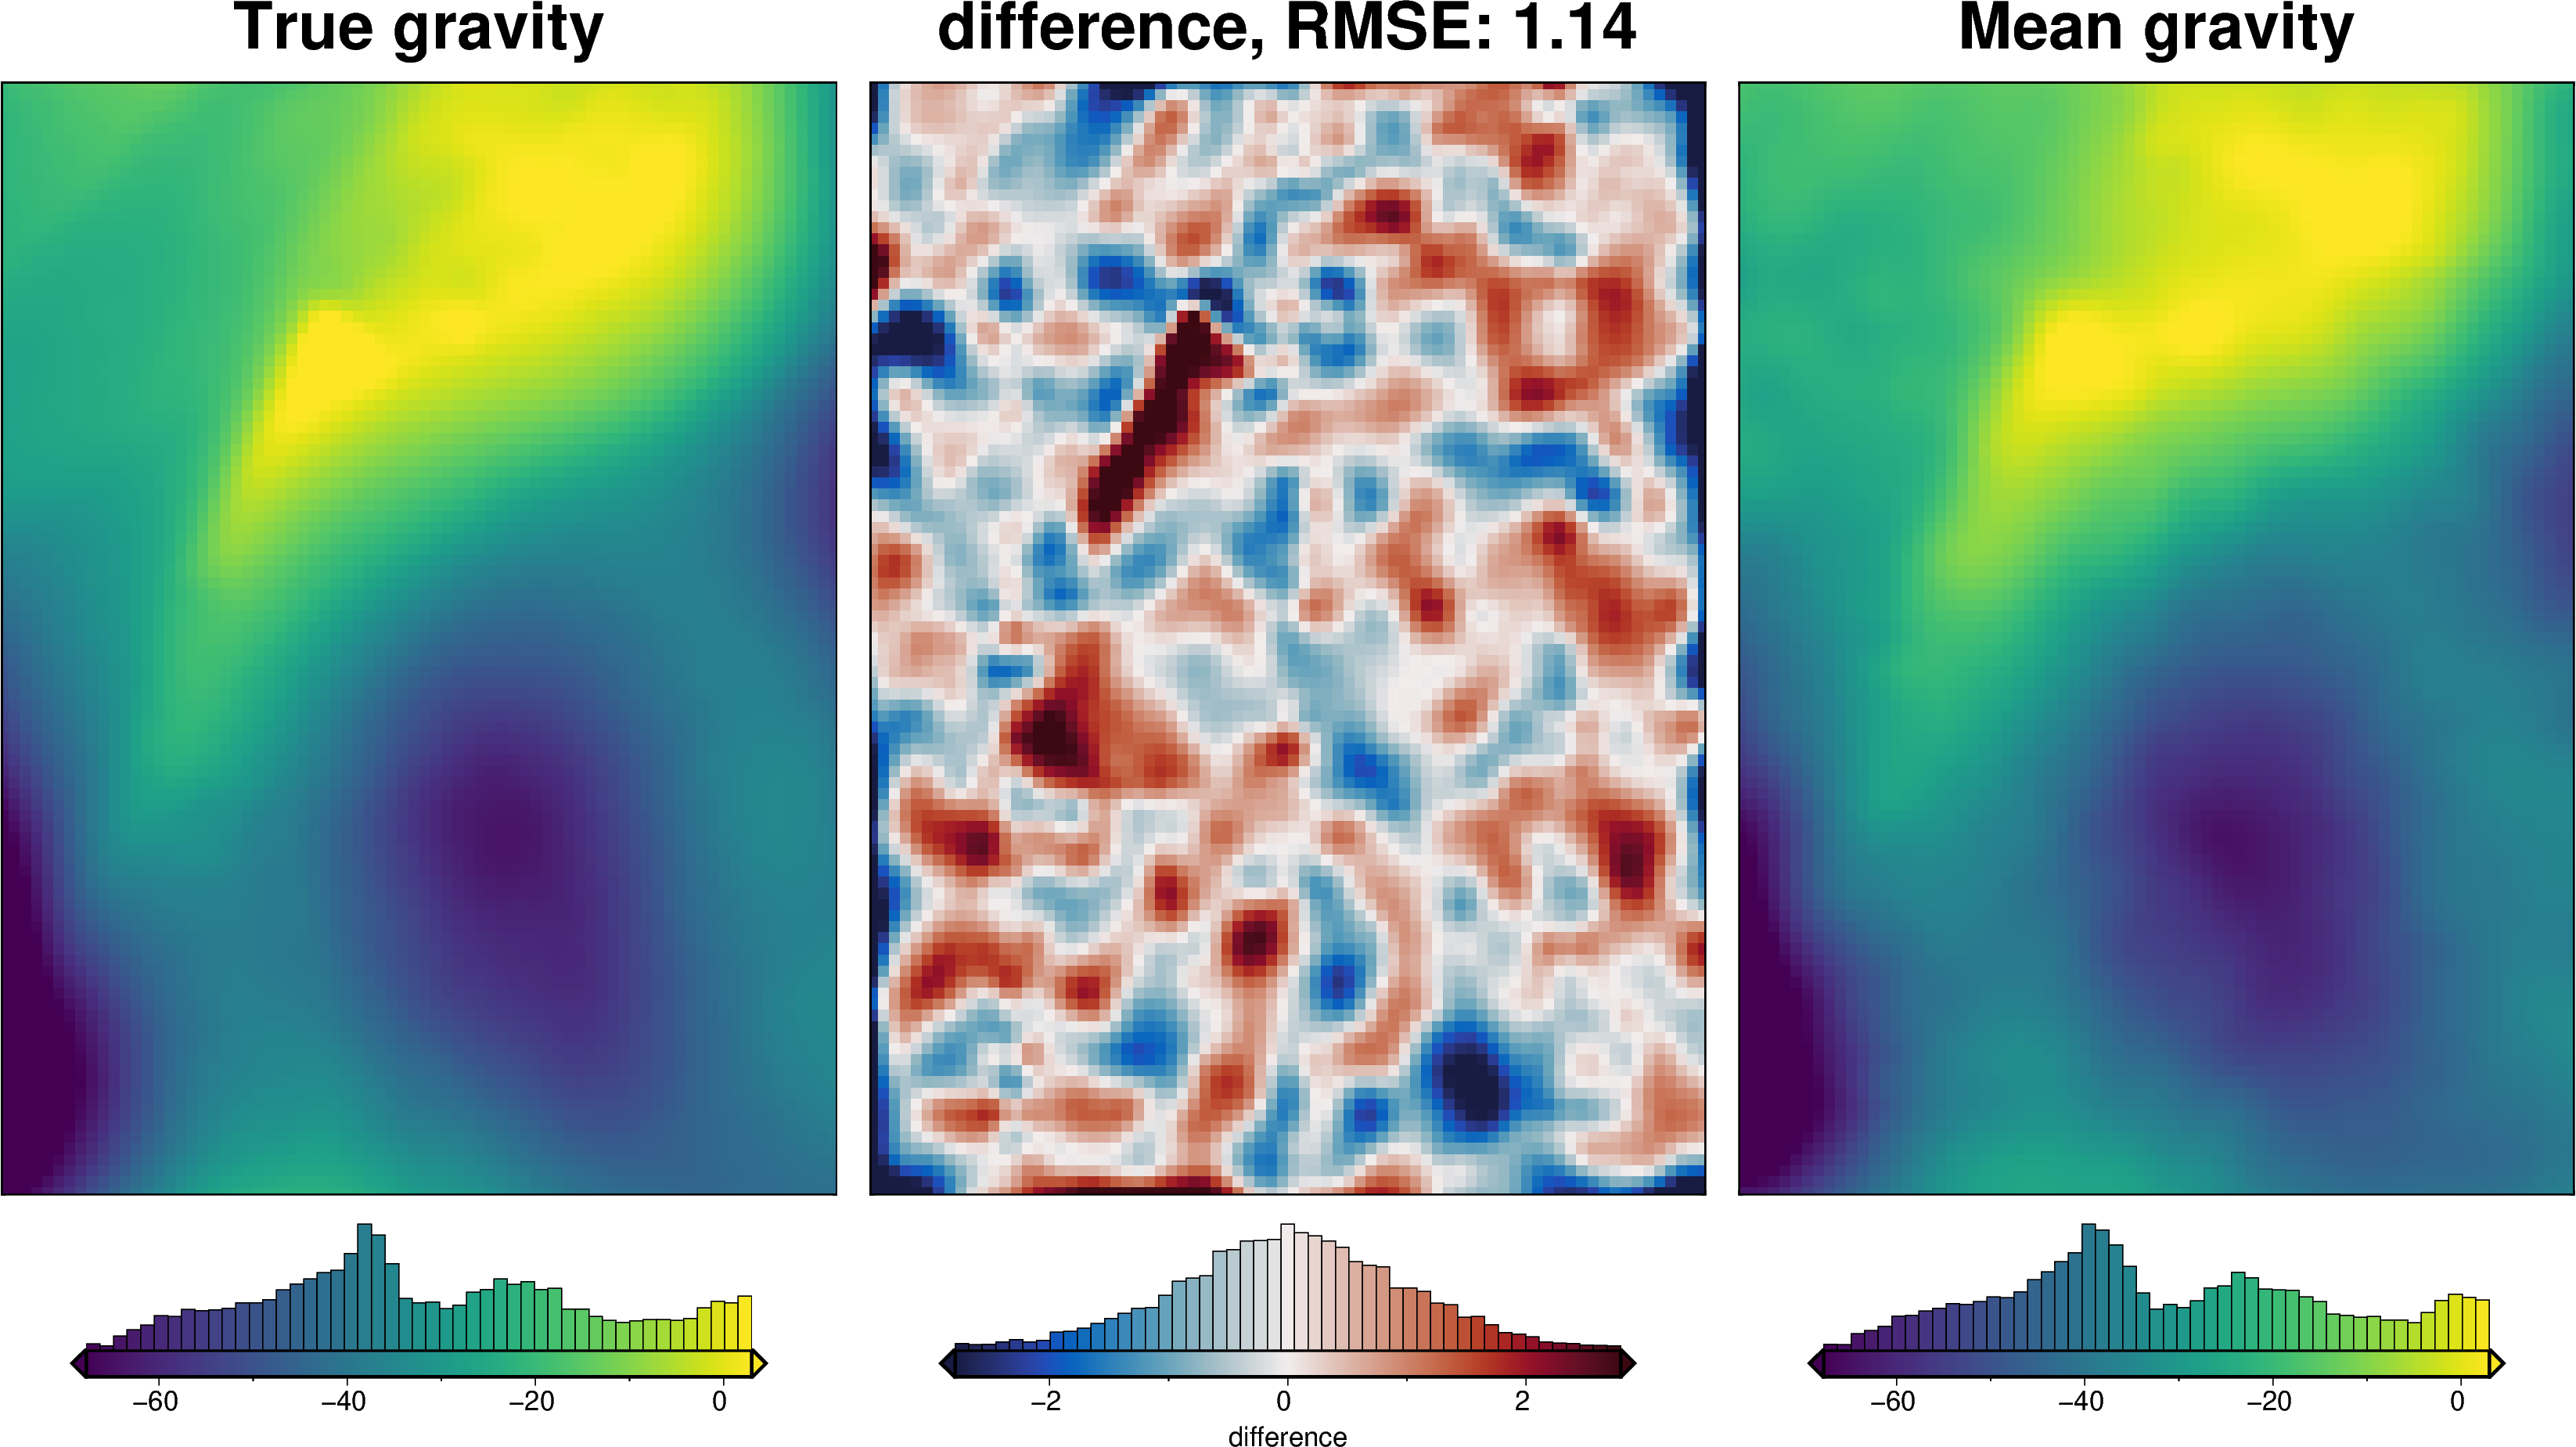
_ = polar_utils.grd_compare(
grav_grid.gravity_anomaly,
grav_grid.gravity_anomaly_eqs_mean,
region=inversion_region,
plot=True,
grid1_name="Determinist Equivalent Sources",
grid2_name="Stochastic Equivalent Sources",
robust=True,
hist=True,
inset=False,
verbose="q",
title="difference",
grounding_line=False,
)
maps.plot_grd(
grav_grid.eqs_uncert,
region=inversion_region,
fig_height=10,
title="Stochastic uncertainty",
cmap="thermal",
hist=True,
robust=True,
cbar_label="mGal",
)

[73]:

[74]:
# update grav_df and rename columns
grav_df_eqs = grav_df.copy()
grav_df_eqs = grav_df_eqs.rename(
columns={
"gravity_anomaly": "gravity_anomaly_deterministic",
"uncert": "uncert_constant",
}
)
grav_df_eqs["gravity_anomaly"] = grav_df_eqs.gravity_anomaly_eqs_mean
grav_df_eqs["uncert"] = grav_df_eqs.eqs_uncert
uncert_kwargs["grav_df"] = grav_df_eqs
[75]:
grav_df_eqs = regional.regional_separation(
grav_df=grav_df_eqs,
**new_regional_grav_kwargs,
)
# kwargs to reuse for all uncertainty analyses
eqs_uncert_kwargs = dict(
grav_df=grav_df_eqs,
density_contrast=best_density_contrast,
zref=zref,
starting_prisms=starting_prisms,
starting_topography=starting_bathymetry,
regional_grav_kwargs=new_regional_grav_kwargs,
**kwargs,
)
[76]:
# save to csv
grav_df_eqs.to_csv(f"{fpath}_grav_df.csv", index=False)
[77]:
fname = f"{fpath}_uncertainty_eq_sources"
# delete files if already exist
for p in pathlib.Path().glob(f"{fname}*"):
p.unlink(missing_ok=True)
uncert_eq_sources_results = uncertainty.full_workflow_uncertainty_loop(
fname=fname,
runs=10,
sample_gravity=True,
**eqs_uncert_kwargs,
)
stats_ds = synth_plotting.uncert_plots(
uncert_eq_sources_results,
inversion_region,
bathymetry,
deterministic_bathymetry=final_topography,
constraint_points=constraint_points[constraint_points.inside],
weight_by="constraints",
)

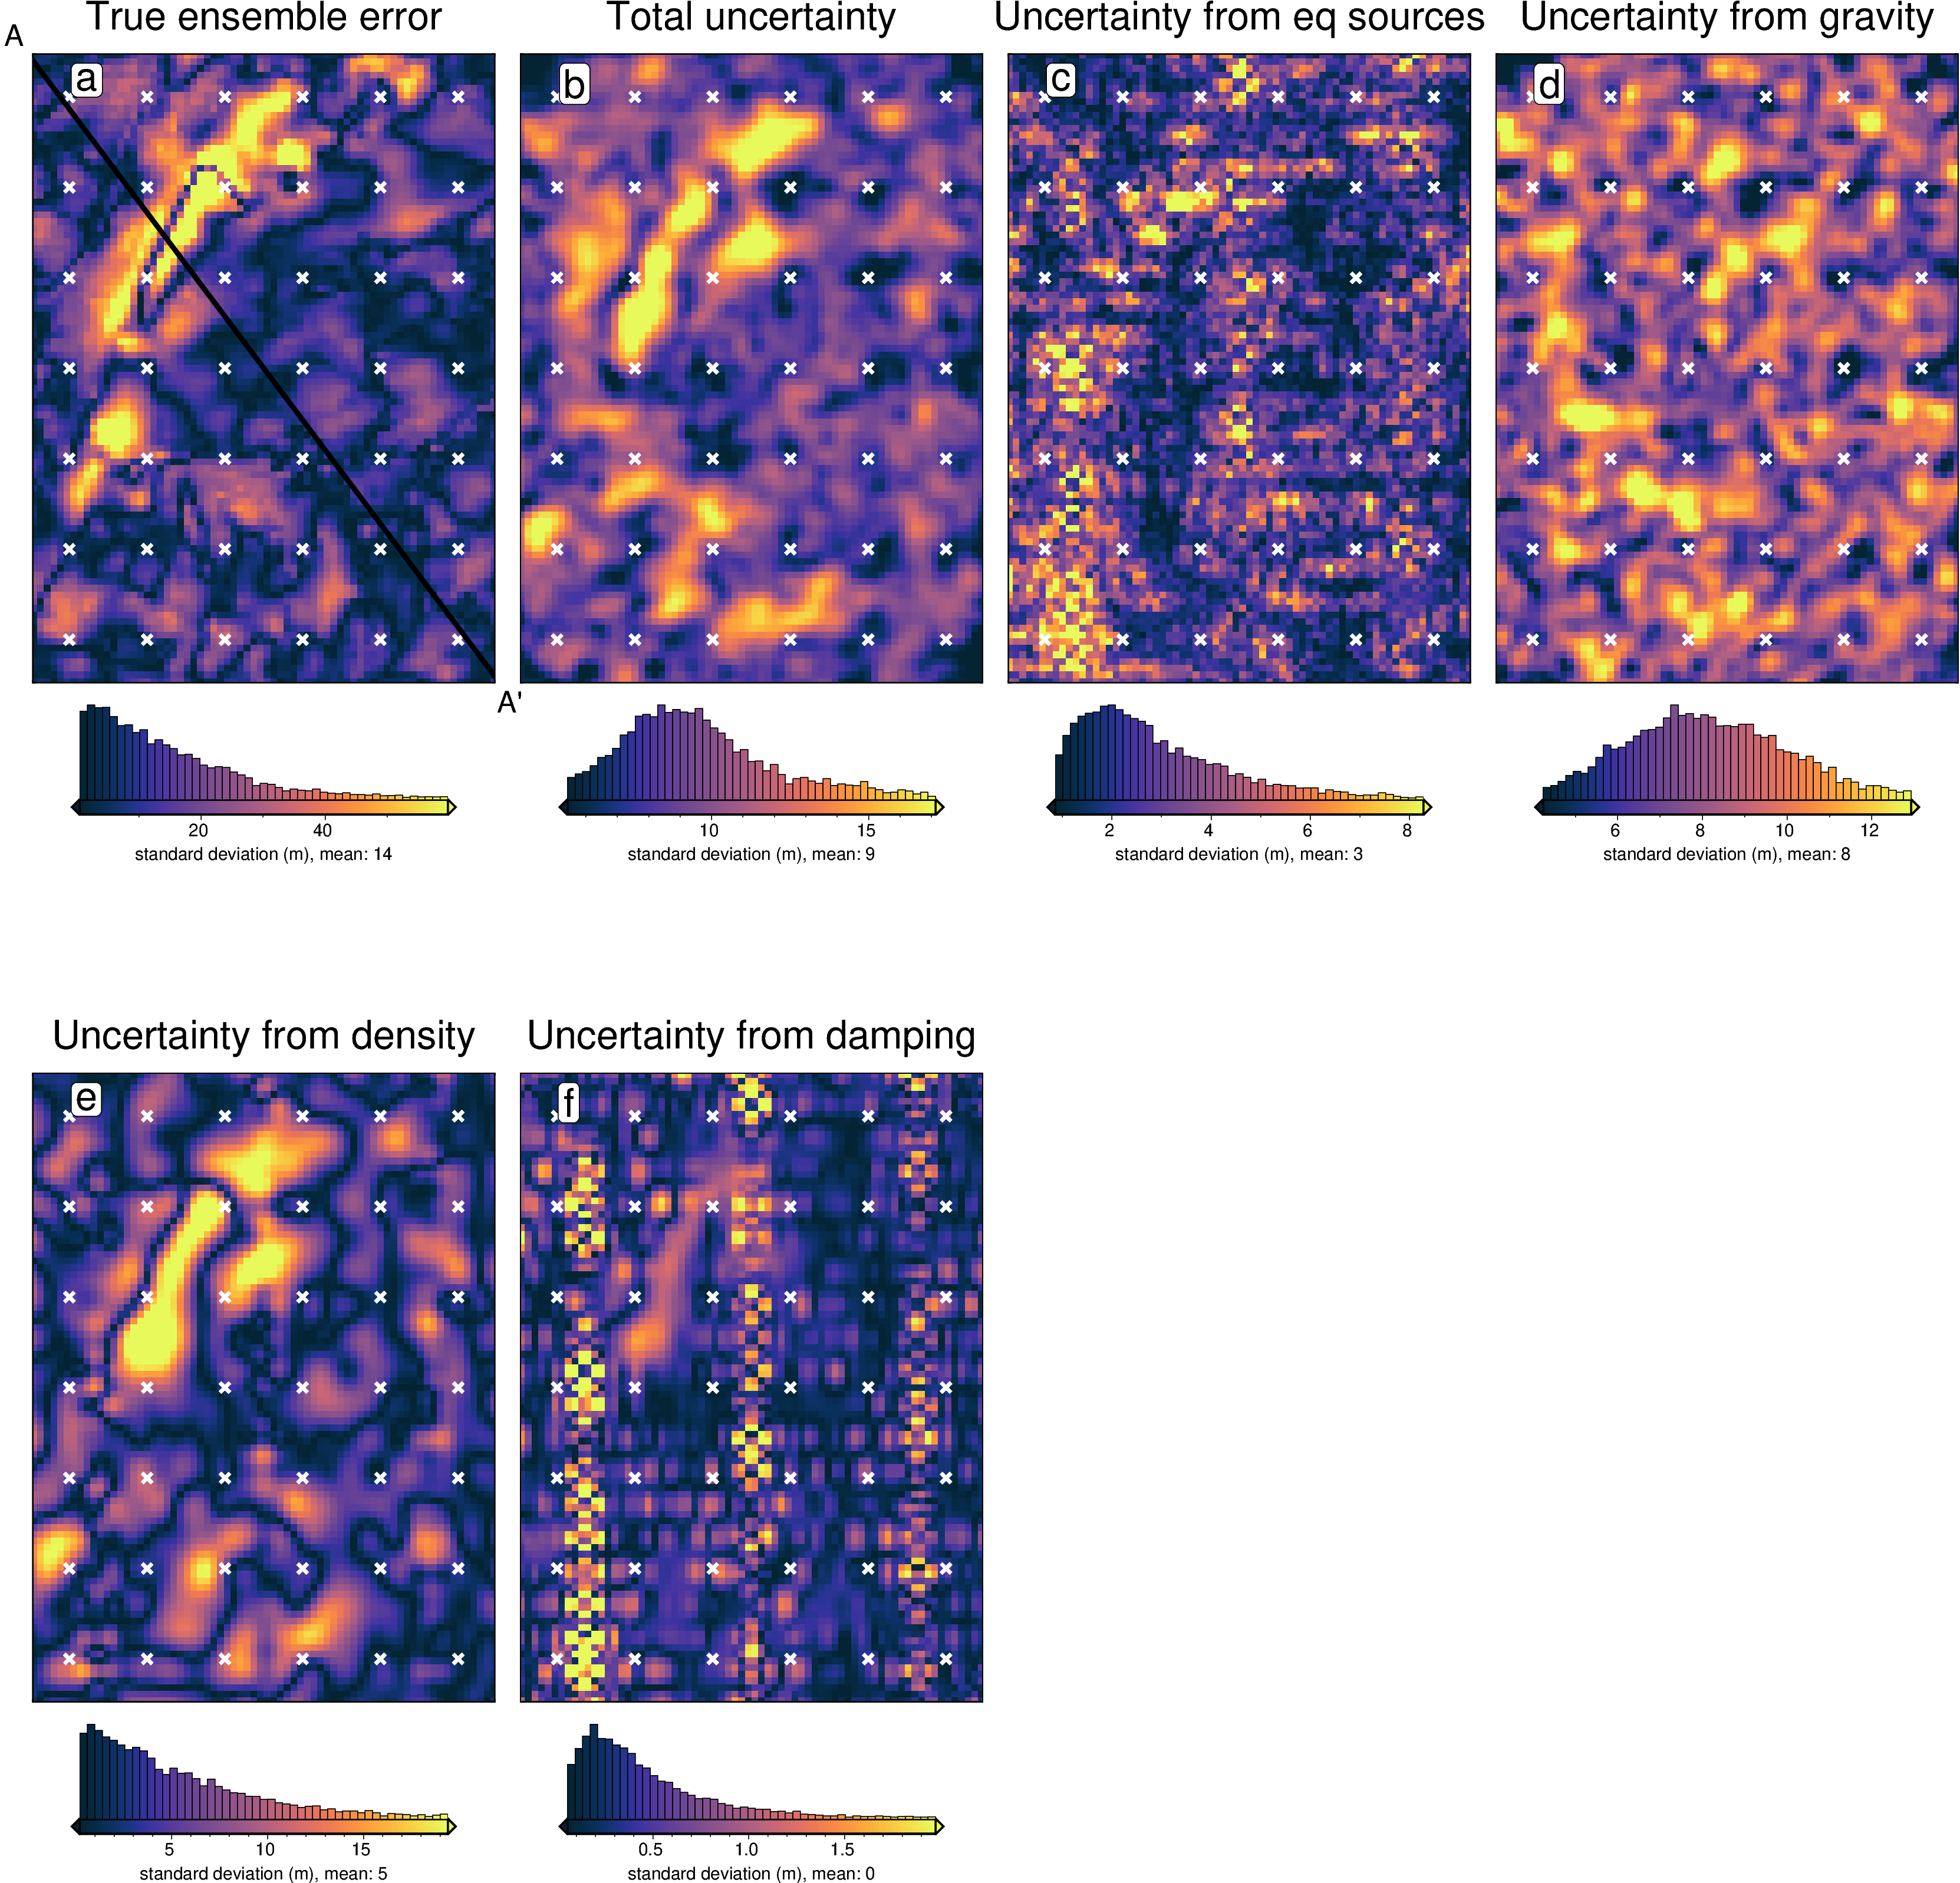
Total uncertainty
The total uncertainty includes uncertainty arising from several source. Below we list these and state how they are accounted for:
solver damping value -> solver_dict
density contrast value -> density_dict
random errors in the constraint point depths -> not accounted for
random errors in the gravity data -> point-by-point sampling of gravity data with constant estimated uncertainty value
errors from interpolating flight lines into a grid -> standard deviation of equivalent source gridding ensemble used for point-by-point uncertainty
errors from regional field estimation -> regional_misfit_parameter_dict
[78]:
# make min gravity uncertainty the value used to contaminate the original grid
grav_df_eqs["uncert"] = np.maximum(grav_df_eqs.uncert, gravity_noise)
grav_df_eqs = regional.regional_separation(
grav_df=grav_df_eqs,
**new_regional_grav_kwargs,
)
# kwargs to reuse for all uncertainty analyses
eqs_uncert_kwargs = dict(
grav_df=grav_df_eqs,
density_contrast=best_density_contrast,
zref=zref,
starting_prisms=starting_prisms,
starting_topography=starting_bathymetry,
regional_grav_kwargs=new_regional_grav_kwargs,
**kwargs,
)
[79]:
grav_grid = grav_df_eqs.set_index(["northing", "easting"]).to_xarray()
maps.plot_grd(
grav_grid.uncert,
region=inversion_region,
fig_height=10,
title="Stochastic uncertainty",
cmap="thermal",
hist=True,
robust=True,
cbar_label="mGal",
)
makecpt [ERROR]: Option T: min >= max
supplied min value is greater or equal to max value
Grid/points are a constant value, can't make a colorbar histogram!
[79]:

[80]:
fname = f"{fpath}_uncertainty_full"
# delete files if already exist
for p in pathlib.Path().glob(f"{fname}*"):
p.unlink(missing_ok=True)
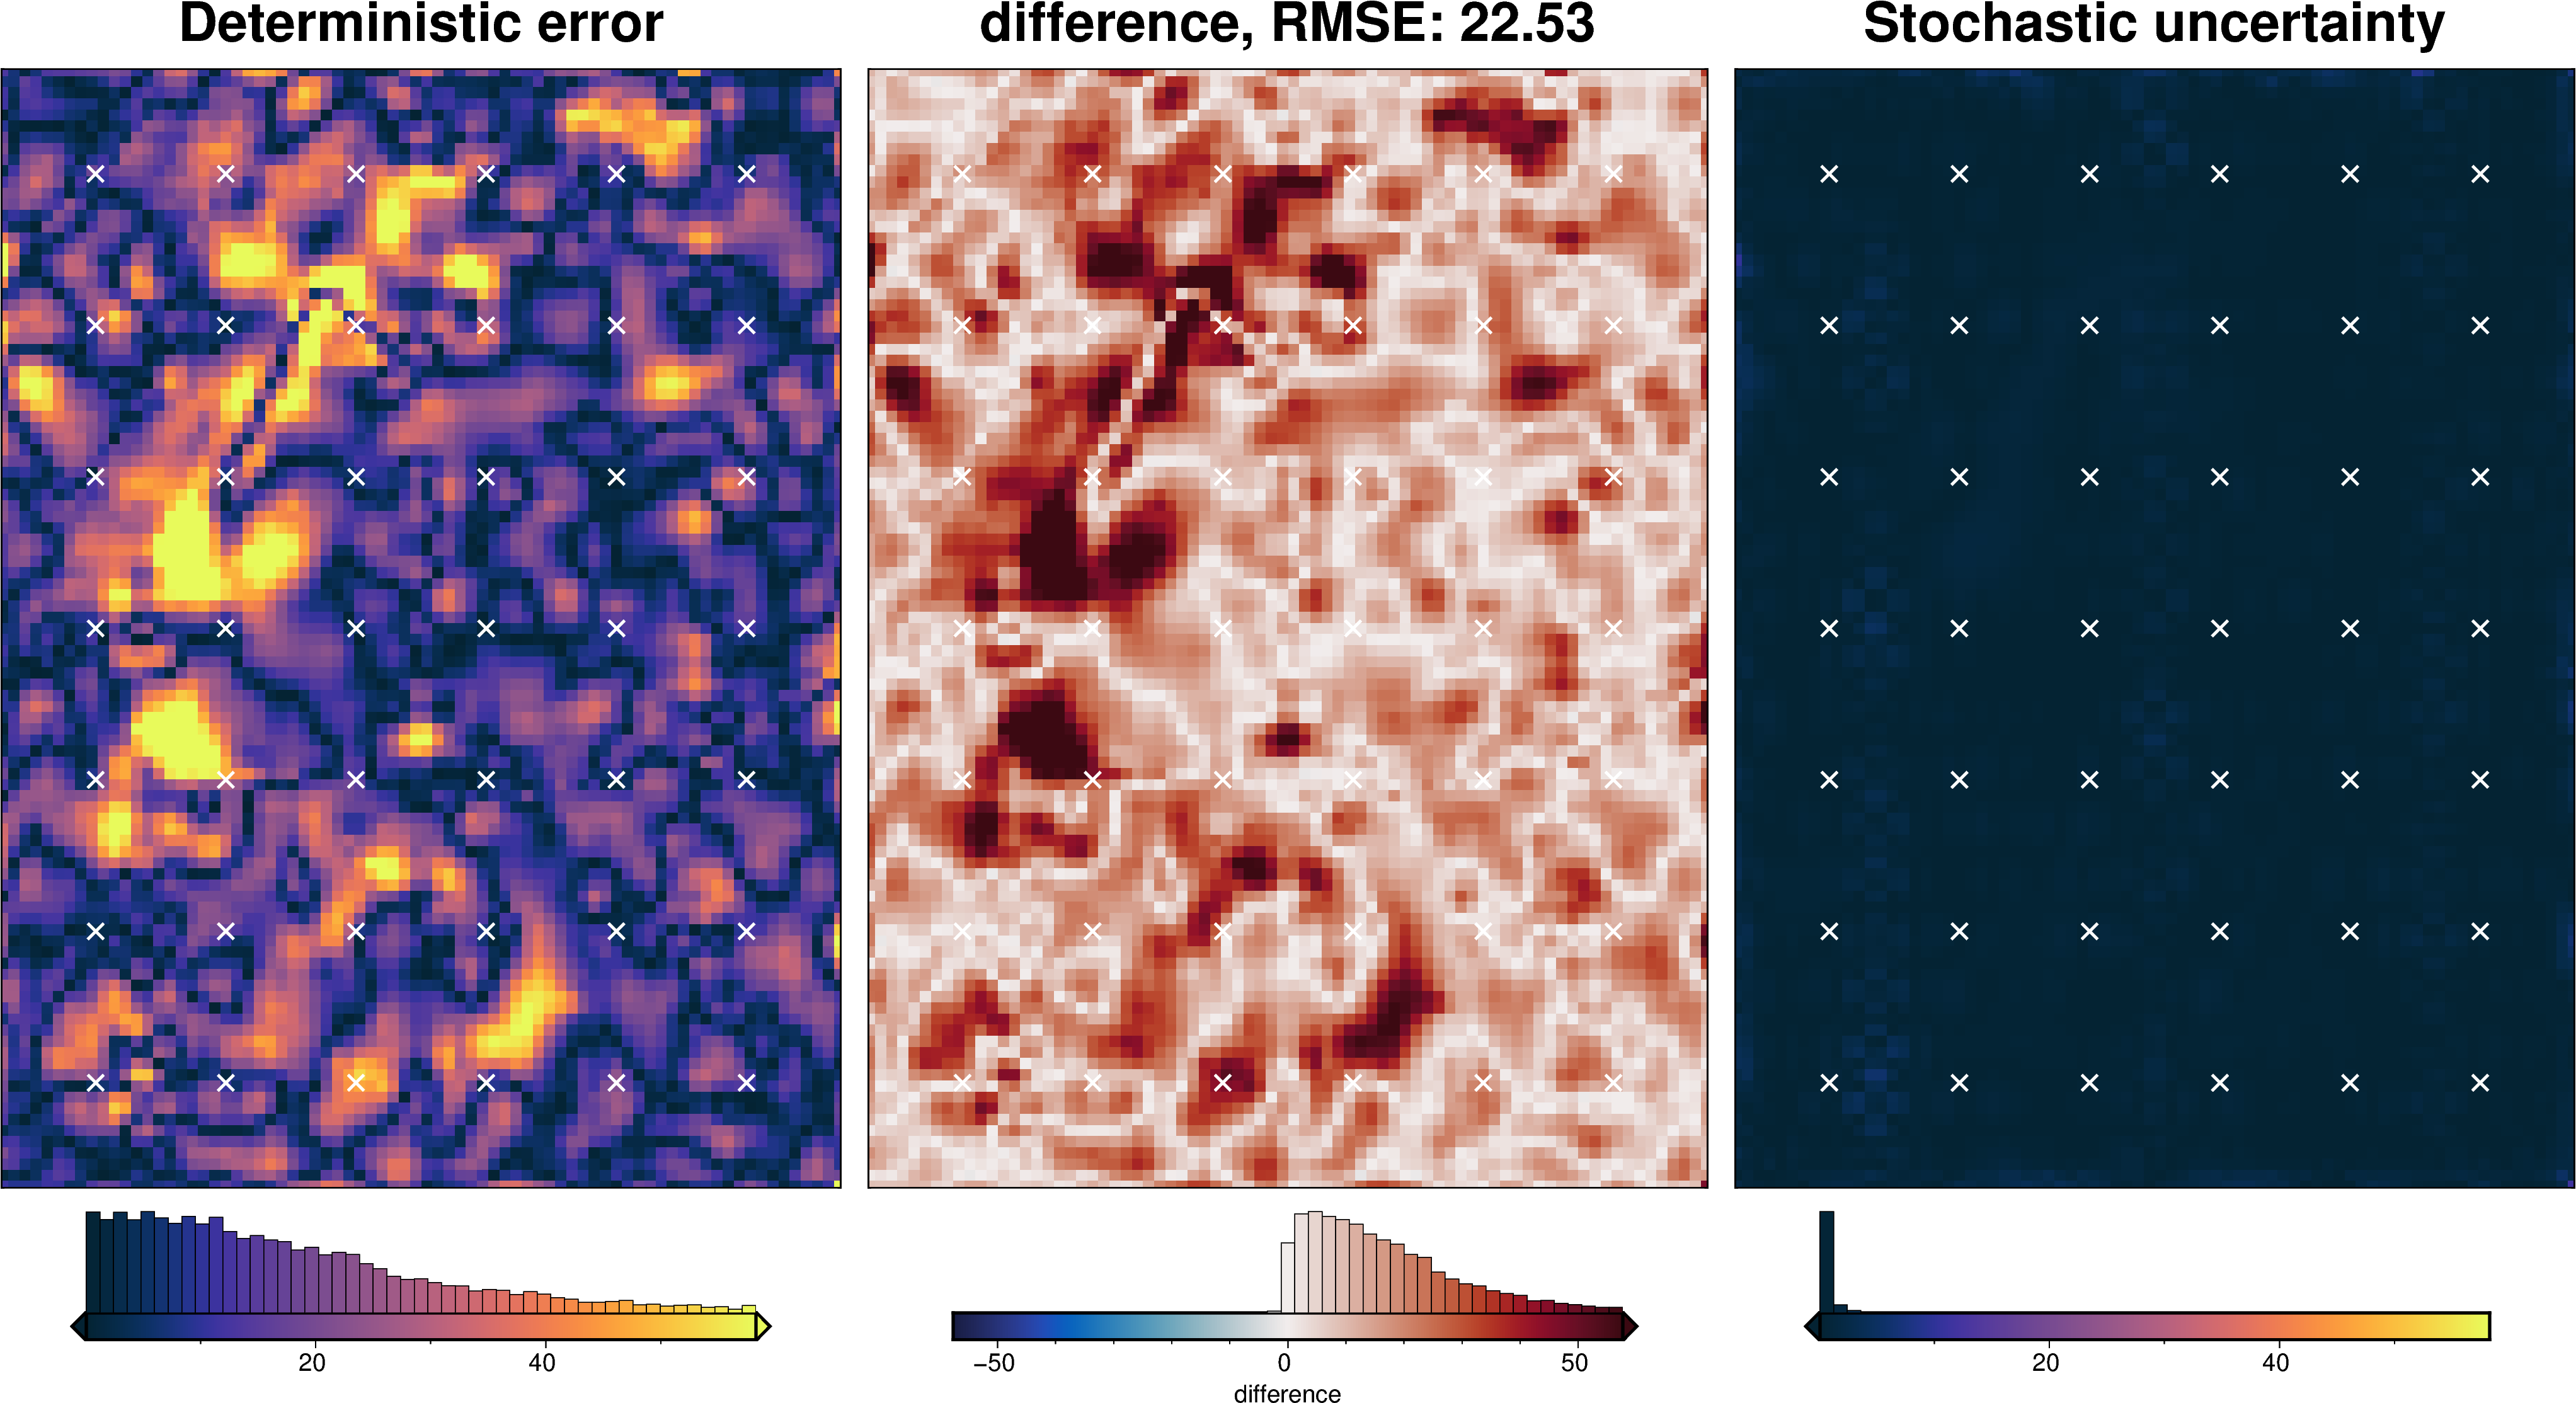
uncert_results = uncertainty.full_workflow_uncertainty_loop(
fname=fname,
runs=20,
sample_gravity=True,
gravity_filter_width=filt_width,
parameter_dict=solver_dict | density_dict,
**eqs_uncert_kwargs,
)
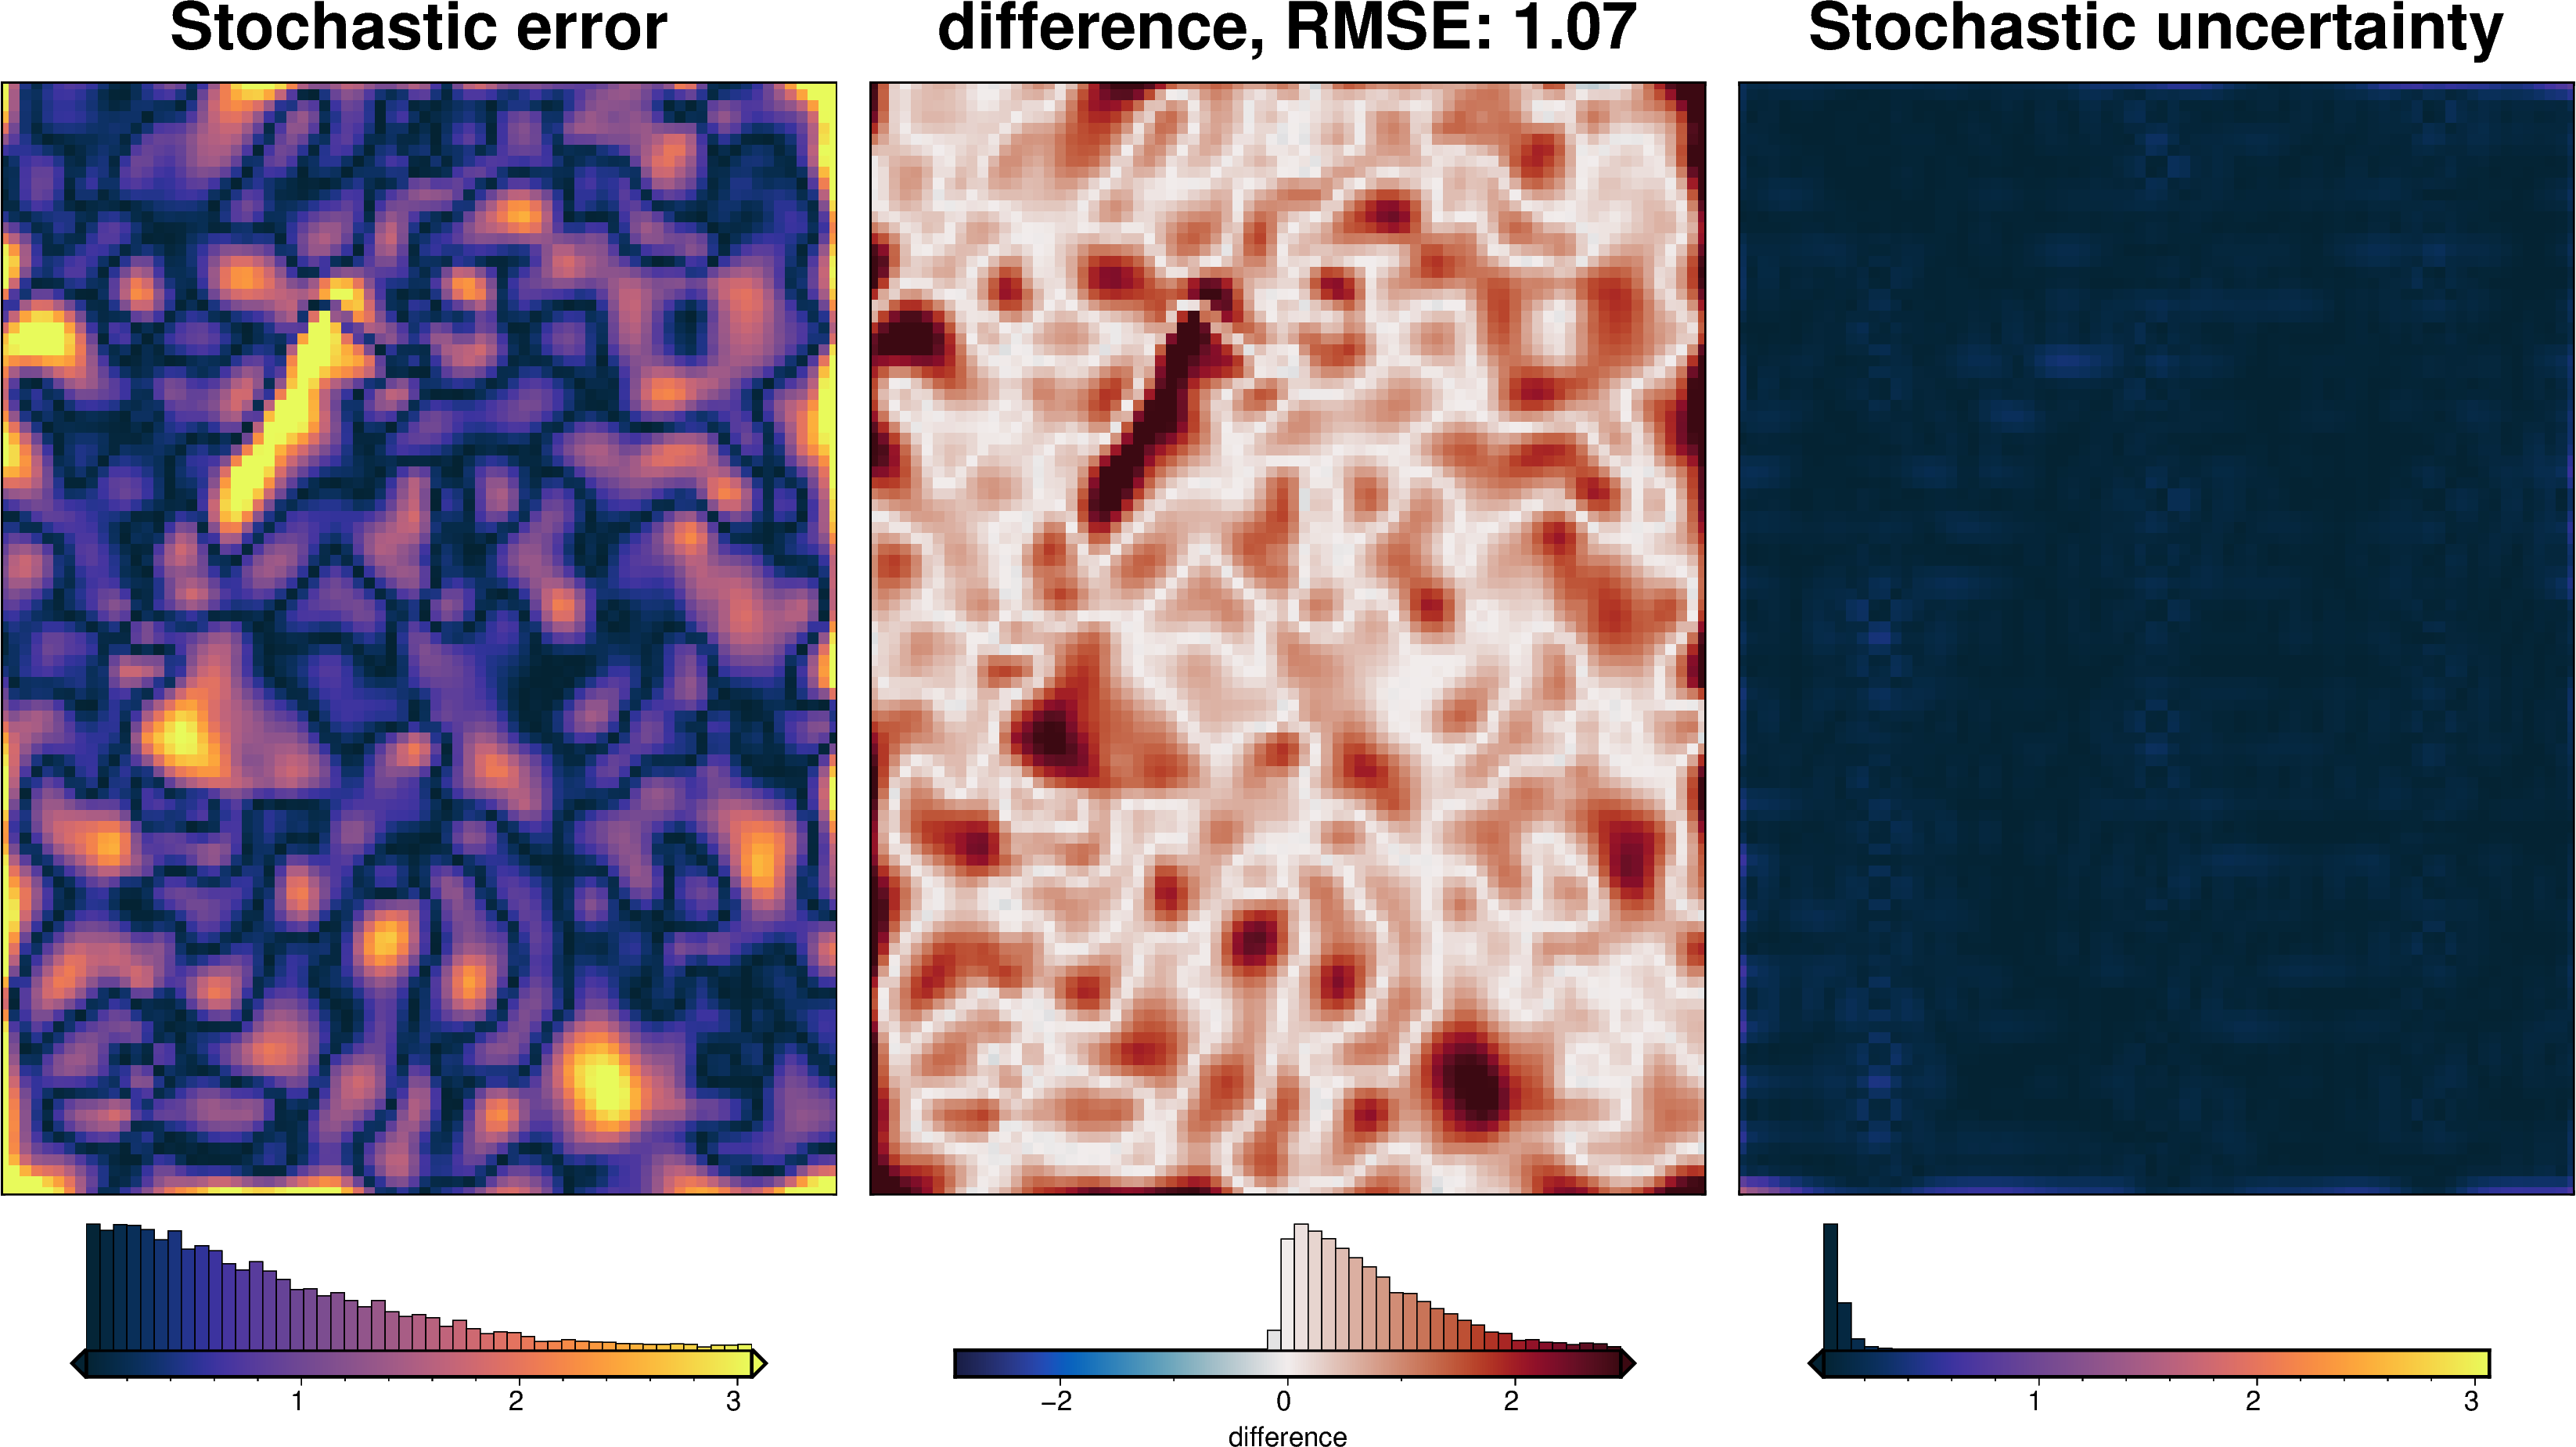
stats_ds = synth_plotting.uncert_plots(
uncert_results,
inversion_region,
bathymetry,
deterministic_bathymetry=final_topography,
constraint_points=constraint_points,
weight_by="constraints",
)
plotting.plot_latin_hypercube(
uncert_results[-1],
)
Comparing results
[81]:
results = [
uncert_results,
uncert_eq_sources_results,
uncert_grav_results,
uncert_density_results,
uncert_damping_results,
]
names = [
"full",
"eq_sources",
"grav",
"density",
"damping",
]
# get cell-wise stats for each ensemble
stats = []
for r in results:
ds = uncertainty.merged_stats(
results=r,
plot=False,
constraints_df=constraint_points,
weight_by="constraints",
region=inversion_region,
)
stats.append(ds)
[82]:
# get the standard deviation of the ensemble of ensembles
stdevs = []
for i, s in enumerate(stats):
stdevs.append(s.weighted_stdev.rename(f"{names[i]}_stdev"))
merged = xr.merge(stdevs)
merged
[82]:
<xarray.Dataset> Size: 308kB
Dimensions: (northing: 101, easting: 76)
Coordinates:
* northing (northing) float64 808B -1.6e+06 -1.598e+06 ... -1.4e+06
* easting (easting) float64 608B -4e+04 -3.8e+04 ... 1.1e+05
Data variables:
full_stdev (northing, easting) float64 61kB 17.8 9.475 ... 17.19
eq_sources_stdev (northing, easting) float64 61kB 47.36 68.75 ... 29.12
grav_stdev (northing, easting) float64 61kB 18.08 7.531 ... 16.06
density_stdev (northing, easting) float64 61kB 0.5822 1.061 ... 7.357
damping_stdev (northing, easting) float64 61kB 2.34 1.136 ... 1.722 7.72[83]:
titles = [
"True ensemble error",
"Total uncertainty",
"Uncertainty from eq sources",
"Uncertainty from gravity",
"Uncertainty from density",
"Uncertainty from damping",
]
grids = list(merged.data_vars.values())
grids.insert(0, np.abs(stats[0].weighted_mean - bathymetry))
cpt_lims = polar_utils.get_min_max(
grids[0],
robust=True,
)
fig_height = 9
for i, g in enumerate(grids):
xshift_amount = 1
if i == 0:
fig = None
origin_shift = "initialize"
elif i == 4:
origin_shift = "both_shift"
xshift_amount = -3
else:
origin_shift = "xshift"
fig = maps.plot_grd(
grid=g,
fig_height=fig_height,
region=vd.pad_region(inversion_region, -3 * spacing),
title=titles[i],
title_font="16p,Helvetica,black",
cmap="thermal",
robust=True,
cbar_label=f"standard deviation (m), mean: {int(np.nanmean(g))}",
hist=True,
hist_bin_num=50,
fig=fig,
origin_shift=origin_shift,
xshift_amount=xshift_amount,
yshift_amount=-1.1,
)
fig.plot(
x=constraint_points[constraint_points.inside].easting,
y=constraint_points[constraint_points.inside].northing,
style="x.2c",
fill="white",
pen="1.5p,white",
)
fig.text(
position="TL",
text=f"{string.ascii_lowercase[i]}",
fill="white",
pen=True,
font="16p,Helvetica,black",
offset="j.6/.2",
clearance="+tO",
no_clip=True,
)
if i == 0:
# plot profiles location, and endpoints on map
start = [inversion_region[0], inversion_region[3]]
stop = [inversion_region[1], inversion_region[2]]
fig.plot(
vd.line_coordinates(start, stop, size=100),
pen="2p,black",
)
fig.text(
x=start[0],
y=start[1],
text="A",
fill="white",
font="12p,Helvetica,black",
justify="CM",
clearance="+tO",
no_clip=True,
)
fig.text(
x=stop[0],
y=stop[1],
text="A' ",
fill="white",
font="12p,Helvetica,black",
justify="CM",
clearance="+tO",
no_clip=True,
)
fig.show()
[84]:
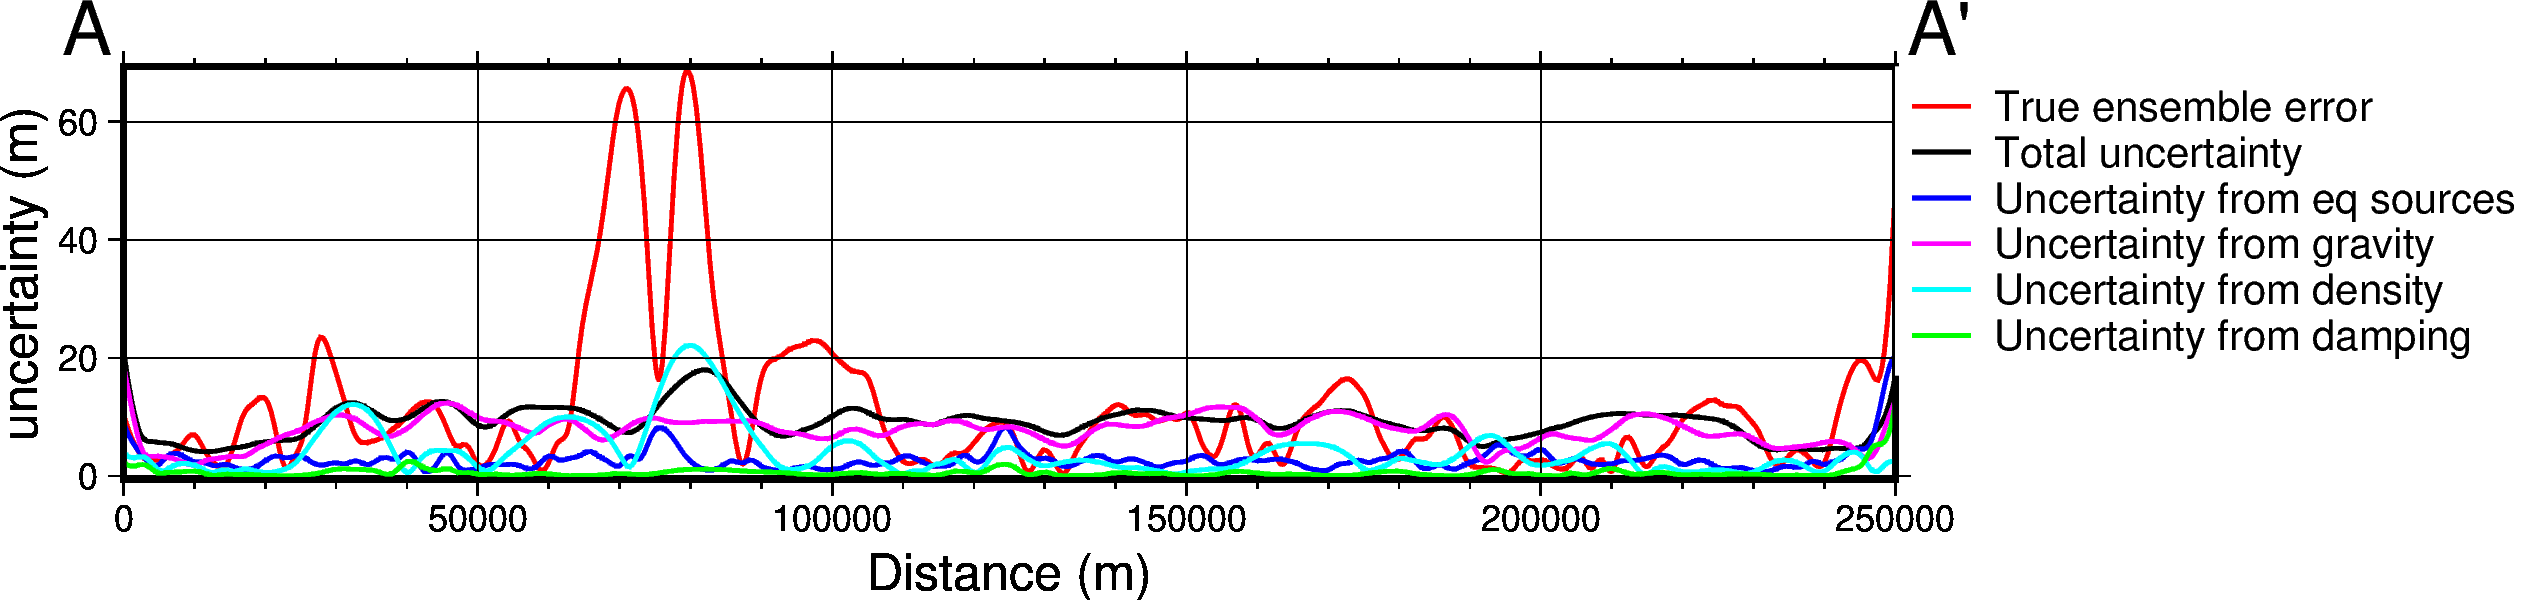
data_dict = profiles.make_data_dict(
names=titles,
grids=grids,
colors=[
"red",
"black",
"blue",
"magenta",
"cyan",
"green",
"purple",
"gray",
],
)
fig, df_data = profiles.plot_data(
"points",
start=[inversion_region[0], inversion_region[3]],
stop=[inversion_region[1], inversion_region[2]],
num=10000,
fig_height=4,
fig_width=15,
data_dict=data_dict,
data_legend_loc="jTR+jTL",
data_legend_box="+gwhite",
data_buffer=0.01,
data_frame=["neSW", "xafg+lDistance (m)", "yag+luncertainty (m)"],
share_yaxis=True,
start_label="A",
end_label="A' ",
)
fig.show()
grdtrack [WARNING]: Some input points were outside the grid domain(s).
grdtrack [WARNING]: Some input points were outside the grid domain(s).
grdtrack [WARNING]: Some input points were outside the grid domain(s).
grdtrack [WARNING]: Some input points were outside the grid domain(s).
grdtrack [WARNING]: Some input points were outside the grid domain(s).
grdtrack [WARNING]: Some input points were outside the grid domain(s).
[85]:
# save results
merged.to_netcdf(f"{fpath}_sensitivity.nc")
[86]:
stats_ds.to_netcdf(f"{fpath}_uncertainty.nc")