Analysis and figures
for Ensembles 1-4
[1]:
%load_ext autoreload
%autoreload 2
import logging
import math
import os
import pathlib

import matplotlib as mpl
import matplotlib.pyplot as plt
import numpy as np
import pandas as pd
import seaborn as sns
import xarray as xr
from invert4geom import utils
from polartoolkit import utils as polar_utils

import synthetic_bathymetry_inversion.plotting as synth_plotting
from synthetic_bathymetry_inversion import ice_shelf_stats, synthetic

os.environ["POLARTOOLKIT_HEMISPHERE"] = "south"

sns.set_theme()

logging.getLogger().setLevel(logging.INFO)
/home/sungw937/miniforge3/envs/synthetic_bathymetry_inversion/lib/python3.12/site-packages/UQpy/__init__.py:6: UserWarning:

pkg_resources is deprecated as an API. See https://setuptools.pypa.io/en/latest/pkg_resources.html. The pkg_resources package is slated for removal as early as 2025-11-30. Refrain from using this package or pin to Setuptools<81.
[2]:
# set grid parameters
spacing = 2e3
inversion_region = (-40e3, 110e3, -1600e3, -1400e3)

plot_region = inversion_region

true_density_contrast = 1476

bathymetry, _, _ = synthetic.load_synthetic_model(
    spacing=spacing,
    inversion_region=inversion_region,
    buffer=spacing * 10,
    zref=0,
    bathymetry_density_contrast=true_density_contrast,
    plot_topography=False,
    plot_gravity=False,
)

buffer_region = polar_utils.get_grid_info(bathymetry)[1]

# clip to inversion region
bathymetry = bathymetry.sel(
    easting=slice(plot_region[0], plot_region[1]),
    northing=slice(plot_region[2], plot_region[3]),
)
requested spacing (2000.0) is smaller than the original (5000.0).
[3]:
# get list of all Antarctic ice shelves
ice_shelves = ice_shelf_stats.get_ice_shelves()

print(f"Number of ice shelves: {len(ice_shelves)}")

ice_shelves
Number of ice shelves: 164
[3]:
| NAME | Regions | TYPE | geometry | area_km | |
|---|---|---|---|---|---|
| 0 | Ross | West | FL | POLYGON ((-240677.184 -678259.006, -240038.274... | 480428.37 |
| 1 | Ronne_Filchner | West | FL | POLYGON ((-1006734.891 880592.98, -1006335.923... | 427041.70 |
| 2 | Amery | East | FL | POLYGON ((2134701.422 618463.117, 2131452.011 ... | 60797.28 |
| 3 | LarsenC | Peninsula | FL | POLYGON ((-2235724.269 1271352.188, -2235828.5... | 47443.51 |
| 4 | Riiser-Larsen | East | FL | POLYGON ((-592166.317 1592824.258, -593783.16 ... | 42913.14 |
| ... | ... | ... | ... | ... | ... |
| 159 | Perkins | West | FL | POLYGON ((-1129608.753 -1201300.734, -1130034.... | 7.01 |
| 160 | Paternostro | East | FL | POLYGON ((824294.485 -2115301.607, 823916.673 ... | 6.55 |
| 161 | Arneb | East | FL | POLYGON ((333867.825 -1897953.452, 333673.461 ... | 6.41 |
| 162 | Falkner | East | FL | POLYGON ((425350.532 -1726631.609, 423726.753 ... | 5.69 |
| 163 | Hamilton_Piedmont | Islands | FL | POLYGON ((-1589132.027 -582392.525, -1589188.1... | 5.60 |
164 rows × 5 columns
[113]:
# get gravity and constraint spacing stats on ice shelves
ice_shelf_stats_gdf = pd.read_csv(
    "../results/ice_shelves/ice_shelf_gravity_stats.csv", index_col=None
)
ice_shelf_stats_gdf
[113]:
| NAME | Regions | TYPE | geometry | area_km | median_constraint_distance | mean_constraint_distance | max_constraint_distance | constraint_proximity_skewness | gravity_disturbance_rms | ... | reg_rms | reg_stdev | res_rms | res_stdev | error_rms | error_stdev | residual_constraint_proximity_ratio_rms | residual_constraint_proximity_ratio_stdev | regional_constraint_proximity_ratio_rms | regional_constraint_proximity_ratio_stdev | |
|---|---|---|---|---|---|---|---|---|---|---|---|---|---|---|---|---|---|---|---|---|---|
| 0 | Ross | West | FL | POLYGON ((-240677.18377991652 -678259.00593521... | 480428.37 | 17.282824 | 17.636882 | 62.339089 | 0.431810 | 44.934094 | ... | 17.652465 | 17.159272 | 6.399599 | 6.397548 | 12.748633 | 3.154937 | 132.093296 | 132.083718 | 306.642616 | 292.262320 |
| 1 | Ronne_Filchner | West | FL | POLYGON ((-1006734.8906412432 880592.979674786... | 427041.70 | 7.686515 | 8.739788 | 46.338298 | 1.456174 | 41.514238 | ... | 34.036735 | 20.853880 | 4.087359 | 4.084574 | 7.952294 | 1.760702 | 60.063692 | 60.065236 | 350.615365 | 251.773078 |
| 2 | Amery | East | FL | POLYGON ((2134701.4219642165 618463.1172190169... | 60797.28 | 16.941666 | 21.373582 | 74.852666 | 0.844014 | 54.656450 | ... | 41.754702 | 25.626999 | 15.490488 | 12.651456 | 8.432001 | 0.497149 | 516.984001 | 453.747317 | 1173.773769 | 858.199460 |
| 3 | LarsenC | Peninsula | FL | POLYGON ((-2235724.269360441 1271352.187501361... | 47443.51 | 9.067471 | 10.260593 | 36.855613 | 0.763313 | 14.824574 | ... | 38.595139 | 14.498270 | 5.654761 | 5.647546 | 5.735885 | 1.390208 | 69.319708 | 69.157083 | 508.573512 | 329.301767 |
| 4 | Riiser-Larsen | East | FL | POLYGON ((-592166.3173854565 1592824.257663729... | 42913.14 | 17.664812 | 20.596557 | 63.202992 | 0.713248 | 53.556828 | ... | 80.002938 | 41.235478 | 11.714963 | 11.313144 | 8.285409 | 0.728764 | 400.456039 | 396.959121 | 1942.610309 | 1289.222243 |
| ... | ... | ... | ... | ... | ... | ... | ... | ... | ... | ... | ... | ... | ... | ... | ... | ... | ... | ... | ... | ... | ... |
| 122 | Drury | East | FL | POLYGON ((895410.318218497 -2105991.070752478,... | 55.61 | 3.143890 | 3.746163 | 9.463699 | 0.496175 | 85.931453 | ... | 62.911283 | 0.391773 | 1.065483 | 0.188445 | 12.959736 | 0.030865 | 5.806477 | 2.009965 | 373.109779 | 180.049402 |
| 123 | Zelee | East | FL | POLYGON ((1595256.149328336 -1990608.354406229... | 40.65 | 2.835378 | 2.856841 | 6.070070 | 0.102221 | 56.605168 | ... | 46.436621 | 16.304421 | 3.328922 | 2.252083 | 6.485042 | 1.849987 | 13.854037 | 12.595032 | 108.332900 | 58.853888 |
| 124 | Dalk | East | FL | POLYGON ((2199011.8758713417 527659.2832139434... | 35.44 | 1.102750 | 1.103613 | 2.569476 | 0.153243 | 9.456864 | ... | 7.182482 | 2.665939 | 3.898634 | 3.898634 | 8.295042 | 0.233987 | 6.164256 | 6.164256 | 5.649626 | 5.331062 |
| 125 | Marret | East | FL | POLYGON ((1739518.675443965 -1925310.880398920... | 26.08 | 1.629186 | 1.762193 | 4.782843 | 0.875108 | 67.773671 | ... | 34.602215 | 3.131162 | 2.255713 | 2.836850 | 14.314831 | 0.472625 | 4.863799 | 5.569957 | 63.426217 | 32.656915 |
| 126 | Mandible_Cirque | East | FL | POLYGON ((344466.09181560605 -1812007.95449852... | 24.73 | 2.619210 | 2.636195 | 4.325854 | -0.018092 | 41.275016 | ... | 18.232193 | 0.103337 | 13.177317 | 1.580182 | 9.846860 | 0.305749 | 33.347506 | 4.415784 | 46.072941 | 0.848616 |
127 rows × 27 columns
[114]:
ice_shelves[~ice_shelves.NAME.isin(ice_shelf_stats_gdf.NAME.to_numpy())]
[114]:
| NAME | Regions | TYPE | geometry | area_km | |
|---|---|---|---|---|---|
| 121 | Porter | East | FL | POLYGON ((1923369.163 1643820.73, 1919731.588 ... | 59.28 |
| 124 | Alison | West | FL | MULTIPOLYGON (((-1754722.344 256629.32, -17545... | 47.71 |
| 126 | Skallen | East | FL | POLYGON ((1419424.627 1719449.989, 1419424.898... | 35.88 |
| 128 | Garfield | West | FL | POLYGON ((-1126042.82 -1198382.673, -1125896.4... | 29.68 |
| 129 | Hummer_Point | Islands | FL | POLYGON ((-1597171.359 -586925.122, -1597492.7... | 28.98 |
| 130 | Commandant_Charcot | East | FL | POLYGON ((1784381.94 -1889283.331, 1784550.691... | 28.03 |
| 131 | Suter | East | FL | POLYGON ((402740.271 -1761647.367, 401424.977 ... | 27.39 |
| 132 | Gannutz | East | FL | POLYGON ((659406.442 -2053971.977, 659170.776 ... | 26.81 |
| 133 | Harmon_Bay | Islands | FL | POLYGON ((-1608752.832 -608817.726, -1607549.1... | 26.66 |
| 134 | Fox_East | East | FL | POLYGON ((2380546.965 -1082661.546, 2380655.74... | 26.48 |
| 136 | Britten | Peninsula | FL | POLYGON ((-1817574.633 568523.792, -1817840.66... | 25.15 |
| 138 | Dawson_Lambton | East | FL | POLYGON ((-680809.736 1356261.688, -680579.602... | 24.26 |
| 139 | Sandford | East | FL | POLYGON ((1980344.759 -1632022.97, 1979353.761... | 23.15 |
| 140 | Barber | East | FL | POLYGON ((633839.75 -2049319.223, 634178.901 -... | 23.10 |
| 141 | Fox_West | West | FL | POLYGON ((-1803720.296 149493.58, -1803502.242... | 23.06 |
| 142 | Morse | East | FL | POLYGON ((1999598.952 -1682906.193, 1999229.14... | 22.67 |
| 143 | Chugunov | East | FL | POLYGON ((608949.1 -2034165.487, 608915.703 -2... | 22.47 |
| 144 | Telen | East | FL | POLYGON ((1425549.643 1719699.959, 1426300.25 ... | 19.80 |
| 145 | Erebus | East | FL | POLYGON ((302734.238 -1307153.346, 303549.83 -... | 19.35 |
| 146 | Hovde | East | FL | POLYGON ((2222299.946 514574.965, 2221330.223 ... | 16.68 |
| 147 | McLeod | East | FL | POLYGON ((831852.345 -2109127.77, 831905.632 -... | 16.50 |
| 148 | Kirkby | East | FL | POLYGON ((511928.653 -2058451.767, 511495.626 ... | 15.19 |
| 149 | Liotard | East | FL | POLYGON ((1669515.807 -1960265.711, 1670004.7 ... | 14.95 |
| 150 | Quatermain_Point | East | FL | POLYGON ((336507.28 -1938323.945, 336450.309 -... | 13.93 |
| 151 | ClarkeBay | Peninsula | FL | POLYGON ((-1488154.393 826494.229, -1488283.93... | 12.47 |
| 152 | Manhaul | East | FL | POLYGON ((342034.846 -1895484.095, 342114.625 ... | 12.28 |
| 153 | CapeWashington | East | FL | POLYGON ((430890.046 -1633245.58, 430466.316 -... | 11.83 |
| 154 | Hayes_Coats_Coast | East | FL | POLYGON ((-699140.992 1331574.824, -699232.533... | 11.72 |
| 155 | Marin | East | FL | POLYGON ((461385.867 -1450634.273, 461049.955 ... | 11.62 |
| 156 | Rydberg | Peninsula | FL | MULTIPOLYGON (((-1817527.564 336719.405, -1817... | 11.47 |
| 157 | Eltanin_Bay | West | FL | POLYGON ((-1765551.512 274938.583, -1764671.70... | 8.06 |
| 158 | Rose_Point | West | FL | POLYGON ((-1147927.179 -1208825.172, -1147730.... | 7.37 |
| 159 | Perkins | West | FL | POLYGON ((-1129608.753 -1201300.734, -1130034.... | 7.01 |
| 160 | Paternostro | East | FL | POLYGON ((824294.485 -2115301.607, 823916.673 ... | 6.55 |
| 161 | Arneb | East | FL | POLYGON ((333867.825 -1897953.452, 333673.461 ... | 6.41 |
| 162 | Falkner | East | FL | POLYGON ((425350.532 -1726631.609, 423726.753 ... | 5.69 |
| 163 | Hamilton_Piedmont | Islands | FL | POLYGON ((-1589132.027 -582392.525, -1589188.1... | 5.60 |
Ensemble 1: Constraint spacing vs. regional strength
[115]:
ensemble_path = "../results/Ross_Sea/ensembles/Ross_Sea_ensemble_01_constraint_spacing_vs_regional_strength_density_estimation"

ensemble_fname = f"{ensemble_path}.csv"

sampled_params_df = pd.read_csv(ensemble_fname)
sampled_params_df
[115]:
| constraint_numbers | regional_strengths | constraint_points_fname | starting_bathymetry_fname | constraints_starting_rmse | median_proximity | maximum_constraint_proximity | constraint_proximity_skewness | constraints_per_10000sq_km | starting_bathymetry_mae | ... | inverted_bathymetry_fname | best_density_contrast | constraints_rmse | inversion_rmse | topo_improvement_rmse | final_inversion_results_fname | final_inverted_bathymetry_fname | final_inversion_constraints_rmse | final_inversion_rmse | final_inversion_topo_improvement_rmse | |
|---|---|---|---|---|---|---|---|---|---|---|---|---|---|---|---|---|---|---|---|---|---|
| 0 | 4 | 20.0 | ../results/Ross_Sea/ensembles/Ross_Sea_ensembl... | ../results/Ross_Sea/ensembles/Ross_Sea_ensembl... | 0.00356 | 17.755 | 51.305 | 0.483691 | 282.666667 | 28.351063 | ... | ../results/Ross_Sea/ensembles/Ross_Sea_ensembl... | 1516.0 | 100.607651 | 72.304561 | -25.983116 | ../results/Ross_Sea/ensembles/Ross_Sea_ensembl... | ../results/Ross_Sea/ensembles/Ross_Sea_ensembl... | 1.415311 | 25.687797 | 20.633648 |
| 1 | 4 | 40.0 | ../results/Ross_Sea/ensembles/Ross_Sea_ensembl... | ../results/Ross_Sea/ensembles/Ross_Sea_ensembl... | 0.00356 | 17.755 | 51.305 | 0.483691 | 282.666667 | 28.351063 | ... | ../results/Ross_Sea/ensembles/Ross_Sea_ensembl... | 1675.0 | 196.916741 | 145.160338 | -98.838892 | ../results/Ross_Sea/ensembles/Ross_Sea_ensembl... | ../results/Ross_Sea/ensembles/Ross_Sea_ensembl... | 1.815615 | 47.128332 | -0.806886 |
| 2 | 4 | 60.0 | ../results/Ross_Sea/ensembles/Ross_Sea_ensembl... | ../results/Ross_Sea/ensembles/Ross_Sea_ensembl... | 0.00356 | 17.755 | 51.305 | 0.483691 | 282.666667 | 28.351063 | ... | ../results/Ross_Sea/ensembles/Ross_Sea_ensembl... | 1845.0 | 284.907328 | 209.025044 | -162.703598 | ../results/Ross_Sea/ensembles/Ross_Sea_ensembl... | ../results/Ross_Sea/ensembles/Ross_Sea_ensembl... | 2.232705 | 64.401993 | -18.080548 |
| 3 | 4 | 80.0 | ../results/Ross_Sea/ensembles/Ross_Sea_ensembl... | ../results/Ross_Sea/ensembles/Ross_Sea_ensembl... | 0.00356 | 17.755 | 51.305 | 0.483691 | 282.666667 | 28.351063 | ... | ../results/Ross_Sea/ensembles/Ross_Sea_ensembl... | 2149.0 | 352.124626 | 267.289107 | -220.967662 | ../results/Ross_Sea/ensembles/Ross_Sea_ensembl... | ../results/Ross_Sea/ensembles/Ross_Sea_ensembl... | 2.517473 | 73.013989 | -26.692543 |
| 4 | 4 | 100.0 | ../results/Ross_Sea/ensembles/Ross_Sea_ensembl... | ../results/Ross_Sea/ensembles/Ross_Sea_ensembl... | 0.00356 | 17.755 | 51.305 | 0.483691 | 282.666667 | 28.351063 | ... | ../results/Ross_Sea/ensembles/Ross_Sea_ensembl... | 2538.0 | 405.236779 | 316.810444 | -270.488998 | ../results/Ross_Sea/ensembles/Ross_Sea_ensembl... | ../results/Ross_Sea/ensembles/Ross_Sea_ensembl... | 2.669346 | 76.345720 | -30.024274 |
| ... | ... | ... | ... | ... | ... | ... | ... | ... | ... | ... | ... | ... | ... | ... | ... | ... | ... | ... | ... | ... | ... |
| 95 | 650 | 120.0 | ../results/Ross_Sea/ensembles/Ross_Sea_ensembl... | ../results/Ross_Sea/ensembles/Ross_Sea_ensembl... | 0.28303 | 2.520 | 6.333 | -0.144477 | 496.666667 | 3.335341 | ... | ../results/Ross_Sea/ensembles/Ross_Sea_ensembl... | 2925.0 | 402.633620 | 353.456330 | -347.528251 | ../results/Ross_Sea/ensembles/Ross_Sea_ensembl... | ../results/Ross_Sea/ensembles/Ross_Sea_ensembl... | 0.797250 | 3.144191 | 2.783888 |
| 96 | 650 | 140.0 | ../results/Ross_Sea/ensembles/Ross_Sea_ensembl... | ../results/Ross_Sea/ensembles/Ross_Sea_ensembl... | 0.28303 | 2.520 | 6.333 | -0.144477 | 496.666667 | 3.335341 | ... | ../results/Ross_Sea/ensembles/Ross_Sea_ensembl... | 3147.0 | 432.309125 | 380.000105 | -374.072026 | ../results/Ross_Sea/ensembles/Ross_Sea_ensembl... | ../results/Ross_Sea/ensembles/Ross_Sea_ensembl... | 0.820400 | 3.223230 | 2.704849 |
| 97 | 650 | 160.0 | ../results/Ross_Sea/ensembles/Ross_Sea_ensembl... | ../results/Ross_Sea/ensembles/Ross_Sea_ensembl... | 0.28303 | 2.520 | 6.333 | -0.144477 | 496.666667 | 3.335341 | ... | ../results/Ross_Sea/ensembles/Ross_Sea_ensembl... | 3300.0 | 458.394076 | 402.496493 | -396.568414 | ../results/Ross_Sea/ensembles/Ross_Sea_ensembl... | ../results/Ross_Sea/ensembles/Ross_Sea_ensembl... | 0.834021 | 3.240482 | 2.687596 |
| 98 | 650 | 180.0 | ../results/Ross_Sea/ensembles/Ross_Sea_ensembl... | ../results/Ross_Sea/ensembles/Ross_Sea_ensembl... | 0.28303 | 2.520 | 6.333 | -0.144477 | 496.666667 | 3.335341 | ... | ../results/Ross_Sea/ensembles/Ross_Sea_ensembl... | 3300.0 | 489.076040 | 425.528815 | -419.600736 | ../results/Ross_Sea/ensembles/Ross_Sea_ensembl... | ../results/Ross_Sea/ensembles/Ross_Sea_ensembl... | 0.839198 | 3.130741 | 2.797338 |
| 99 | 650 | 200.0 | ../results/Ross_Sea/ensembles/Ross_Sea_ensembl... | ../results/Ross_Sea/ensembles/Ross_Sea_ensembl... | 0.28303 | 2.520 | 6.333 | -0.144477 | 496.666667 | 3.335341 | ... | ../results/Ross_Sea/ensembles/Ross_Sea_ensembl... | 3300.0 | 520.157398 | 448.897032 | -442.968953 | ../results/Ross_Sea/ensembles/Ross_Sea_ensembl... | ../results/Ross_Sea/ensembles/Ross_Sea_ensembl... | 0.845232 | 3.023905 | 2.904174 |
100 rows × 24 columns
[116]:
sampled_params_df[
    [
        "starting_bathymetry_rmse",
        "final_inversion_rmse",
        "final_inversion_topo_improvement_rmse",
    ]
].describe()
[116]:
| starting_bathymetry_rmse | final_inversion_rmse | final_inversion_topo_improvement_rmse | |
|---|---|---|---|
| count | 100.000000 | 100.000000 | 100.000000 |
| mean | 26.063274 | 20.939675 | 5.123598 |
| std | 14.282005 | 26.749476 | 18.491122 |
| min | 5.928079 | 2.422900 | -74.798134 |
| 25% | 11.358153 | 4.084694 | 3.423253 |
| 50% | 24.798910 | 8.185372 | 9.121957 |
| 75% | 41.525873 | 25.812968 | 15.349237 |
| max | 46.321446 | 121.119580 | 31.614929 |
Predict ice shelves inversion error and topo improvement
[117]:
sampled_params_df
[117]:
| constraint_numbers | regional_strengths | constraint_points_fname | starting_bathymetry_fname | constraints_starting_rmse | median_proximity | maximum_constraint_proximity | constraint_proximity_skewness | constraints_per_10000sq_km | starting_bathymetry_mae | ... | inverted_bathymetry_fname | best_density_contrast | constraints_rmse | inversion_rmse | topo_improvement_rmse | final_inversion_results_fname | final_inverted_bathymetry_fname | final_inversion_constraints_rmse | final_inversion_rmse | final_inversion_topo_improvement_rmse | |
|---|---|---|---|---|---|---|---|---|---|---|---|---|---|---|---|---|---|---|---|---|---|
| 0 | 4 | 20.0 | ../results/Ross_Sea/ensembles/Ross_Sea_ensembl... | ../results/Ross_Sea/ensembles/Ross_Sea_ensembl... | 0.00356 | 17.755 | 51.305 | 0.483691 | 282.666667 | 28.351063 | ... | ../results/Ross_Sea/ensembles/Ross_Sea_ensembl... | 1516.0 | 100.607651 | 72.304561 | -25.983116 | ../results/Ross_Sea/ensembles/Ross_Sea_ensembl... | ../results/Ross_Sea/ensembles/Ross_Sea_ensembl... | 1.415311 | 25.687797 | 20.633648 |
| 1 | 4 | 40.0 | ../results/Ross_Sea/ensembles/Ross_Sea_ensembl... | ../results/Ross_Sea/ensembles/Ross_Sea_ensembl... | 0.00356 | 17.755 | 51.305 | 0.483691 | 282.666667 | 28.351063 | ... | ../results/Ross_Sea/ensembles/Ross_Sea_ensembl... | 1675.0 | 196.916741 | 145.160338 | -98.838892 | ../results/Ross_Sea/ensembles/Ross_Sea_ensembl... | ../results/Ross_Sea/ensembles/Ross_Sea_ensembl... | 1.815615 | 47.128332 | -0.806886 |
| 2 | 4 | 60.0 | ../results/Ross_Sea/ensembles/Ross_Sea_ensembl... | ../results/Ross_Sea/ensembles/Ross_Sea_ensembl... | 0.00356 | 17.755 | 51.305 | 0.483691 | 282.666667 | 28.351063 | ... | ../results/Ross_Sea/ensembles/Ross_Sea_ensembl... | 1845.0 | 284.907328 | 209.025044 | -162.703598 | ../results/Ross_Sea/ensembles/Ross_Sea_ensembl... | ../results/Ross_Sea/ensembles/Ross_Sea_ensembl... | 2.232705 | 64.401993 | -18.080548 |
| 3 | 4 | 80.0 | ../results/Ross_Sea/ensembles/Ross_Sea_ensembl... | ../results/Ross_Sea/ensembles/Ross_Sea_ensembl... | 0.00356 | 17.755 | 51.305 | 0.483691 | 282.666667 | 28.351063 | ... | ../results/Ross_Sea/ensembles/Ross_Sea_ensembl... | 2149.0 | 352.124626 | 267.289107 | -220.967662 | ../results/Ross_Sea/ensembles/Ross_Sea_ensembl... | ../results/Ross_Sea/ensembles/Ross_Sea_ensembl... | 2.517473 | 73.013989 | -26.692543 |
| 4 | 4 | 100.0 | ../results/Ross_Sea/ensembles/Ross_Sea_ensembl... | ../results/Ross_Sea/ensembles/Ross_Sea_ensembl... | 0.00356 | 17.755 | 51.305 | 0.483691 | 282.666667 | 28.351063 | ... | ../results/Ross_Sea/ensembles/Ross_Sea_ensembl... | 2538.0 | 405.236779 | 316.810444 | -270.488998 | ../results/Ross_Sea/ensembles/Ross_Sea_ensembl... | ../results/Ross_Sea/ensembles/Ross_Sea_ensembl... | 2.669346 | 76.345720 | -30.024274 |
| ... | ... | ... | ... | ... | ... | ... | ... | ... | ... | ... | ... | ... | ... | ... | ... | ... | ... | ... | ... | ... | ... |
| 95 | 650 | 120.0 | ../results/Ross_Sea/ensembles/Ross_Sea_ensembl... | ../results/Ross_Sea/ensembles/Ross_Sea_ensembl... | 0.28303 | 2.520 | 6.333 | -0.144477 | 496.666667 | 3.335341 | ... | ../results/Ross_Sea/ensembles/Ross_Sea_ensembl... | 2925.0 | 402.633620 | 353.456330 | -347.528251 | ../results/Ross_Sea/ensembles/Ross_Sea_ensembl... | ../results/Ross_Sea/ensembles/Ross_Sea_ensembl... | 0.797250 | 3.144191 | 2.783888 |
| 96 | 650 | 140.0 | ../results/Ross_Sea/ensembles/Ross_Sea_ensembl... | ../results/Ross_Sea/ensembles/Ross_Sea_ensembl... | 0.28303 | 2.520 | 6.333 | -0.144477 | 496.666667 | 3.335341 | ... | ../results/Ross_Sea/ensembles/Ross_Sea_ensembl... | 3147.0 | 432.309125 | 380.000105 | -374.072026 | ../results/Ross_Sea/ensembles/Ross_Sea_ensembl... | ../results/Ross_Sea/ensembles/Ross_Sea_ensembl... | 0.820400 | 3.223230 | 2.704849 |
| 97 | 650 | 160.0 | ../results/Ross_Sea/ensembles/Ross_Sea_ensembl... | ../results/Ross_Sea/ensembles/Ross_Sea_ensembl... | 0.28303 | 2.520 | 6.333 | -0.144477 | 496.666667 | 3.335341 | ... | ../results/Ross_Sea/ensembles/Ross_Sea_ensembl... | 3300.0 | 458.394076 | 402.496493 | -396.568414 | ../results/Ross_Sea/ensembles/Ross_Sea_ensembl... | ../results/Ross_Sea/ensembles/Ross_Sea_ensembl... | 0.834021 | 3.240482 | 2.687596 |
| 98 | 650 | 180.0 | ../results/Ross_Sea/ensembles/Ross_Sea_ensembl... | ../results/Ross_Sea/ensembles/Ross_Sea_ensembl... | 0.28303 | 2.520 | 6.333 | -0.144477 | 496.666667 | 3.335341 | ... | ../results/Ross_Sea/ensembles/Ross_Sea_ensembl... | 3300.0 | 489.076040 | 425.528815 | -419.600736 | ../results/Ross_Sea/ensembles/Ross_Sea_ensembl... | ../results/Ross_Sea/ensembles/Ross_Sea_ensembl... | 0.839198 | 3.130741 | 2.797338 |
| 99 | 650 | 200.0 | ../results/Ross_Sea/ensembles/Ross_Sea_ensembl... | ../results/Ross_Sea/ensembles/Ross_Sea_ensembl... | 0.28303 | 2.520 | 6.333 | -0.144477 | 496.666667 | 3.335341 | ... | ../results/Ross_Sea/ensembles/Ross_Sea_ensembl... | 3300.0 | 520.157398 | 448.897032 | -442.968953 | ../results/Ross_Sea/ensembles/Ross_Sea_ensembl... | ../results/Ross_Sea/ensembles/Ross_Sea_ensembl... | 0.845232 | 3.023905 | 2.904174 |
100 rows × 24 columns
[118]:
ds = sampled_params_df.set_index(["median_proximity", "regional_stdev"]).to_xarray()

for p in ["reg_stdev", "topo_free_disturbance_stdev"]:
    for i, row in ice_shelf_stats_gdf.iterrows():
        inversion_rmse = ds.final_inversion_rmse.sel(
            median_proximity=row.median_constraint_distance,
            regional_stdev=row[p],
            method="nearest",
        ).to_numpy()
        topo_improvement_rmse = ds.final_inversion_topo_improvement_rmse.sel(
            median_proximity=row.median_constraint_distance,
            regional_stdev=row[p],
            method="nearest",
        ).to_numpy()
        ice_shelf_stats_gdf.loc[i, f"inversion_rmse_from_{p}"] = inversion_rmse
        ice_shelf_stats_gdf.loc[i, f"topo_improvement_rmse_from_{p}"] = (
            topo_improvement_rmse
        )

ice_shelf_stats_gdf
[118]:
| NAME | Regions | TYPE | geometry | area_km | median_constraint_distance | mean_constraint_distance | max_constraint_distance | constraint_proximity_skewness | gravity_disturbance_rms | ... | error_rms | error_stdev | residual_constraint_proximity_ratio_rms | residual_constraint_proximity_ratio_stdev | regional_constraint_proximity_ratio_rms | regional_constraint_proximity_ratio_stdev | inversion_rmse_from_reg_stdev | topo_improvement_rmse_from_reg_stdev | inversion_rmse_from_topo_free_disturbance_stdev | topo_improvement_rmse_from_topo_free_disturbance_stdev | |
|---|---|---|---|---|---|---|---|---|---|---|---|---|---|---|---|---|---|---|---|---|---|
| 0 | Ross | West | FL | POLYGON ((-240677.18377991652 -678259.00593521... | 480428.37 | 17.282824 | 17.636882 | 62.339089 | 0.431810 | 44.934094 | ... | 12.748633 | 3.154937 | 132.093296 | 132.083718 | 306.642616 | 292.262320 | 73.013989 | -26.692543 | 73.013989 | -26.692543 |
| 1 | Ronne_Filchner | West | FL | POLYGON ((-1006734.8906412432 880592.979674786... | 427041.70 | 7.686515 | 8.739788 | 46.338298 | 1.456174 | 41.514238 | ... | 7.952294 | 1.760702 | 60.063692 | 60.065236 | 350.615365 | 251.773078 | 6.700953 | 15.047268 | 6.700953 | 15.047268 |
| 2 | Amery | East | FL | POLYGON ((2134701.4219642165 618463.1172190169... | 60797.28 | 16.941666 | 21.373582 | 74.852666 | 0.844014 | 54.656450 | ... | 8.432001 | 0.497149 | 516.984001 | 453.747317 | 1173.773769 | 858.199460 | 80.130319 | -33.808873 | 83.455822 | -37.134376 |
| 3 | LarsenC | Peninsula | FL | POLYGON ((-2235724.269360441 1271352.187501361... | 47443.51 | 9.067471 | 10.260593 | 36.855613 | 0.763313 | 14.824574 | ... | 5.735885 | 1.390208 | 69.319708 | 69.157083 | 508.573512 | 329.301767 | 8.266292 | 19.583306 | 8.266292 | 19.583306 |
| 4 | Riiser-Larsen | East | FL | POLYGON ((-592166.3173854565 1592824.257663729... | 42913.14 | 17.664812 | 20.596557 | 63.202992 | 0.713248 | 53.556828 | ... | 8.285409 | 0.728764 | 400.456039 | 396.959121 | 1942.610309 | 1289.222243 | 121.119580 | -74.798134 | 121.119580 | -74.798134 |
| ... | ... | ... | ... | ... | ... | ... | ... | ... | ... | ... | ... | ... | ... | ... | ... | ... | ... | ... | ... | ... | ... |
| 122 | Drury | East | FL | POLYGON ((895410.318218497 -2105991.070752478,... | 55.61 | 3.143890 | 3.746163 | 9.463699 | 0.496175 | 85.931453 | ... | 12.959736 | 0.030865 | 5.806477 | 2.009965 | 373.109779 | 180.049402 | 3.039897 | 5.619140 | 3.039897 | 5.619140 |
| 123 | Zelee | East | FL | POLYGON ((1595256.149328336 -1990608.354406229... | 40.65 | 2.835378 | 2.856841 | 6.070070 | 0.102221 | 56.605168 | ... | 6.485042 | 1.849987 | 13.854037 | 12.595032 | 108.332900 | 58.853888 | 2.561519 | 3.366560 | 2.561519 | 3.366560 |
| 124 | Dalk | East | FL | POLYGON ((2199011.8758713417 527659.2832139434... | 35.44 | 1.102750 | 1.103613 | 2.569476 | 0.153243 | 9.456864 | ... | 8.295042 | 0.233987 | 6.164256 | 6.164256 | 5.649626 | 5.331062 | 2.485929 | 3.442150 | 2.422900 | 3.505179 |
| 125 | Marret | East | FL | POLYGON ((1739518.675443965 -1925310.880398920... | 26.08 | 1.629186 | 1.762193 | 4.782843 | 0.875108 | 67.773671 | ... | 14.314831 | 0.472625 | 4.863799 | 5.569957 | 63.426217 | 32.656915 | 2.485929 | 3.442150 | 2.485929 | 3.442150 |
| 126 | Mandible_Cirque | East | FL | POLYGON ((344466.09181560605 -1812007.95449852... | 24.73 | 2.619210 | 2.636195 | 4.325854 | -0.018092 | 41.275016 | ... | 9.846860 | 0.305749 | 33.347506 | 4.415784 | 46.072941 | 0.848616 | 2.485929 | 3.442150 | 2.485929 | 3.442150 |
127 rows × 31 columns
[119]:
predict_on = "topo_free_disturbance_stdev"
[120]:
# show limits of the parameter space for Ensemble 1
print(
    "Constraint proximity limits: ",
    f"{sampled_params_df.median_proximity.min()}, ",
    sampled_params_df.median_proximity.max(),
)
print(
    "Regional strength limits ",
    f"{sampled_params_df.regional_stdev.min()}, ",
    sampled_params_df.regional_stdev.max(),
)
Constraint proximity limits:  2.52,  17.755
Regional strength limits  4.089101313208858,  40.891013132088574
[121]:
ice_shelf_stats_gdf.columns
[121]:
Index(['NAME', 'Regions', 'TYPE', 'geometry', 'area_km',
       'median_constraint_distance', 'mean_constraint_distance',
       'max_constraint_distance', 'constraint_proximity_skewness',
       'gravity_disturbance_rms', 'gravity_disturbance_stdev',
       'partial_topo_free_disturbance_rms',
       'partial_topo_free_disturbance_stdev', 'topo_free_disturbance_rms',
       'topo_free_disturbance_stdev', 'starting_gravity_rms',
       'starting_gravity_stdev', 'reg_rms', 'reg_stdev', 'res_rms',
       'res_stdev', 'error_rms', 'error_stdev',
       'residual_constraint_proximity_ratio_rms',
       'residual_constraint_proximity_ratio_stdev',
       'regional_constraint_proximity_ratio_rms',
       'regional_constraint_proximity_ratio_stdev',
       'inversion_rmse_from_reg_stdev', 'topo_improvement_rmse_from_reg_stdev',
       'inversion_rmse_from_topo_free_disturbance_stdev',
       'topo_improvement_rmse_from_topo_free_disturbance_stdev'],
      dtype='object')
[122]:
# export to csv to be used in the paper as a table
df = ice_shelf_stats_gdf[
    [
        "NAME",
        "area_km",
        "median_constraint_distance",
        "max_constraint_distance",
        "constraint_proximity_skewness",
        "topo_free_disturbance_stdev",
        "error_rms",
        "inversion_rmse_from_topo_free_disturbance_stdev",
        "topo_improvement_rmse_from_topo_free_disturbance_stdev",
    ]
]
df["area_km"] = df["area_km"].round(0).astype(int)
df = df.rename(
    columns={
        "NAME": "Ice_shelf",
        "area_km": "Area (km^2)",
        "median_constraint_distance": "Median constraint proximity (km)",
        "max_constraint_distance": "Max constraint proximity (km)",
        "constraint_proximity_skewness": "Constraint proximity skewness",
        "topo_free_disturbance_stdev": "Topography-corrected disturbance stdev (mGal)",
        "error_rms": "Gravity error RMS (mGal)",
        "inversion_rmse_from_topo_free_disturbance_stdev": (
            "Predicted optimal inversion RMSE (m)"
        ),
        "topo_improvement_rmse_from_topo_free_disturbance_stdev": (
            "Predicted optimal topographic improvement (m)"
        ),
    },
)
df.to_csv(
    "../paper/ice_shelf_stats.csv",
    index=False,
    float_format="%.2f",
)
df.head()
[122]:
| Ice_shelf | Area (km^2) | Median constraint proximity (km) | Max constraint proximity (km) | Constraint proximity skewness | Topography-corrected disturbance stdev (mGal) | Gravity error RMS (mGal) | Predicted optimal inversion RMSE (m) | Predicted optimal topographic improvement (m) | |
|---|---|---|---|---|---|---|---|---|---|
| 0 | Ross | 480428 | 17.282824 | 62.339089 | 0.431810 | 17.981856 | 12.748633 | 73.013989 | -26.692543 |
| 1 | Ronne_Filchner | 427042 | 7.686515 | 46.338298 | 1.456174 | 21.372407 | 7.952294 | 6.700953 | 15.047268 |
| 2 | Amery | 60797 | 16.941666 | 74.852666 | 0.844014 | 28.288451 | 8.432001 | 83.455822 | -37.134376 |
| 3 | LarsenC | 47444 | 9.067471 | 36.855613 | 0.763313 | 14.886413 | 5.735885 | 8.266292 | 19.583306 |
| 4 | Riiser-Larsen | 42913 | 17.664812 | 63.202992 | 0.713248 | 40.164796 | 8.285409 | 121.119580 | -74.798134 |
[123]:
shelves_in_limits = ice_shelf_stats_gdf.copy()

# exclude shelves outsite param limits of Ensemble 1
# round lims to ints to include shelves on the edge
shelves_in_limits = shelves_in_limits[
    shelves_in_limits.median_constraint_distance.between(
        math.floor(sampled_params_df.median_proximity.min()) - 1,
        math.ceil(sampled_params_df.median_proximity.max()) + 1,
    )
    & shelves_in_limits[predict_on].between(
        math.floor(sampled_params_df.regional_stdev.min()) - 1,
        math.ceil(sampled_params_df.regional_stdev.max()) + 1,
    )
]
print(f"Number of shelves within ensemble limits: {len(shelves_in_limits)}")

# plot only the largest shelves which fall in the ensemble limits
shelves_to_plot = shelves_in_limits[shelves_in_limits.area_km > 1000]

shelves_to_plot[
    [
        "NAME",
        f"inversion_rmse_from_{predict_on}",
        f"topo_improvement_rmse_from_{predict_on}",
    ]
]
Number of shelves within ensemble limits: 110
[123]:
| NAME | inversion_rmse_from_topo_free_disturbance_stdev | topo_improvement_rmse_from_topo_free_disturbance_stdev | |
|---|---|---|---|
| 0 | Ross | 73.013989 | -26.692543 |
| 1 | Ronne_Filchner | 6.700953 | 15.047268 |
| 2 | Amery | 83.455822 | -37.134376 |
| 3 | LarsenC | 8.266292 | 19.583306 |
| 4 | Riiser-Larsen | 121.119580 | -74.798134 |
| 5 | Fimbul | 6.703064 | 12.408802 |
| 6 | Brunt_Stancomb | 42.040917 | -0.515044 |
| 7 | Getz | 11.465010 | 23.295284 |
| 9 | Abbot | 10.139209 | 17.710389 |
| 11 | George_VI | 6.700953 | 15.047268 |
| 12 | LarsenD | 11.748309 | 16.101289 |
| 13 | Borchgrevink | 34.132438 | 7.393435 |
| 14 | West | 26.188478 | 15.337395 |
| 15 | Wilkins | 73.013989 | -26.692543 |
| 16 | Sulzberger | 4.907671 | 14.204195 |
| 18 | Lazarev | 11.465010 | 23.295284 |
| 19 | Stange | 8.266292 | 19.583306 |
| 20 | Nivl | 22.886394 | 11.873899 |
| 22 | Nickerson | 8.266292 | 19.583306 |
| 23 | Totten | 8.393460 | 13.354761 |
| 24 | Pine_Island | 3.069406 | 8.288747 |
| 25 | Moscow_University | 6.700953 | 15.047268 |
| 26 | Dotson | 4.907671 | 14.204195 |
| 27 | Mertz | 3.926805 | 7.431348 |
| 29 | Thwaites | 2.434134 | 3.493945 |
| 30 | Bach | 3.855609 | 17.892612 |
| 31 | Cook | 45.568418 | -2.198246 |
| 32 | Crosson | 6.698417 | 21.151180 |
| 33 | Rennick | 12.867140 | 14.982457 |
| 34 | Venable | 4.483079 | 17.265142 |
| 35 | Cosgrove | 6.698417 | 21.151180 |
| 36 | Tracy_Tremenchus | 33.531395 | 9.838776 |
| 37 | Mariner | 12.867140 | 14.982457 |
| 38 | Holmes | 3.855609 | 17.892612 |
| 40 | LarsenB | 3.684108 | 15.427758 |
| 41 | Quar | 3.463537 | 7.894616 |
| 42 | Vigrid | 20.134623 | 14.625670 |
| 43 | Atka | 4.483079 | 17.265142 |
| 44 | Nansen | 4.359208 | 4.299828 |
| 45 | Ninnis | 5.591807 | 16.156415 |
| 47 | Publications | 4.090876 | 15.020990 |
| 48 | Dibble | 6.700953 | 15.047268 |
| 49 | LarsenE | 4.907671 | 14.204195 |
[124]:
# print shelves which are not in the ensemble limits
ice_shelf_stats_gdf[~ice_shelf_stats_gdf.NAME.isin(shelves_in_limits.NAME)][
    ["NAME", "median_constraint_distance", "topo_free_disturbance_stdev"]
]
[124]:
| NAME | median_constraint_distance | topo_free_disturbance_stdev | |
|---|---|---|---|
| 8 | Baudouin | 22.523870 | 36.306592 |
| 10 | Shackleton | 26.857001 | 25.104175 |
| 17 | Jelbart | 11.208331 | 60.337627 |
| 21 | Ekstrom | 2.733504 | 66.265034 |
| 28 | Prince_Harald | 25.980222 | 22.924666 |
| 39 | Drygalski | 3.963965 | 62.462354 |
| 46 | Conger_Glenzer | 32.468017 | 20.804669 |
| 55 | Aviator | 4.828997 | 51.645216 |
| 77 | May_Glacier | 5.728868 | 2.181168 |
| 84 | Hamilton | 4.090092 | 2.456716 |
| 103 | Utsikkar | 4.987191 | 0.790866 |
| 111 | Cirque_Fjord | 5.749979 | 2.889453 |
| 117 | Deakin | 3.331051 | 2.767349 |
| 120 | Jackson | 6.648692 | 2.354515 |
| 121 | Holt | 1.777666 | 2.261663 |
| 122 | Drury | 3.143890 | 0.580218 |
| 126 | Mandible_Cirque | 2.619210 | 1.683520 |
[125]:
df = shelves_to_plot[
    [
        "NAME",
        f"topo_improvement_rmse_from_{predict_on}",
    ]
]
df.sort_values(f"topo_improvement_rmse_from_{predict_on}")
[125]:
| NAME | topo_improvement_rmse_from_topo_free_disturbance_stdev | |
|---|---|---|
| 4 | Riiser-Larsen | -74.798134 |
| 2 | Amery | -37.134376 |
| 0 | Ross | -26.692543 |
| 15 | Wilkins | -26.692543 |
| 31 | Cook | -2.198246 |
| 6 | Brunt_Stancomb | -0.515044 |
| 29 | Thwaites | 3.493945 |
| 44 | Nansen | 4.299828 |
| 13 | Borchgrevink | 7.393435 |
| 27 | Mertz | 7.431348 |
| 41 | Quar | 7.894616 |
| 24 | Pine_Island | 8.288747 |
| 36 | Tracy_Tremenchus | 9.838776 |
| 20 | Nivl | 11.873899 |
| 5 | Fimbul | 12.408802 |
| 23 | Totten | 13.354761 |
| 26 | Dotson | 14.204195 |
| 49 | LarsenE | 14.204195 |
| 16 | Sulzberger | 14.204195 |
| 42 | Vigrid | 14.625670 |
| 33 | Rennick | 14.982457 |
| 37 | Mariner | 14.982457 |
| 47 | Publications | 15.020990 |
| 25 | Moscow_University | 15.047268 |
| 11 | George_VI | 15.047268 |
| 48 | Dibble | 15.047268 |
| 1 | Ronne_Filchner | 15.047268 |
| 14 | West | 15.337395 |
| 40 | LarsenB | 15.427758 |
| 12 | LarsenD | 16.101289 |
| 45 | Ninnis | 16.156415 |
| 34 | Venable | 17.265142 |
| 43 | Atka | 17.265142 |
| 9 | Abbot | 17.710389 |
| 38 | Holmes | 17.892612 |
| 30 | Bach | 17.892612 |
| 22 | Nickerson | 19.583306 |
| 3 | LarsenC | 19.583306 |
| 19 | Stange | 19.583306 |
| 32 | Crosson | 21.151180 |
| 35 | Cosgrove | 21.151180 |
| 18 | Lazarev | 23.295284 |
| 7 | Getz | 23.295284 |
[126]:
df = ice_shelf_stats_gdf[
    [
        "NAME",
        f"topo_improvement_rmse_from_{predict_on}",
    ]
]

df.sort_values(f"topo_improvement_rmse_from_{predict_on}")
[126]:
| NAME | topo_improvement_rmse_from_topo_free_disturbance_stdev | |
|---|---|---|
| 4 | Riiser-Larsen | -74.798134 |
| 8 | Baudouin | -62.166820 |
| 2 | Amery | -37.134376 |
| 10 | Shackleton | -33.808873 |
| 28 | Prince_Harald | -33.808873 |
| ... | ... | ... |
| 86 | Underwood | 21.151180 |
| 35 | Cosgrove | 21.151180 |
| 7 | Getz | 23.295284 |
| 18 | Lazarev | 23.295284 |
| 61 | Withrow | 29.337111 |
127 rows × 2 columns
[127]:
print(len(shelves_to_plot))
print(
    len(
        shelves_to_plot[shelves_to_plot[f"topo_improvement_rmse_from_{predict_on}"] > 0]
    )
)
perc_improvement = (
    len(
        shelves_to_plot[shelves_to_plot[f"topo_improvement_rmse_from_{predict_on}"] > 0]
    )
    / len(shelves_to_plot)
    * 100
)
print(
    f"{round(perc_improvement, 1)}% of 50 largest ice shelves predicted to have improved topography"
)
43
37
86.0% of 50 largest ice shelves predicted to have improved topography
[128]:
print(len(shelves_in_limits))
print(
    len(
        shelves_in_limits[
            shelves_in_limits[f"topo_improvement_rmse_from_{predict_on}"] > 0
        ]
    )
)
perc_improvement = (
    len(
        shelves_in_limits[
            shelves_in_limits[f"topo_improvement_rmse_from_{predict_on}"] > 0
        ]
    )
    / len(shelves_in_limits)
    * 100
)
print(
    f"{round(perc_improvement, 1)}% of ice shelves predicted to have improved topography"
)
110
104
94.5% of ice shelves predicted to have improved topography
[129]:
df = shelves_to_plot[
    [
        "NAME",
        f"inversion_rmse_from_{predict_on}",
    ]
]
df.sort_values(f"inversion_rmse_from_{predict_on}")
[129]:
| NAME | inversion_rmse_from_topo_free_disturbance_stdev | |
|---|---|---|
| 29 | Thwaites | 2.434134 |
| 24 | Pine_Island | 3.069406 |
| 41 | Quar | 3.463537 |
| 40 | LarsenB | 3.684108 |
| 30 | Bach | 3.855609 |
| 38 | Holmes | 3.855609 |
| 27 | Mertz | 3.926805 |
| 47 | Publications | 4.090876 |
| 44 | Nansen | 4.359208 |
| 34 | Venable | 4.483079 |
| 43 | Atka | 4.483079 |
| 49 | LarsenE | 4.907671 |
| 26 | Dotson | 4.907671 |
| 16 | Sulzberger | 4.907671 |
| 45 | Ninnis | 5.591807 |
| 32 | Crosson | 6.698417 |
| 35 | Cosgrove | 6.698417 |
| 1 | Ronne_Filchner | 6.700953 |
| 11 | George_VI | 6.700953 |
| 25 | Moscow_University | 6.700953 |
| 48 | Dibble | 6.700953 |
| 5 | Fimbul | 6.703064 |
| 22 | Nickerson | 8.266292 |
| 3 | LarsenC | 8.266292 |
| 19 | Stange | 8.266292 |
| 23 | Totten | 8.393460 |
| 9 | Abbot | 10.139209 |
| 7 | Getz | 11.465010 |
| 18 | Lazarev | 11.465010 |
| 12 | LarsenD | 11.748309 |
| 37 | Mariner | 12.867140 |
| 33 | Rennick | 12.867140 |
| 42 | Vigrid | 20.134623 |
| 20 | Nivl | 22.886394 |
| 14 | West | 26.188478 |
| 36 | Tracy_Tremenchus | 33.531395 |
| 13 | Borchgrevink | 34.132438 |
| 6 | Brunt_Stancomb | 42.040917 |
| 31 | Cook | 45.568418 |
| 15 | Wilkins | 73.013989 |
| 0 | Ross | 73.013989 |
| 2 | Amery | 83.455822 |
| 4 | Riiser-Larsen | 121.119580 |
[130]:
df = ice_shelf_stats_gdf[
    [
        "NAME",
        f"inversion_rmse_from_{predict_on}",
    ]
]
df.sort_values(f"inversion_rmse_from_{predict_on}")
[130]:
| NAME | inversion_rmse_from_topo_free_disturbance_stdev | |
|---|---|---|
| 119 | HarbordGlacier | 2.422900 |
| 96 | Tinker | 2.422900 |
| 106 | Dennistoun | 2.422900 |
| 99 | SmithInlet | 2.422900 |
| 112 | Flatnes | 2.422900 |
| ... | ... | ... |
| 10 | Shackleton | 80.130319 |
| 28 | Prince_Harald | 80.130319 |
| 2 | Amery | 83.455822 |
| 8 | Baudouin | 108.488266 |
| 4 | Riiser-Larsen | 121.119580 |
127 rows × 2 columns
[131]:
print(len(shelves_to_plot))
print(len(shelves_to_plot[shelves_to_plot[f"inversion_rmse_from_{predict_on}"] < 25]))
perc_improvement = (
    len(shelves_to_plot[shelves_to_plot[f"inversion_rmse_from_{predict_on}"] < 25])
    / len(shelves_to_plot)
    * 100
)
print(
    f"{round(perc_improvement, 1)}% of 50 largest ice shelves predicted to have RMSE < 25 m"
)
43
34
79.1% of 50 largest ice shelves predicted to have RMSE < 25 m
[132]:
print(len(shelves_in_limits))
print(
    len(shelves_in_limits[shelves_in_limits[f"inversion_rmse_from_{predict_on}"] < 25])
)
perc_improvement = (
    len(shelves_in_limits[shelves_in_limits[f"inversion_rmse_from_{predict_on}"] < 25])
    / len(shelves_in_limits)
    * 100
)
print(f"{round(perc_improvement, 1)}% of ice shelves predicted to have RMSE < 25 m")
110
99
90.0% of ice shelves predicted to have RMSE < 25 m
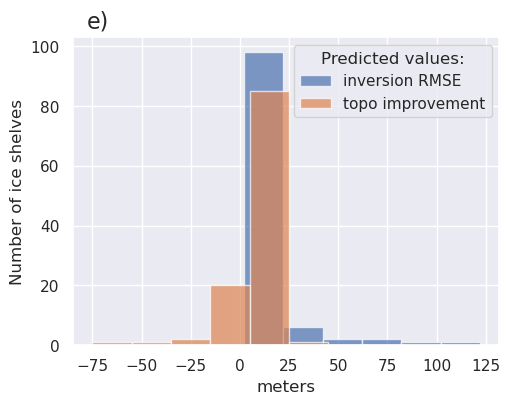
[133]:
df = shelves_in_limits

fig, ax = plt.subplots(figsize=(5.5, 4))
ax.hist(
    df[f"inversion_rmse_from_{predict_on}"],
    bins=range(
        round(min(df[f"inversion_rmse_from_{predict_on}"])),
        round(max(df[f"inversion_rmse_from_{predict_on}"])) + 20,
        20,
    ),
    alpha=0.7,
    label="inversion RMSE",
)
ax.hist(
    df[f"topo_improvement_rmse_from_{predict_on}"],
    bins=range(
        round(min(df[f"topo_improvement_rmse_from_{predict_on}"])),
        round(max(df[f"topo_improvement_rmse_from_{predict_on}"])) + 20,
        20,
    ),
    alpha=0.7,
    label="topo improvement",
)
fig.text(0.15, 0.95, "e)", fontsize=16, va="top", ha="left")

plt.xlabel("meters")
plt.ylabel("Number of ice shelves")
plt.legend(title="Predicted values:")

fig.savefig(
    "../paper/figures/predicted_ice_shelf_values.png",
    bbox_inches="tight",
    dpi=300,
)
[134]:
sampled_params_df[
    [
        "constraint_numbers",
        "constraints_per_10000sq_km",
        "median_proximity",
        "regional_stdev",
    ]
]
[134]:
| constraint_numbers | constraints_per_10000sq_km | median_proximity | regional_stdev | |
|---|---|---|---|---|
| 0 | 4 | 282.666667 | 17.755 | 4.089101 |
| 1 | 4 | 282.666667 | 17.755 | 8.178203 |
| 2 | 4 | 282.666667 | 17.755 | 12.267304 |
| 3 | 4 | 282.666667 | 17.755 | 16.356405 |
| 4 | 4 | 282.666667 | 17.755 | 20.445507 |
| ... | ... | ... | ... | ... |
| 95 | 650 | 496.666667 | 2.520 | 24.534608 |
| 96 | 650 | 496.666667 | 2.520 | 28.623709 |
| 97 | 650 | 496.666667 | 2.520 | 32.712811 |
| 98 | 650 | 496.666667 | 2.520 | 36.801912 |
| 99 | 650 | 496.666667 | 2.520 | 40.891013 |
100 rows × 4 columns
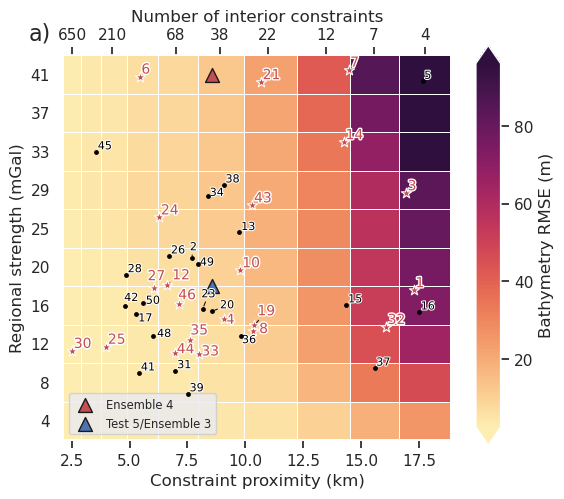
[135]:
fig = synth_plotting.plot_2var_ensemble(
    sampled_params_df,
    figsize=(5, 5),
    x="median_proximity",
    x_title="Constraint proximity (km)",
    y="regional_stdev",
    y_title="Regional strength (mGal)",
    background="final_inversion_rmse",
    background_title="Bathymetry RMSE (m)",
    background_robust=True,
    background_cpt_lims=polar_utils.get_min_max(
        sampled_params_df.final_inversion_rmse,
        robust=True,
    ),
    constrained_layout=False,
)
ax = fig.get_axes()[0]
plt.gcf().text(0.1, 0.9, "a)", fontsize=16, va="bottom", ha="right")
ax.grid(True)

# add second x axis with number of constraints
ax2 = ax.twiny()
ax2.set_xlim(ax.get_xlim())
x_tick_vals = sampled_params_df.median_proximity.unique()
x_tick_labels = sampled_params_df.constraint_numbers.unique()
inds_to_remove = [-2, -4]
x_tick_vals = np.delete(x_tick_vals, inds_to_remove)
x_tick_labels = np.delete(x_tick_labels, inds_to_remove)
x_tick_labels = [round(x) for x in x_tick_labels]
ax2.set_xticks(x_tick_vals)
ax2.set_xticklabels(x_tick_labels)
ax2.grid(False)
ax2.set_xlabel("Number of interior constraints")

# specify y ticks
yvals = list(sampled_params_df.regional_stdev.unique())
ax.set_yticks(yvals)
ax.set_yticklabels([round(x) for x in yvals])

df = shelves_to_plot
ice_shelf_stats.add_shelves_to_ensembles(
    x="median_constraint_distance",
    y=predict_on,
    ice_shelves=df,
    ax=ax,
    legend=False,
)
ax.scatter(
    x=8.557,  # median constraint proximity
    y=40.8,  # regional stdev
    marker="^",
    s=100,
    color="r",
    linewidth=1,
    edgecolor="k",
    label="Ensemble 4",
)
ax.scatter(
    x=8.557,  # median constraint proximity
    y=18.41093,  # regional stdev
    marker="^",
    s=100,
    color="b",
    linewidth=1,
    edgecolor="k",
    label="Test 5/Ensemble 3",
)
handles, labels = ax.get_legend_handles_labels()
ax.legend(
    handles[-2:],
    labels[-2:],
    fontsize="x-small",
    loc="lower left",
)

plt.minorticks_off()

fig.savefig(
    "../paper/figures/Ross_Sea_constraint_vs_regional_ensemble_bathy_error_2var.png",
    bbox_inches="tight",
    dpi=300,
)
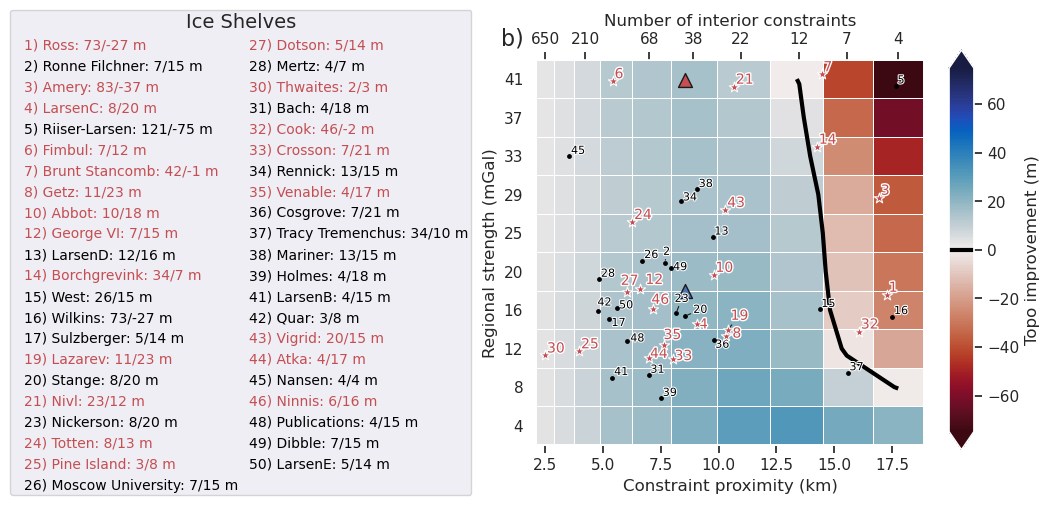
[136]:
df = sampled_params_df
fig = synth_plotting.plot_2var_ensemble(
    df,
    figsize=(5, 5),
    x="median_proximity",
    x_title="Constraint proximity (km)",
    y="regional_stdev",
    y_title="Regional strength (mGal)",
    background="final_inversion_topo_improvement_rmse",
    background_title="Topo improvement (m)",
    background_cmap="cmo.balance_r",
    background_robust=True,
    background_cpt_lims=polar_utils.get_min_max(
        df.final_inversion_topo_improvement_rmse,
        absolute=True,
        robust_percentiles=(0.01, 0.99),
    ),
    plot_contours=[0],
    contour_color="black",
    constrained_layout=False,
)
ax = fig.get_axes()[0]
plt.gcf().text(0.1, 0.9, "b)", fontsize=16, va="bottom", ha="right")
ax.grid(True)

# add second x axis just change labels not values
ax2 = ax.twiny()
ax2.set_xlim(ax.get_xlim())

x_tick_vals = sampled_params_df.median_proximity.unique()
x_tick_labels = sampled_params_df.constraint_numbers.unique()

inds_to_remove = [-2, -4]
x_tick_vals = np.delete(x_tick_vals, inds_to_remove)
x_tick_labels = np.delete(x_tick_labels, inds_to_remove)

x_tick_labels = [round(x) for x in x_tick_labels]
ax2.set_xticks(x_tick_vals)
ax2.set_xticklabels(x_tick_labels)
ax2.grid(False)
ax2.set_xlabel("Number of interior constraints")

# specify y ticks
yvals = list(sampled_params_df.regional_stdev.unique())
ax.set_yticks(yvals)
ax.set_yticklabels([round(x) for x in yvals])

df = shelves_to_plot

ice_shelf_stats.add_shelves_to_ensembles(
    x="median_constraint_distance",
    y=predict_on,
    ice_shelves=df,
    shelves_to_label=df.NAME.unique(),
    ax=ax,
    legend=True,
    legend_cols=2,
    legend_loc="center right",
    legend_bbox_to_anchor=(-0.15, 0.5),
    col_to_add_to_label=[
        f"inversion_rmse_from_{predict_on}",
        f"topo_improvement_rmse_from_{predict_on}",
    ],
)

ax.scatter(
    x=8.557,  # median constraint proximity
    y=40.8,  # regional stdev
    marker="^",
    s=100,
    color="r",
    linewidth=1,
    edgecolor="k",
)
ax.scatter(
    x=8.557,  # median constraint proximity
    y=18.41093,  # regional stdev
    marker="^",
    s=100,
    color="b",
    linewidth=1,
    edgecolor="k",
)

plt.minorticks_off()

fig.savefig(
    "../paper/figures/Ross_Sea_constraint_vs_regional_ensemble_topo_improvement_2var.png",
    bbox_inches="tight",
    dpi=300,
)
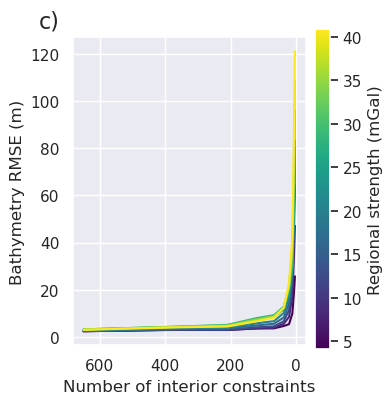
[137]:
fig = synth_plotting.plot_ensemble_as_lines(
    sampled_params_df,
    figsize=(3, 4),
    x="constraint_numbers",
    x_label="Number of interior constraints",
    y="final_inversion_rmse",
    y_label="Bathymetry RMSE (m)",
    groupby_col="regional_stdev",
    cbar_label="Regional strength (mGal)",
    markersize=0,
    flipx=True,
)
ax = fig.get_axes()[0]
plt.gcf().text(0.01, 0.95, "c)", fontsize=16, va="top", ha="left")
[137]:
Text(0.01, 0.95, 'c)')
[138]:
x = "constraint_numbers"
y = "median_proximity"

df = sampled_params_df[[x, y]].copy()

df = pd.concat(
    [df, pd.DataFrame({x: np.arange(df[x].min(), df[x].max(), 1)})]
).drop_duplicates(subset=x)
df = df.sort_values(x).reset_index(drop=True)

df = synthetic.scipy_interp1d(
    df,
    to_interp=y,
    interp_on=x,
    method="cubic",
)
df[df[x].isin([30, 46, 48])]
[138]:
| constraint_numbers | median_proximity | |
|---|---|---|
| 26 | 30 | 9.722335 |
| 42 | 46 | 8.261219 |
| 44 | 48 | 8.119503 |
[139]:
sampled_params_df[["median_proximity", "constraint_numbers"]].drop_duplicates()
[139]:
| median_proximity | constraint_numbers | |
|---|---|---|
| 0 | 17.755 | 4 |
| 10 | 15.534 | 7 |
| 20 | 13.483 | 12 |
| 30 | 10.966 | 22 |
| 40 | 8.902 | 38 |
| 50 | 7.011 | 68 |
| 60 | 5.491 | 119 |
| 70 | 4.256 | 210 |
| 80 | 3.279 | 369 |
| 90 | 2.520 | 650 |
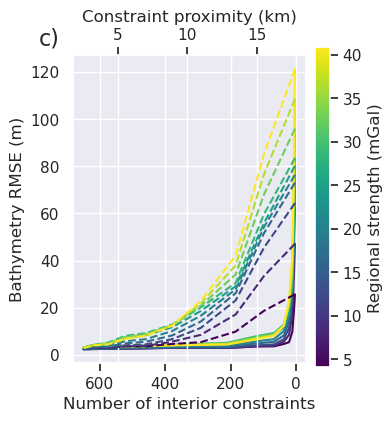
[140]:
ax2 = ax.twiny()
groupby_col = "regional_stdev"
results = sampled_params_df
x = "median_proximity"
y = "final_inversion_rmse"

grouped = results.groupby(groupby_col)
norm = plt.Normalize(
    vmin=results[groupby_col].to_numpy().min(),
    vmax=results[groupby_col].to_numpy().max(),
)
slopes = []
lines = []
for _i, (name, group) in enumerate(grouped):
    ax2.plot(
        group[x],
        group[y],
        "--",
        markersize=0,
        color=plt.cm.viridis(norm(name)),
    )
ax2.set_xlabel("Constraint proximity (km)")

fig.savefig(
    "../paper/figures/Ross_Sea_constraint_vs_regional_ensemble_bathy_error_vs_median_proximity.png",
    bbox_inches="tight",
    dpi=300,
)
fig
[140]:
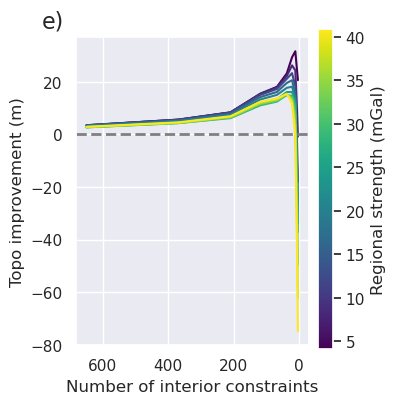
[141]:
fig = synth_plotting.plot_ensemble_as_lines(
    sampled_params_df,
    figsize=(3, 4),
    x="constraint_numbers",
    x_label="Number of interior constraints",
    y="final_inversion_topo_improvement_rmse",
    y_label="Topo improvement (m)",
    groupby_col="regional_stdev",
    cbar_label="Regional strength (mGal)",
    horizontal_line=0,
    markersize=0,
    flipx=True,
)
ax = fig.get_axes()[0]
plt.gcf().text(0.01, 0.95, "e)", fontsize=16, va="top", ha="left")
[141]:
Text(0.01, 0.95, 'e)')
[142]:
grouped = sampled_params_df.groupby("regional_stdev")
x = "constraint_numbers"
y = "final_inversion_topo_improvement_rmse"

constraint_numbers_at_max = []
for _i, (_name, group) in enumerate(grouped):
    df = group[[x, y]].copy()

    df = pd.concat(
        [df, pd.DataFrame({x: np.arange(df[x].min(), df[x].max(), 1)})]
    ).drop_duplicates(subset=x)
    df = df.sort_values(x).reset_index(drop=True)

    df = synthetic.scipy_interp1d(
        df,
        to_interp=y,
        interp_on=x,
        method="cubic",
    )
    max_ind = df[y].idxmax()
    constraint_numbers_at_max.append(df[x].iloc[max_ind])
constraint_numbers_at_max
[142]:
[np.int64(15),
 np.int64(17),
 np.int64(18),
 np.int64(17),
 np.int64(17),
 np.int64(17),
 np.int64(17),
 np.int64(17),
 np.int64(47),
 np.int64(48)]
[143]:
grouped = sampled_params_df.groupby("regional_stdev")
x = "median_proximity"
y = "final_inversion_topo_improvement_rmse"

median_proximity_at_max = []
for _i, (_name, group) in enumerate(grouped):
    df = group[[x, y]].copy()

    df = pd.concat(
        [df, pd.DataFrame({x: np.arange(df[x].min(), df[x].max(), 1)})]
    ).drop_duplicates(subset=x)
    df = df.sort_values(x).reset_index(drop=True)

    df = synthetic.scipy_interp1d(
        df,
        to_interp=y,
        interp_on=x,
        method="cubic",
    )
    max_ind = df[y].idxmax()
    median_proximity_at_max.append(df[x].iloc[max_ind])
median_proximity_at_max
[143]:
[np.float64(12.52),
 np.float64(12.52),
 np.float64(11.52),
 np.float64(11.52),
 np.float64(11.52),
 np.float64(11.52),
 np.float64(12.52),
 np.float64(8.902),
 np.float64(8.902),
 np.float64(8.902)]
[144]:
df = sampled_params_df[["median_proximity", "constraint_numbers"]].drop_duplicates()
df = pd.concat(
    [
        df,
        pd.DataFrame(
            {
                "constraint_numbers": np.arange(
                    df.constraint_numbers.min(), df.constraint_numbers.max(), 1
                )
            }
        ),
    ]
).drop_duplicates(subset="constraint_numbers")
df = df.sort_values("constraint_numbers").reset_index(drop=True)

df = synthetic.scipy_interp1d(
    df,
    to_interp="median_proximity",
    interp_on="constraint_numbers",
    method="cubic",
)
df[df.constraint_numbers.isin(constraint_numbers_at_max)]
[144]:
| median_proximity | constraint_numbers | |
|---|---|---|
| 11 | 12.603298 | 15 |
| 13 | 12.077271 | 17 |
| 14 | 11.831991 | 18 |
| 43 | 8.189504 | 47 |
| 44 | 8.119503 | 48 |
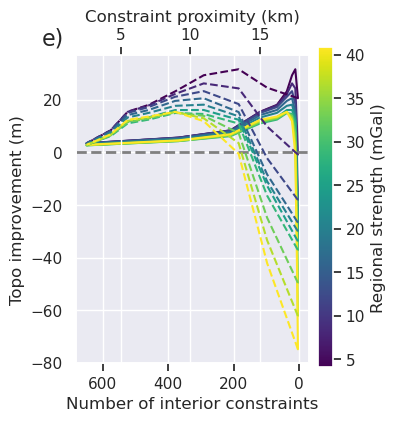
[145]:
ax2 = ax.twiny()
groupby_col = "regional_stdev"
results = sampled_params_df
x = "median_proximity"
y = "final_inversion_topo_improvement_rmse"

grouped = results.groupby(groupby_col)

norm = plt.Normalize(
    vmin=results[groupby_col].to_numpy().min(),
    vmax=results[groupby_col].to_numpy().max(),
)
slopes = []
lines = []
for _i, (name, group) in enumerate(grouped):
    ax2.plot(
        group[x],
        group[y],
        "--",
        markersize=0,
        color=plt.cm.viridis(norm(name)),
    )

ax2.set_xlabel("Constraint proximity (km)")
fig
[145]:
[146]:
fig = synth_plotting.plot_ensemble_as_lines(
    sampled_params_df,
    figsize=(3, 4),
    x="regional_stdev",
    x_label="Regional strength (mGal)",
    y="final_inversion_rmse",
    y_label="Bathymetry RMSE (m)",
    groupby_col="median_proximity",
    cbar_label="Constraint proximity (km)",
    trend_line=True,
    slope_min_max=True,
    slope_decimals=2,
)

plt.gcf().text(0.15, 0.95, "d)", fontsize=16, va="top", ha="left")

plt.savefig(
    "../paper/figures/Ross_Sea_constraint_vs_regional_ensemble_bathy_error_vs_regional_strength.png",
    bbox_inches="tight",
    dpi=300,
)
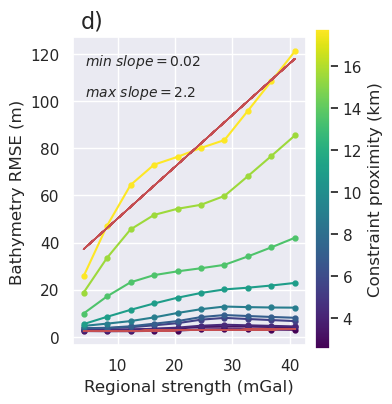
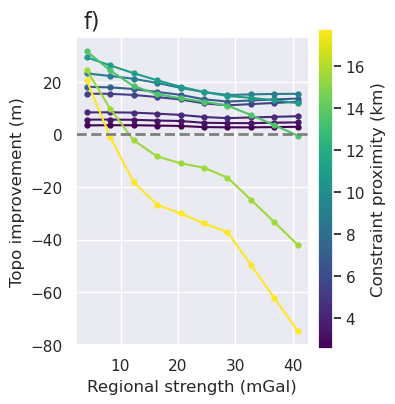
[147]:
fig = synth_plotting.plot_ensemble_as_lines(
    sampled_params_df,
    figsize=(3, 4),
    x="regional_stdev",
    x_label="Regional strength (mGal)",
    y="final_inversion_topo_improvement_rmse",
    y_label="Topo improvement (m)",
    groupby_col="median_proximity",
    cbar_label="Constraint proximity (km)",
    horizontal_line=0,
)
plt.gcf().text(0.15, 0.95, "f)", fontsize=16, va="top", ha="left")
[147]:
Text(0.15, 0.95, 'f)')
Ensembles 2-4: grav spacing vs noise
[4]:
no_ensemble_path = "../results/Ross_Sea/ensembles/Ross_Sea_ensemble_02_grav_spacing_vs_noise_no_regional_density_estimation"
no_ensemble_fname = f"{no_ensemble_path}.csv"
sampled_params_df_no_regional = pd.read_csv(no_ensemble_fname)

medium_ensemble_path = "../results/Ross_Sea/ensembles/Ross_Sea_ensemble_03_grav_spacing_vs_noise_medium_regional_density_estimation"
medium_ensemble_fname = f"{medium_ensemble_path}.csv"
sampled_params_df_medium_regional = pd.read_csv(medium_ensemble_fname)

strong_ensemble_path = "../results/Ross_Sea/ensembles/Ross_Sea_ensemble_04_grav_spacing_vs_noise_strong_regional_density_estimation"
strong_ensemble_fname = f"{strong_ensemble_path}.csv"
sampled_params_df_strong_regional = pd.read_csv(strong_ensemble_fname)
[5]:
bathymetry_path = pathlib.Path(no_ensemble_path + "_starting_bathymetry").with_suffix(
    ".nc"
)
starting_bathymetry = xr.open_dataarray(bathymetry_path)

starting_bathymetry = starting_bathymetry.sel(
    easting=slice(plot_region[0], plot_region[1]),
    northing=slice(plot_region[2], plot_region[3]),
)

constraints_path = pathlib.Path(no_ensemble_path + "_constraint_points").with_suffix(
    ".csv"
)
constraint_points = pd.read_csv(constraints_path)

starting_bathymetry_rmse = float(utils.rmse(bathymetry - starting_bathymetry))

contours = [starting_bathymetry_rmse]

starting_bathymetry_rmse
[5]:
25.977349421327325
[6]:
figsize = (4, 4)

cpt_lims = polar_utils.get_combined_min_max(
    [
        sampled_params_df_no_regional.final_inversion_rmse,
        sampled_params_df_medium_regional.final_inversion_rmse,
        sampled_params_df_strong_regional.final_inversion_rmse,
    ],
    robust=True,
    robust_percentiles=(0.1, 0.9),
)
line_plot_ylims = polar_utils.get_combined_min_max(
    [
        sampled_params_df_no_regional.final_inversion_rmse,
        sampled_params_df_medium_regional.final_inversion_rmse,
        sampled_params_df_strong_regional.final_inversion_rmse,
    ],
)
line_plot_ylims = (line_plot_ylims[0] * 0.9, line_plot_ylims[1] * 1.1)

cpt_lims
[6]:
(np.float64(11.536359095996527), np.float64(37.96154893557483))
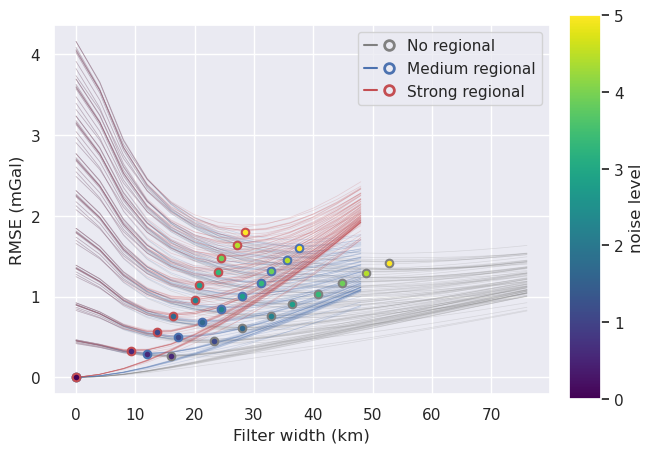
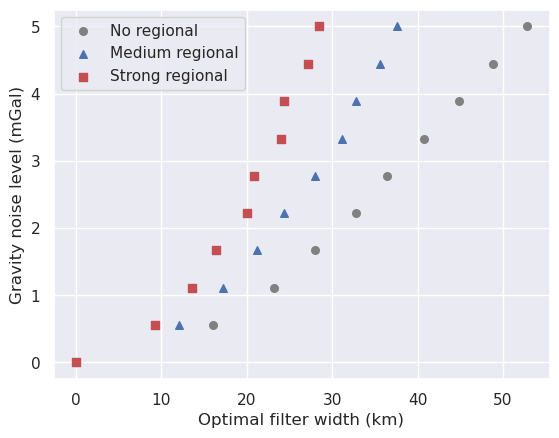
Plot optimal filter widths
[151]:
fig, ax = plt.subplots()

norm = plt.Normalize(
    vmin=sampled_params_df_no_regional.grav_noise_levels.to_numpy().min(),
    vmax=sampled_params_df_no_regional.grav_noise_levels.to_numpy().max(),
)

grouped = sampled_params_df_no_regional.groupby("grav_noise_levels")
for name, group in grouped:
    best_filters = []
    best_rmses = []
    for _i, row in group.iterrows():
        # load data
        filter_width_trials = pd.read_csv(row.filter_width_trials_fname)

        best_ind = filter_width_trials.rmse.idxmin()
        best_filter_width = filter_width_trials.iloc[best_ind].filt_width
        best_rmse = filter_width_trials.iloc[best_ind].rmse
        best_filters.append(best_filter_width)
        best_rmses.append(best_rmse)

        ax.plot(
            filter_width_trials.filt_width / 1e3,
            filter_width_trials.rmse,
            color="gray",
            alpha=0.2,
            linewidth=0.5,
        )

    color = plt.cm.viridis(norm(name))  # pylint: disable=no-member
    ax.scatter(
        x=np.mean(best_filters) / 1e3,
        y=np.mean(best_rmses),
        marker="o",
        edgecolor="gray",
        linewidth=1.5,
        color=color,
        s=30,
        zorder=20,
    )

grouped = sampled_params_df_medium_regional.groupby("grav_noise_levels")
for name, group in grouped:
    best_filters = []
    best_rmses = []
    for _i, row in group.iterrows():
        # load data
        filter_width_trials = pd.read_csv(row.filter_width_trials_fname)

        best_ind = filter_width_trials.rmse.idxmin()
        best_filter_width = filter_width_trials.iloc[best_ind].filt_width
        best_rmse = filter_width_trials.iloc[best_ind].rmse
        best_filters.append(best_filter_width)
        best_rmses.append(best_rmse)

        ax.plot(
            filter_width_trials.filt_width / 1e3,
            filter_width_trials.rmse,
            color="b",
            alpha=0.2,
            linewidth=0.5,
        )

    color = plt.cm.viridis(norm(name))  # pylint: disable=no-member
    ax.scatter(
        x=np.mean(best_filters) / 1e3,
        y=np.mean(best_rmses),
        marker="o",
        edgecolor="b",
        linewidth=1.5,
        color=color,
        s=30,
        zorder=20,
    )

grouped = sampled_params_df_strong_regional.groupby("grav_noise_levels")
for name, group in grouped:
    best_filters = []
    best_rmses = []
    for _i, row in group.iterrows():
        # load data
        filter_width_trials = pd.read_csv(row.filter_width_trials_fname)

        best_ind = filter_width_trials.rmse.idxmin()
        best_filter_width = filter_width_trials.iloc[best_ind].filt_width
        best_rmse = filter_width_trials.iloc[best_ind].rmse
        best_filters.append(best_filter_width)
        best_rmses.append(best_rmse)

        ax.plot(
            filter_width_trials.filt_width / 1e3,
            filter_width_trials.rmse,
            color="r",
            alpha=0.2,
            linewidth=0.5,
        )

    color = plt.cm.viridis(norm(name))  # pylint: disable=no-member
    ax.scatter(
        x=np.mean(best_filters) / 1e3,
        y=np.mean(best_rmses),
        marker="o",
        edgecolor="r",
        linewidth=1.5,
        color=color,
        s=30,
        zorder=20,
    )

ax.set_xlabel("Filter width (km)")
ax.set_ylabel("RMSE (mGal)")
sm = plt.cm.ScalarMappable(cmap="viridis", norm=norm)
cax = fig.add_axes([0.93, 0.1, 0.05, 0.8])
cbar = plt.colorbar(sm, cax=cax)
cbar.set_label("noise level")

# create manual symbols for legend
symbols = []
line = mpl.lines.Line2D(
    [0],
    [0],
    color="gray",
)
point = mpl.lines.Line2D(
    [0],
    [0],
    marker="o",
    markersize=7,
    markeredgecolor="gray",
    markerfacecolor="None",
    markeredgewidth=2,
    linestyle="",
)
symbols.append((line, point))

line = mpl.lines.Line2D(
    [0],
    [0],
    color="b",
)
point = mpl.lines.Line2D(
    [0],
    [0],
    marker="o",
    markersize=7,
    markeredgecolor="b",
    markerfacecolor="None",
    markeredgewidth=2,
    linestyle="",
)
symbols.append((line, point))

line = mpl.lines.Line2D(
    [0],
    [0],
    color="r",
)
point = mpl.lines.Line2D(
    [0],
    [0],
    marker="o",
    markersize=7,
    markeredgecolor="r",
    markerfacecolor="None",
    markeredgewidth=2,
    linestyle="",
)
symbols.append((line, point))

ax.legend(
    symbols,
    ["No regional", "Medium regional", "Strong regional"],
    handler_map={tuple: mpl.legend_handler.HandlerTuple(ndivide=None)},
)


fig
[151]:

[152]:
fig, ax = plt.subplots()

grouped = sampled_params_df_no_regional.groupby("grav_noise_levels")
for j, (name, group) in enumerate(grouped):
    best_filters = []
    for i, row in group.iterrows():
        filter_width_trials = pd.read_csv(row.filter_width_trials_fname)
        best_ind = filter_width_trials.rmse.idxmin()
        best_filter_width = filter_width_trials.iloc[best_ind].filt_width
        best_filters.append(best_filter_width)

    color = "gray"
    label = "No regional" if j == 0 else None
    ax.scatter(
        x=np.mean(best_filters) / 1e3,
        y=name,
        marker="o",
        color=color,
        s=30,
        zorder=20,
        label=label,
    )

grouped = sampled_params_df_medium_regional.groupby("grav_noise_levels")
for j, (name, group) in enumerate(grouped):
    best_filters = []
    for _i, row in group.iterrows():
        filter_width_trials = pd.read_csv(row.filter_width_trials_fname)
        best_ind = filter_width_trials.rmse.idxmin()
        best_filter_width = filter_width_trials.iloc[best_ind].filt_width
        best_filters.append(best_filter_width)

    color = "b"
    label = "Medium regional" if j == 0 else None
    ax.scatter(
        x=np.mean(best_filters) / 1e3,
        y=name,
        marker="^",
        color=color,
        s=30,
        zorder=20,
        label=label,
    )


grouped = sampled_params_df_strong_regional.groupby("grav_noise_levels")
for j, (name, group) in enumerate(grouped):
    best_filters = []
    for _i, row in group.iterrows():
        filter_width_trials = pd.read_csv(row.filter_width_trials_fname)
        best_ind = filter_width_trials.rmse.idxmin()
        best_filter_width = filter_width_trials.iloc[best_ind].filt_width
        best_filters.append(best_filter_width)

    color = "r"
    label = "Strong regional" if j == 0 else None
    ax.scatter(
        x=np.mean(best_filters) / 1e3,
        y=name,
        marker="s",
        color=color,
        s=30,
        zorder=20,
        label=label,
    )

ax.legend()
ax.set_xlabel("Optimal filter width (km)")
ax.set_ylabel("Gravity noise level (mGal)")
[152]:
Text(0, 0.5, 'Gravity noise level (mGal)')
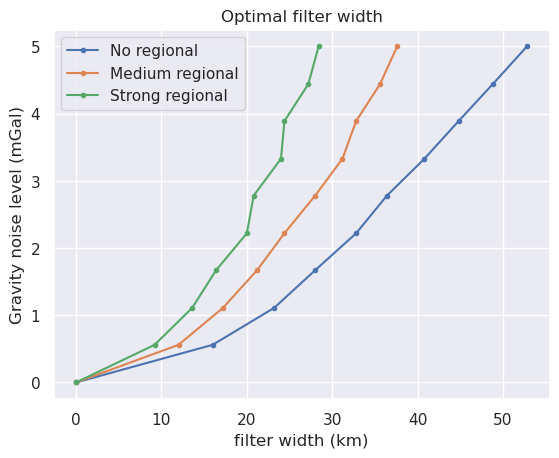
[153]:
fig, ax = plt.subplots()

dfs = []
grouped = sampled_params_df_no_regional.groupby("grav_noise_levels")
for _j, (name, group) in enumerate(grouped):
    best_filters = []
    for _i, row in group.iterrows():
        filter_width_trials = pd.read_csv(row.filter_width_trials_fname)
        best_ind = filter_width_trials.rmse.idxmin()
        best_filter_width = filter_width_trials.iloc[best_ind].filt_width
        best_filters.append(best_filter_width)

    dfs.append(
        pd.DataFrame(
            [
                {
                    "filter_width": np.mean(best_filters) / 1e3,
                    "noise": name,
                    "regional": "none",
                }
            ]
        )
    )

grouped = sampled_params_df_medium_regional.groupby("grav_noise_levels")
for _j, (name, group) in enumerate(grouped):
    best_filters = []
    for _i, row in group.iterrows():
        filter_width_trials = pd.read_csv(row.filter_width_trials_fname)
        best_ind = filter_width_trials.rmse.idxmin()
        best_filter_width = filter_width_trials.iloc[best_ind].filt_width
        best_filters.append(best_filter_width)

    dfs.append(
        pd.DataFrame(
            [
                {
                    "filter_width": np.mean(best_filters) / 1e3,
                    "noise": name,
                    "regional": "medium",
                }
            ]
        )
    )

grouped = sampled_params_df_strong_regional.groupby("grav_noise_levels")
for _j, (name, group) in enumerate(grouped):
    best_filters = []
    for _i, row in group.iterrows():
        filter_width_trials = pd.read_csv(row.filter_width_trials_fname)
        best_ind = filter_width_trials.rmse.idxmin()
        best_filter_width = filter_width_trials.iloc[best_ind].filt_width
        best_filters.append(best_filter_width)

    dfs.append(
        pd.DataFrame(
            [
                {
                    "filter_width": np.mean(best_filters) / 1e3,
                    "noise": name,
                    "regional": "strong",
                }
            ]
        )
    )

df = pd.concat(dfs)

df_subset = df[df.regional == "none"]
ax.plot(
    df_subset.filter_width,
    df_subset.noise,
    ".-",
    label="No regional",
)
df_subset = df[df.regional == "medium"]
ax.plot(
    df_subset.filter_width,
    df_subset.noise,
    ".-",
    label="Medium regional",
)
df_subset = df[df.regional == "strong"]
ax.plot(
    df_subset.filter_width,
    df_subset.noise,
    ".-",
    label="Strong regional",
)

ax.legend()
ax.set_xlabel("filter width (km)")
ax.set_ylabel("Gravity noise level (mGal)")
ax.set_title("Optimal filter width")
[153]:
Text(0.5, 1.0, 'Optimal filter width')
No regional
[7]:
sampled_params_df_no_regional[
    [
        "final_inversion_rmse",
        "final_inversion_topo_improvement_rmse",
    ]
].describe()
[7]:
| final_inversion_rmse | final_inversion_topo_improvement_rmse | |
|---|---|---|
| count | 100.000000 | 100.000000 |
| mean | 24.420991 | 1.556358 |
| std | 10.067175 | 10.067175 |
| min | 3.387418 | -23.450514 |
| 25% | 17.763109 | -3.645639 |
| 50% | 24.550003 | 1.427347 |
| 75% | 29.622989 | 8.214240 |
| max | 49.427864 | 22.589931 |
[8]:
sampled_params_df_no_regional.columns
[8]:
Index(['grav_line_numbers', 'grav_noise_levels', 'grav_df_fname',
       'grav_survey_df_fname', 'grav_line_spacing', 'grav_proximity',
       'grav_proximity_skew', 'flight_kms', 'flight_kms_per_10000sq_km',
       'filter_width_trials_fname', 'best_filter_width', 'grav_data_loss_rmse',
       'grav_data_loss_mae', 'results_fname', 'inverted_bathymetry_fname',
       'best_density_contrast', 'constraints_rmse', 'inversion_rmse',
       'final_inversion_fname', 'final_inverted_bathymetry_fname',
       'final_inversion_constraints_rmse', 'final_inversion_rmse',
       'final_inversion_topo_improvement_rmse'],
      dtype='object')
[9]:
np.linspace(5, 55, 6)
[9]:
array([ 5., 15., 25., 35., 45., 55.])
[10]:
df = sampled_params_df_no_regional[
    ["grav_proximity", "grav_line_spacing"]
].drop_duplicates()
df = df.sort_values("grav_line_spacing", ascending=False)
df = pd.concat(
    [
        df,
        pd.DataFrame(
            {
                "grav_line_spacing": np.arange(
                    round(df.grav_line_spacing.min()),
                    round(df.grav_line_spacing.max()) + 1,
                    1,
                )
            }
        ),
    ]
).drop_duplicates(subset="grav_line_spacing")
df = df.sort_values("grav_line_spacing", ascending=False).reset_index(drop=True)

df = synthetic.scipy_interp1d(
    df,
    to_interp="grav_proximity",
    interp_on="grav_line_spacing",
    method="cubic",
)
df = df[["grav_line_spacing", "grav_proximity"]]

df = df[
    df.grav_line_spacing.isin(
        np.arange(
            round(sampled_params_df_no_regional.grav_line_spacing.min()),
            round(sampled_params_df_no_regional.grav_line_spacing.max()) + 1,
            10,
        )
    )
]
df
[10]:
| grav_line_spacing | grav_proximity | |
|---|---|---|
| 3 | 56.0 | 8.016317 |
| 13 | 46.0 | 6.580356 |
| 24 | 36.0 | 5.139188 |
| 35 | 26.0 | 3.736880 |
| 46 | 16.0 | 2.294572 |
| 60 | 6.0 | 0.851066 |
[11]:
fig = synth_plotting.plot_2var_ensemble(
sampled_params_df_no_regional,
figsize=figsize,
x="grav_proximity",
x_title="Gravity data proximity (km)",
y="grav_noise_levels",
y_title="Gravity noise (mGal)",
background="final_inversion_rmse",
background_title="Bathymetry RMSE (m)",
background_robust=True,
plot_contours=contours,
contour_color="cyan",
background_cpt_lims=cpt_lims,
colorbar=False,
constrained_layout=False,
)
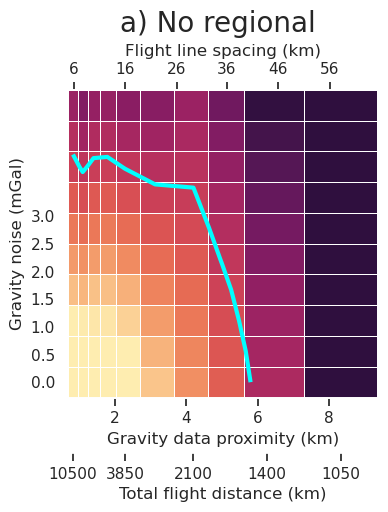
plt.gcf().text(0.5, 1.01, "a) No regional", fontsize=20, va="bottom", ha="center")
ax = fig.get_axes()[0]
# add second x axis with flight line spacing
ax2 = ax.twiny()
ax2.set_xlim(ax.get_xlim())
x_tick_vals = df.grav_proximity.unique()
x_tick_labels = df.grav_line_spacing.unique()
x_tick_labels = [int(x) for x in x_tick_labels]
ax2.set_xticks(x_tick_vals)
ax2.set_xticklabels(x_tick_labels)
ax2.grid(False)
ax2.set_xlabel("Flight line spacing (km)")
# add third x axis for flight distance
ax3 = ax.twiny()
ax3.set_xlim(ax.get_xlim())
x_tick_vals = sampled_params_df_no_regional.grav_proximity.unique()
x_tick_labels = sampled_params_df_no_regional.flight_kms.unique()
inds_to_remove = [-2, -3, -4, -6, -8]
x_tick_vals = np.delete(x_tick_vals, inds_to_remove)
x_tick_labels = np.delete(x_tick_labels, inds_to_remove)
x_tick_labels = [round(x) for x in x_tick_labels]
ax3.set_xticks(x_tick_vals)
ax3.set_xticklabels(x_tick_labels)
ax3.grid(False)
ax3.set_xlabel("Total flight distance (km)")
ax3.xaxis.set_ticks_position("bottom")
ax3.xaxis.set_label_position("bottom")
ax3.spines["bottom"].set_position(("outward", 40))
# specify y ticks
ax.set_yticks(np.arange(0, 3.5, 0.5))
fig.savefig(
"../paper/figures/Ross_Sea_noise_vs_spacing_no_regional_2var.png",
bbox_inches="tight",
dpi=300,
)

[12]:
fig = synth_plotting.plot_2var_ensemble(
    sampled_params_df_no_regional,
    figsize=figsize,
    x="grav_proximity",
    x_title="Gravity data proximity (km)",
    y="grav_noise_levels",
    y_title="Gravity noise (mGal)",
    background="final_inversion_rmse",
    background_title="Bathymetry RMSE (m)",
    background_robust=True,
    plot_contours=contours,
    contour_color="cyan",
    background_cpt_lims=cpt_lims,
    colorbar=False,
    constrained_layout=False,
)
plt.gcf().text(0.5, 1.01, "a) No regional", fontsize=20, va="bottom", ha="center")
ax = fig.get_axes()[0]

# add second x axis with flight line spacing
ax2 = ax.twiny()
ax2.set_xlim(ax.get_xlim())
x_tick_vals = df.grav_proximity.unique()
x_tick_labels = df.grav_line_spacing.unique()
x_tick_labels = [int(x) for x in x_tick_labels]
ax2.set_xticks(x_tick_vals)
ax2.set_xticklabels(x_tick_labels)
ax2.grid(False)
ax2.set_xlabel("Flight line spacing (km)")

# add third x axis for flight distance
ax3 = ax.twiny()
ax3.set_xlim(ax.get_xlim())
x_tick_vals = sampled_params_df_no_regional.grav_proximity.unique()
x_tick_labels = sampled_params_df_no_regional.flight_kms.unique()
inds_to_remove = [-2, -3, -4, -6, -8]
x_tick_vals = np.delete(x_tick_vals, inds_to_remove)
x_tick_labels = np.delete(x_tick_labels, inds_to_remove)
x_tick_labels = [round(x) for x in x_tick_labels]
ax3.set_xticks(x_tick_vals)
ax3.set_xticklabels(x_tick_labels)
ax3.grid(False)
ax3.set_xlabel("Total flight distance (km)")
ax3.xaxis.set_ticks_position("bottom")
ax3.xaxis.set_label_position("bottom")
ax3.spines["bottom"].set_position(("outward", 40))

# specify y ticks
ax.set_yticks(np.arange(0, 3.5, 0.5))

fig.savefig(
    "../paper/figures/Ross_Sea_noise_vs_spacing_no_regional_2var_supplement.png",
    bbox_inches="tight",
    dpi=300,
)
[13]:
fig = synth_plotting.plot_ensemble_as_lines(
sampled_params_df_no_regional,
figsize=(figsize[0], figsize[1] / 2),
x="grav_noise_levels",
x_label="Gravity noise (mGal)",
y="final_inversion_rmse",
y_label="Bathymetry RMSE (m)",
groupby_col="grav_line_spacing",
cbar_label="Line spacing (km)",
trend_line=True,
slope_min_max=True,
slope_decimals=1,
horizontal_line=contours,
y_lims=line_plot_ylims,
colorbar=False,
)
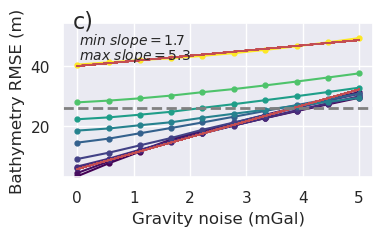
plt.gcf().text(0.15, 0.95, "c)", fontsize=16, va="top", ha="left")
plt.savefig(
"../paper/figures/Ross_Sea_noise_vs_spacing_no_regional_bathy_error_vs_grav_noise.png",
bbox_inches="tight",
dpi=300,
)
[14]:
fig = synth_plotting.plot_ensemble_as_lines(
sampled_params_df_no_regional,
figsize=(figsize[0], figsize[1] / 2),
x="grav_noise_levels",
x_label="Gravity noise (mGal)",
y="final_inversion_rmse",
y_label="Bathymetry RMSE (m)",
groupby_col="grav_line_spacing",
cbar_label="Line spacing (km)",
trend_line=True,
slope_min_max=True,
slope_decimals=1,
horizontal_line=contours,
y_lims=line_plot_ylims,
colorbar=False,
)
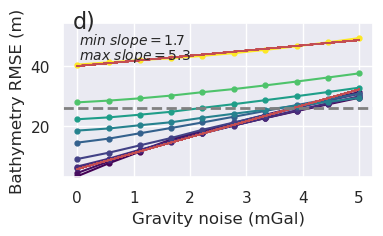
plt.gcf().text(0.15, 0.95, "d)", fontsize=16, va="top", ha="left")
plt.savefig(
"../paper/figures/Ross_Sea_noise_vs_spacing_no_regional_bathy_error_vs_grav_noise_supplement.png",
bbox_inches="tight",
dpi=300,
)
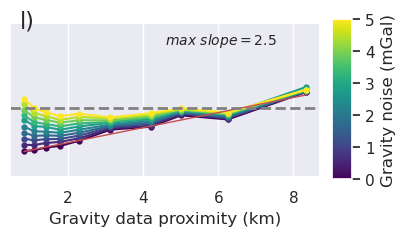
[15]:
x = "grav_proximity"
fig = synth_plotting.plot_ensemble_as_lines(
    sampled_params_df_no_regional,
    figsize=(figsize[0], figsize[1] / 2),
    x=x,
    x_label="Gravity data proximity (km)",
    y="final_inversion_rmse",
    y_label="Bathymetry RMSE (m)",
    groupby_col="grav_noise_levels",
    cbar_label="Gravity noise (mGal)",
    horizontal_line=contours,
    y_lims=line_plot_ylims,
    colorbar=False,
    trend_line=True,
    slope_max=True,
    slope_decimals=1,
)
plt.gcf().text(0.15, 0.95, "g)", fontsize=16, va="top", ha="left")

plt.savefig(
    "../paper/figures/Ross_Sea_noise_vs_spacing_no_regional_bathy_error_vs_grav_spacing_2.png",
    bbox_inches="tight",
    dpi=300,
)

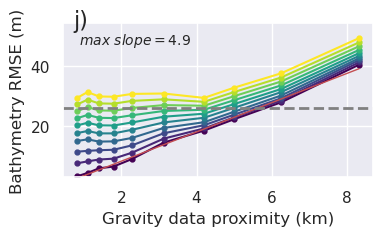
[16]:
x = "grav_proximity"
fig = synth_plotting.plot_ensemble_as_lines(
    sampled_params_df_no_regional,
    figsize=(figsize[0], figsize[1] / 2),
    x=x,
    x_label="Gravity data proximity (km)",
    y="final_inversion_rmse",
    y_label="Bathymetry RMSE (m)",
    groupby_col="grav_noise_levels",
    cbar_label="Gravity noise (mGal)",
    horizontal_line=contours,
    y_lims=line_plot_ylims,
    colorbar=False,
    trend_line=True,
    slope_max=True,
    slope_decimals=1,
)
plt.gcf().text(0.15, 0.95, "j)", fontsize=16, va="top", ha="left")

plt.savefig(
    "../paper/figures/Ross_Sea_noise_vs_spacing_no_regional_bathy_error_vs_grav_spacing_2_supplement.png",
    bbox_inches="tight",
    dpi=300,
)
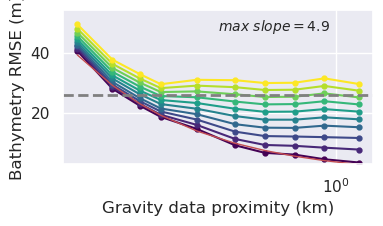
[17]:
x = "grav_proximity"
fig = synth_plotting.plot_ensemble_as_lines(
    sampled_params_df_no_regional,
    figsize=(figsize[0], figsize[1] / 2),
    x=x,
    x_label="Gravity data proximity (km)",
    y="final_inversion_rmse",
    y_label="Bathymetry RMSE (m)",
    groupby_col="grav_noise_levels",
    cbar_label="Gravity noise (mGal)",
    horizontal_line=contours,
    y_lims=line_plot_ylims,
    logx=True,
    flipx=True,
    colorbar=False,
    trend_line=True,
    slope_max=True,
    trend_line_text_loc=(0.5, 0.95),
    slope_decimals=1,
)
[162]:
sampled_params_df_no_regional[
    ["grav_proximity", "grav_line_spacing", "flight_kms"]
].drop_duplicates()
[162]:
| grav_proximity | grav_line_spacing | flight_kms | |
|---|---|---|---|
| 0 | 8.333333 | 58.333333 | 1050.0 |
| 10 | 6.250800 | 43.750000 | 1400.0 |
| 20 | 5.001000 | 35.000000 | 1750.0 |
| 30 | 4.200000 | 29.166667 | 2100.0 |
| 40 | 3.126600 | 21.875000 | 2800.0 |
| 50 | 2.281510 | 15.909091 | 3850.0 |
| 60 | 1.788512 | 12.500000 | 4900.0 |
| 70 | 1.400000 | 9.722222 | 6300.0 |
| 80 | 1.096652 | 7.608696 | 8050.0 |
| 90 | 0.824621 | 5.833333 | 10500.0 |
[18]:
fig = synth_plotting.plot_ensemble_as_lines(
    sampled_params_df_no_regional,
    figsize=(figsize[0], figsize[1] / 2),
    x="flight_kms",
    x_label="Flight distance (km)",
    y="final_inversion_rmse",
    y_label="Bathymetry RMSE (m)",
    groupby_col="grav_noise_levels",
    cbar_label="Gravity noise (mGal)",
    horizontal_line=contours,
    y_lims=line_plot_ylims,
    colorbar=False,
)
plt.gcf().text(0.15, 0.95, "e)", fontsize=16, va="top", ha="left")

ax = fig.get_axes()[0]

plt.savefig(
    "../paper/figures/Ross_Sea_noise_vs_spacing_no_regional_bathy_error_vs_grav_spacing.png",
    bbox_inches="tight",
    dpi=300,
)
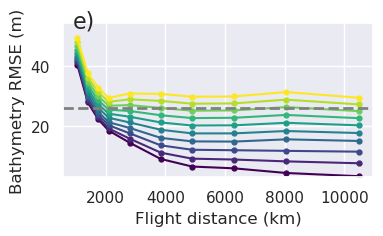
[19]:
fig = synth_plotting.plot_ensemble_as_lines(
    sampled_params_df_no_regional,
    figsize=(figsize[0], figsize[1] / 2),
    x="flight_kms",
    x_label="Flight distance (km)",
    y="final_inversion_rmse",
    y_label="Bathymetry RMSE (m)",
    groupby_col="grav_noise_levels",
    cbar_label="Gravity noise (mGal)",
    horizontal_line=contours,
    y_lims=line_plot_ylims,
    colorbar=False,
)
plt.gcf().text(0.15, 0.95, "g)", fontsize=16, va="top", ha="left")

ax = fig.get_axes()[0]

plt.savefig(
    "../paper/figures/Ross_Sea_noise_vs_spacing_no_regional_bathy_error_vs_grav_spacing_supplement.png",
    bbox_inches="tight",
    dpi=300,
)

Medium regional
[20]:
sampled_params_df_medium_regional[
    [
        "final_inversion_rmse",
        "final_inversion_topo_improvement_rmse",
    ]
].describe()
[20]:
| final_inversion_rmse | final_inversion_topo_improvement_rmse | |
|---|---|---|
| count | 100.000000 | 100.000000 |
| mean | 21.131537 | 4.845812 |
| std | 5.237103 | 5.237103 |
| min | 8.893398 | -4.575229 |
| 25% | 17.833364 | 1.527872 |
| 50% | 21.596023 | 4.381327 |
| 75% | 24.449477 | 8.143986 |
| max | 30.552578 | 17.083951 |
[21]:
cols = [
    "grav_proximity",
    "grav_line_spacing",
    "grav_line_numbers",
    "flight_kms_per_10000sq_km",
]
sampled_params_df_medium_regional[cols]
[21]:
| grav_proximity | grav_line_spacing | grav_line_numbers | flight_kms_per_10000sq_km | |
|---|---|---|---|---|
| 0 | 8.333333 | 58.333333 | 3 | 350.0 |
| 1 | 8.333333 | 58.333333 | 3 | 350.0 |
| 2 | 8.333333 | 58.333333 | 3 | 350.0 |
| 3 | 8.333333 | 58.333333 | 3 | 350.0 |
| 4 | 8.333333 | 58.333333 | 3 | 350.0 |
| ... | ... | ... | ... | ... |
| 95 | 0.824621 | 5.833333 | 30 | 3500.0 |
| 96 | 0.824621 | 5.833333 | 30 | 3500.0 |
| 97 | 0.824621 | 5.833333 | 30 | 3500.0 |
| 98 | 0.824621 | 5.833333 | 30 | 3500.0 |
| 99 | 0.824621 | 5.833333 | 30 | 3500.0 |
100 rows × 4 columns
[166]:
fig, ax = plt.subplots()

ax.plot(
    sampled_params_df_medium_regional.flight_kms_per_10000sq_km.drop_duplicates().reset_index(
        drop=True,
    ),
    c="r",
    label="flight_kms_per_10000sq_km",
)

ax2 = ax.twinx()

ax2.plot(
    sampled_params_df_medium_regional.grav_proximity.drop_duplicates()[
        ::-1
    ].reset_index(
        drop=True,
    ),
    label="grav proximity",
)
ax2.set_yscale("log")
ax.set_yscale("log")
ax.legend()
ax2.legend(loc="upper right")
[166]:
<matplotlib.legend.Legend at 0x7f237efd4380>
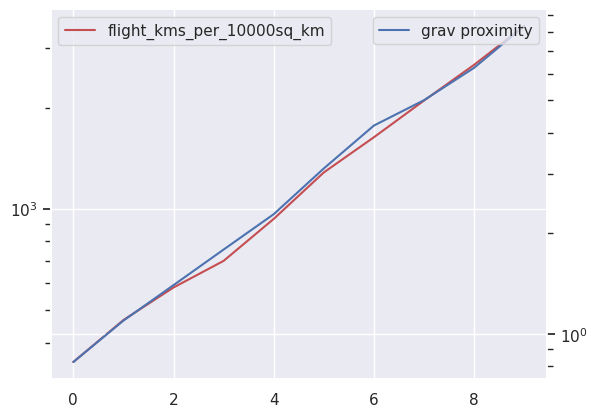
[167]:
sampled_params_df_medium_regional.describe()
[167]:
| grav_line_numbers | grav_noise_levels | grav_line_spacing | grav_proximity | best_filter_width | grav_data_loss_rmse | grav_data_loss_mae | best_density_contrast | constraints_rmse | inversion_rmse | final_inversion_constraints_rmse | final_inversion_rmse | flight_kms | flight_kms_per_10000sq_km | final_inversion_topo_improvement_rmse | |
|---|---|---|---|---|---|---|---|---|---|---|---|---|---|---|---|
| count | 100.000000 | 100.000000 | 100.000000 | 100.000000 | 100.000000 | 100.000000 | 100.000000 | 100.00000 | 100.000000 | 100.000000 | 100.000000 | 100.000000 | 100.000000 | 100.000000 | 100.000000 |
| mean | 12.200000 | 2.500000 | 23.969834 | 3.430303 | 24000.000000 | 1.780893 | 1.180243 | 2180.12000 | 367.880388 | 282.232894 | 1.705901 | 21.131537 | 4270.000000 | 1423.333333 | 4.845812 |
| std | 8.596452 | 1.602586 | 16.579504 | 2.368128 | 11327.984478 | 1.219806 | 0.774931 | 85.26492 | 3.796844 | 5.044024 | 1.082847 | 5.237103 | 3008.758259 | 1002.919420 | 5.237103 |
| min | 3.000000 | 0.000000 | 5.833333 | 0.824621 | 0.000000 | 0.064224 | 0.030205 | 2005.00000 | 359.878723 | 271.399901 | 0.854600 | 8.893398 | 1050.000000 | 350.000000 | -4.575229 |
| 25% | 5.000000 | 1.110000 | 9.722222 | 1.400000 | 16000.000000 | 0.948187 | 0.661004 | 2126.00000 | 364.774192 | 279.607499 | 1.072745 | 17.833364 | 1750.000000 | 583.333333 | 1.527872 |
| 50% | 9.500000 | 2.500000 | 18.892045 | 2.704055 | 26000.000000 | 1.449938 | 1.034806 | 2201.00000 | 367.995013 | 283.721422 | 1.447300 | 21.596023 | 3325.000000 | 1108.333333 | 4.381327 |
| 75% | 18.000000 | 3.890000 | 35.000000 | 5.001000 | 32000.000000 | 2.223598 | 1.480499 | 2225.25000 | 371.029656 | 285.003154 | 1.760384 | 24.449477 | 6300.000000 | 2100.000000 | 8.143986 |
| max | 30.000000 | 5.000000 | 58.333333 | 8.333333 | 44000.000000 | 4.726163 | 3.261470 | 2317.00000 | 376.100498 | 292.436990 | 6.676340 | 30.552578 | 10500.000000 | 3500.000000 | 17.083951 |
[168]:
df = sampled_params_df_medium_regional[
    ["grav_proximity", "grav_line_spacing"]
].drop_duplicates()
df = df.sort_values("grav_line_spacing", ascending=False)
df = pd.concat(
    [
        df,
        pd.DataFrame(
            {
                "grav_line_spacing": np.arange(
                    round(df.grav_line_spacing.min()),
                    round(df.grav_line_spacing.max()) + 1,
                    1,
                )
            }
        ),
    ]
).drop_duplicates(subset="grav_line_spacing")
df = df.sort_values("grav_line_spacing", ascending=False).reset_index(drop=True)

df = synthetic.scipy_interp1d(
    df,
    to_interp="grav_proximity",
    interp_on="grav_line_spacing",
    method="cubic",
)
df = df[["grav_line_spacing", "grav_proximity"]]

df = df[
    df.grav_line_spacing.isin(
        np.arange(
            round(sampled_params_df_medium_regional.grav_line_spacing.min()),
            round(sampled_params_df_medium_regional.grav_line_spacing.max()) + 1,
            10,
        )
    )
]
df
[168]:
| grav_line_spacing | grav_proximity | |
|---|---|---|
| 3 | 56.0 | 8.016317 |
| 13 | 46.0 | 6.580356 |
| 24 | 36.0 | 5.139188 |
| 35 | 26.0 | 3.736880 |
| 46 | 16.0 | 2.294572 |
| 60 | 6.0 | 0.851066 |
[31]:
fig = synth_plotting.plot_2var_ensemble(
    sampled_params_df_medium_regional,
    figsize=figsize,
    x="grav_proximity",
    x_title="Gravity data proximity (km)",
    y="grav_noise_levels",
    y_title="Gravity noise (mGal)",
    background="final_inversion_rmse",
    background_title="Bathymetry RMSE (m)",
    background_robust=True,
    plot_contours=contours,
    contour_color="cyan",
    background_cpt_lims=cpt_lims,
    colorbar=False,
    constrained_layout=False,
)
plt.gcf().text(
    0.5, 1.01, "b) Medium-variability regional", fontsize=20, va="bottom", ha="center"
)
ax = fig.get_axes()[0]

# add second x axis with flight line spacing
ax2 = ax.twiny()
ax2.set_xlim(ax.get_xlim())
x_tick_vals = df.grav_proximity.unique()
x_tick_labels = df.grav_line_spacing.unique()
x_tick_labels = [int(x) for x in x_tick_labels]
ax2.set_xticks(x_tick_vals)
ax2.set_xticklabels(x_tick_labels)
ax2.grid(False)
ax2.set_xlabel("Flight line spacing (km)")

# add third x axis for flight distance
ax3 = ax.twiny()
ax3.set_xlim(ax.get_xlim())
x_tick_vals = sampled_params_df_medium_regional.grav_proximity.unique()
x_tick_labels = sampled_params_df_medium_regional.flight_kms.unique()
inds_to_remove = [-2, -3, -4, -6, -8]
x_tick_vals = np.delete(x_tick_vals, inds_to_remove)
x_tick_labels = np.delete(x_tick_labels, inds_to_remove)
x_tick_labels = [round(x) for x in x_tick_labels]
ax3.set_xticks(x_tick_vals)
ax3.set_xticklabels(x_tick_labels)
ax3.grid(False)
ax3.set_xlabel("Total flight distance (km)")
ax3.xaxis.set_ticks_position("bottom")
ax3.xaxis.set_label_position("bottom")
ax3.spines["bottom"].set_position(("outward", 40))

ax.yaxis.set_visible(False)

fig.savefig(
    "../paper/figures/Ross_Sea_noise_vs_spacing_medium_regional_2var_supplement.png",
    bbox_inches="tight",
    dpi=300,
)
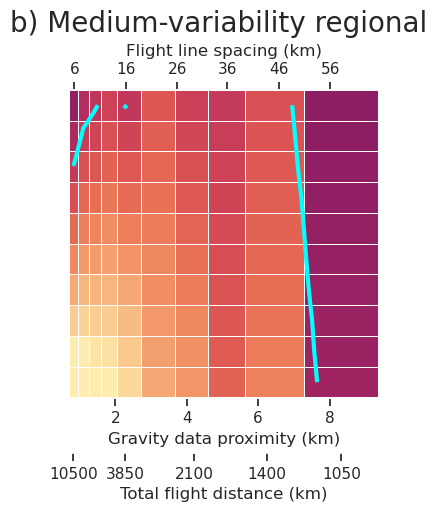
[24]:
fig = synth_plotting.plot_ensemble_as_lines(
    sampled_params_df_medium_regional,
    figsize=(figsize[0], figsize[1] / 2),
    x="grav_noise_levels",
    x_label="Gravity noise (mGal)",
    y="final_inversion_rmse",
    y_label="Bathymetry RMSE (m)",
    groupby_col="grav_line_spacing",
    cbar_label="Line spacing (km)",
    trend_line=True,
    horizontal_line=contours,
    y_lims=line_plot_ylims,
    colorbar=False,
    slope_min_max=True,
    slope_decimals=1,
)
plt.gcf().text(0.15, 0.95, "e)", fontsize=16, va="top", ha="left")

ax = fig.get_axes()[0]
ax.yaxis.set_visible(False)

plt.savefig(
    "../paper/figures/Ross_Sea_noise_vs_spacing_medium_regional_bathy_error_vs_grav_noise_supplement.png",
    bbox_inches="tight",
    dpi=300,
)
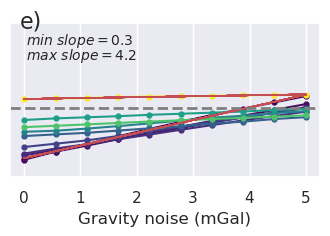
[25]:
fig = synth_plotting.plot_ensemble_as_lines(
    sampled_params_df_medium_regional,
    figsize=(figsize[0], figsize[1] / 2),
    x="flight_kms",
    x_label="Flight distance (km)",
    y="final_inversion_rmse",
    y_label="Bathymetry RMSE (m)",
    groupby_col="grav_noise_levels",
    cbar_label="Gravity noise (mGal)",
    horizontal_line=contours,
    y_lims=line_plot_ylims,
    colorbar=False,
)
plt.gcf().text(0.15, 0.95, "h)", fontsize=16, va="top", ha="left")

ax = fig.get_axes()[0]

ax.yaxis.set_visible(False)

plt.savefig(
    "../paper/figures/Ross_Sea_noise_vs_spacing_medium_regional_bathy_error_vs_grav_spacing_supplement.png",
    bbox_inches="tight",
    dpi=300,
)
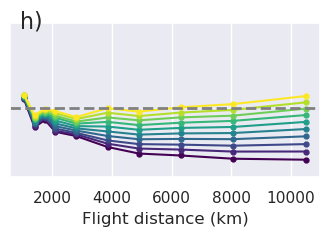
[172]:
x = "grav_line_spacing"
x2 = "grav_proximity"
fig = synth_plotting.plot_ensemble_as_lines(
    sampled_params_df_medium_regional,
    figsize=(figsize[0], figsize[1] / 2),
    x=x,
    x_label="Line spacing (km)",
    y="final_inversion_rmse",
    y_label="Bathymetry RMSE (m)",
    groupby_col="grav_noise_levels",
    cbar_label="Gravity noise (mGal)",
    horizontal_line=contours,
    y_lims=line_plot_ylims,
    colorbar=False,
    trend_line=True,
    slope_max=True,
    trend_line_text_loc=(0.5, 0.95),
)
plt.gcf().text(0.15, 0.95, "k)", fontsize=16, va="top", ha="left")

ax = fig.get_axes()[0]

df = sampled_params_df_medium_regional[[x2, x]].drop_duplicates()

a, b = df[x].min(), df[x].max()

df = pd.concat([df, pd.DataFrame({x: ax.get_xticks()})]).drop_duplicates(subset=[x])

df = df[df[x].between(a, b)]

df = synthetic.scipy_interp1d(
    df,
    to_interp=x2,
    interp_on=x,
    method="cubic",
)
df = df[df[x].isin(ax.get_xticks())].sort_values(x2)

# add second x axis for line spacing
ax2 = ax.twiny()
ax2.set_xlim(ax.get_xlim())

ax2.set_xticks(df[x])
ax2.set_xticklabels([round(i, 1) for i in df[x2]])
ax2.grid(False)
ax2.set_xlabel("Median proximity (km)")
ax2.xaxis.set_ticks_position("bottom")
ax2.xaxis.set_label_position("bottom")
ax2.spines["bottom"].set_position(("outward", 40))

ax.yaxis.set_visible(False)
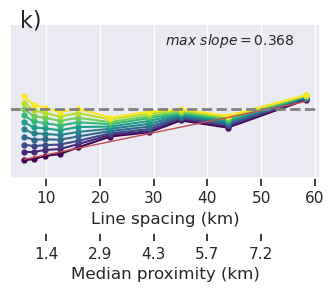
[26]:
x = "grav_proximity"
fig = synth_plotting.plot_ensemble_as_lines(
    sampled_params_df_medium_regional,
    figsize=(figsize[0], figsize[1] / 2),
    x=x,
    x_label="Gravity data proximity (km)",
    y="final_inversion_rmse",
    y_label="Bathymetry RMSE (m)",
    groupby_col="grav_noise_levels",
    cbar_label="Gravity noise (mGal)",
    horizontal_line=contours,
    y_lims=line_plot_ylims,
    colorbar=False,
    trend_line=True,
    slope_max=True,
    trend_line_text_loc=(0.5, 0.95),
    slope_decimals=1,
)
plt.gcf().text(0.15, 0.95, "k)", fontsize=16, va="top", ha="left")

ax = fig.get_axes()[0]

ax.yaxis.set_visible(False)

plt.savefig(
    "../paper/figures/Ross_Sea_noise_vs_spacing_medium_regional_bathy_error_vs_grav_spacing_2_supplement.png",
    bbox_inches="tight",
    dpi=300,
)
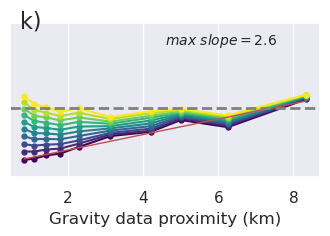
Strong regional
[27]:
sampled_params_df_strong_regional[
    [
        "final_inversion_rmse",
        "final_inversion_topo_improvement_rmse",
    ]
].describe()
[27]:
| final_inversion_rmse | final_inversion_topo_improvement_rmse | |
|---|---|---|
| count | 100.000000 | 100.000000 |
| mean | 22.028173 | 3.949177 |
| std | 4.897815 | 4.897815 |
| min | 11.776672 | -7.130729 |
| 25% | 18.913769 | 1.572406 |
| 50% | 22.200469 | 3.776881 |
| 75% | 24.404943 | 7.063580 |
| max | 33.108079 | 14.200677 |
[28]:
df = sampled_params_df_strong_regional[
    ["grav_proximity", "grav_line_spacing"]
].drop_duplicates()
df = df.sort_values("grav_line_spacing", ascending=False)
df = pd.concat(
    [
        df,
        pd.DataFrame(
            {
                "grav_line_spacing": np.arange(
                    round(df.grav_line_spacing.min()),
                    round(df.grav_line_spacing.max()) + 1,
                    1,
                )
            }
        ),
    ]
).drop_duplicates(subset="grav_line_spacing")
df = df.sort_values("grav_line_spacing", ascending=False).reset_index(drop=True)

df = synthetic.scipy_interp1d(
    df,
    to_interp="grav_proximity",
    interp_on="grav_line_spacing",
    method="cubic",
)
df = df[["grav_line_spacing", "grav_proximity"]]

df = df[
    df.grav_line_spacing.isin(
        np.arange(
            round(sampled_params_df_strong_regional.grav_line_spacing.min()),
            round(sampled_params_df_strong_regional.grav_line_spacing.max()) + 1,
            10,
        )
    )
]
df
[28]:
| grav_line_spacing | grav_proximity | |
|---|---|---|
| 3 | 56.0 | 8.016317 |
| 13 | 46.0 | 6.580356 |
| 24 | 36.0 | 5.139188 |
| 35 | 26.0 | 3.736880 |
| 46 | 16.0 | 2.294572 |
| 60 | 6.0 | 0.851066 |
[32]:
fig = synth_plotting.plot_2var_ensemble(
    sampled_params_df_strong_regional,
    figsize=figsize,
    x="grav_proximity",
    x_title="Gravity data proximity (km)",
    y="grav_noise_levels",
    y_title="Gravity noise (mGal)",
    background="final_inversion_rmse",
    background_title="Bathymetry RMSE (m)",
    background_robust=True,
    plot_contours=contours,
    contour_color="cyan",
    background_cpt_lims=cpt_lims,
    constrained_layout=False,
)
plt.gcf().text(
    0.5, 1.01, "b) High-variability regional", fontsize=20, va="bottom", ha="center"
)
ax = fig.get_axes()[0]

# add second x axis with flight line spacing
ax2 = ax.twiny()
ax2.set_xlim(ax.get_xlim())
x_tick_vals = df.grav_proximity.unique()
x_tick_labels = df.grav_line_spacing.unique()
x_tick_labels = [int(x) for x in x_tick_labels]
ax2.set_xticks(x_tick_vals)
ax2.set_xticklabels(x_tick_labels)
ax2.grid(False)
ax2.set_xlabel("Flight line spacing (km)")

# add third x axis for flight distance
ax3 = ax.twiny()
ax3.set_xlim(ax.get_xlim())
x_tick_vals = sampled_params_df_strong_regional.grav_proximity.unique()
x_tick_labels = sampled_params_df_strong_regional.flight_kms.unique()
inds_to_remove = [-2, -3, -4, -6, -8]
x_tick_vals = np.delete(x_tick_vals, inds_to_remove)
x_tick_labels = np.delete(x_tick_labels, inds_to_remove)
x_tick_labels = [round(x) for x in x_tick_labels]
ax3.set_xticks(x_tick_vals)
ax3.set_xticklabels(x_tick_labels)
ax3.grid(False)
ax3.set_xlabel("Total flight distance (km)")
ax3.xaxis.set_ticks_position("bottom")
ax3.xaxis.set_label_position("bottom")
ax3.spines["bottom"].set_position(("outward", 40))

ax.yaxis.set_visible(False)

fig.savefig(
    "../paper/figures/Ross_Sea_noise_vs_spacing_strong_regional_2var.png",
    bbox_inches="tight",
    dpi=300,
)
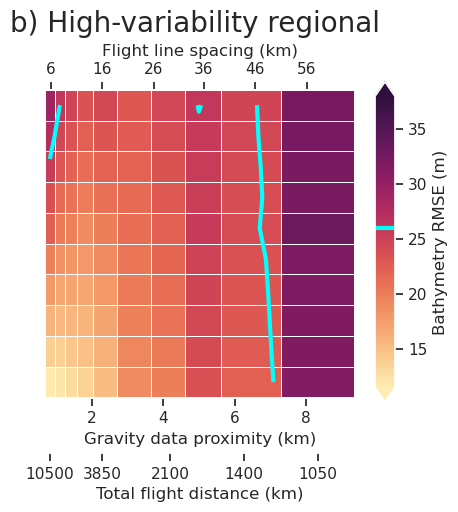
[33]:
fig = synth_plotting.plot_2var_ensemble(
    sampled_params_df_strong_regional,
    figsize=figsize,
    x="grav_proximity",
    x_title="Gravity data proximity (km)",
    y="grav_noise_levels",
    y_title="Gravity noise (mGal)",
    background="final_inversion_rmse",
    background_title="Bathymetry RMSE (m)",
    background_robust=True,
    plot_contours=contours,
    contour_color="cyan",
    background_cpt_lims=cpt_lims,
    constrained_layout=False,
)
plt.gcf().text(
    0.5, 1.01, "c) High-variability regional", fontsize=20, va="bottom", ha="center"
)
ax = fig.get_axes()[0]

# add second x axis with flight line spacing
ax2 = ax.twiny()
ax2.set_xlim(ax.get_xlim())
x_tick_vals = df.grav_proximity.unique()
x_tick_labels = df.grav_line_spacing.unique()
x_tick_labels = [int(x) for x in x_tick_labels]
ax2.set_xticks(x_tick_vals)
ax2.set_xticklabels(x_tick_labels)
ax2.grid(False)
ax2.set_xlabel("Flight line spacing (km)")

# add third x axis for flight distance
ax3 = ax.twiny()
ax3.set_xlim(ax.get_xlim())
x_tick_vals = sampled_params_df_strong_regional.grav_proximity.unique()
x_tick_labels = sampled_params_df_strong_regional.flight_kms.unique()
inds_to_remove = [-2, -3, -4, -6, -8]
x_tick_vals = np.delete(x_tick_vals, inds_to_remove)
x_tick_labels = np.delete(x_tick_labels, inds_to_remove)
x_tick_labels = [round(x) for x in x_tick_labels]
ax3.set_xticks(x_tick_vals)
ax3.set_xticklabels(x_tick_labels)
ax3.grid(False)
ax3.set_xlabel("Total flight distance (km)")
ax3.xaxis.set_ticks_position("bottom")
ax3.xaxis.set_label_position("bottom")
ax3.spines["bottom"].set_position(("outward", 40))

ax.yaxis.set_visible(False)

fig.savefig(
    "../paper/figures/Ross_Sea_noise_vs_spacing_strong_regional_2var_supplement.png",
    bbox_inches="tight",
    dpi=300,
)

[34]:
fig = synth_plotting.plot_ensemble_as_lines(
    sampled_params_df_strong_regional,
    figsize=(figsize[0], figsize[1] / 2),
    x="grav_noise_levels",
    x_label="Gravity noise (mGal)",
    y="final_inversion_rmse",
    y_label="Bathymetry RMSE (m)",
    groupby_col="grav_line_spacing",
    cbar_label="Line spacing (km)",
    trend_line=True,
    horizontal_line=contours,
    y_lims=line_plot_ylims,
    slope_min_max=True,
    slope_decimals=1,
)
plt.gcf().text(0.15, 0.95, "d)", fontsize=16, va="top", ha="left")

ax = fig.get_axes()[0]
ax.yaxis.set_visible(False)

plt.savefig(
    "../paper/figures/Ross_Sea_noise_vs_spacing_strong_regional_bathy_error_vs_grav_noise.png",
    bbox_inches="tight",
    dpi=300,
)

[35]:
fig = synth_plotting.plot_ensemble_as_lines(
    sampled_params_df_strong_regional,
    figsize=(figsize[0], figsize[1] / 2),
    x="grav_noise_levels",
    x_label="Gravity noise (mGal)",
    y="final_inversion_rmse",
    y_label="Bathymetry RMSE (m)",
    groupby_col="grav_line_spacing",
    cbar_label="Line spacing (km)",
    trend_line=True,
    horizontal_line=contours,
    y_lims=line_plot_ylims,
    slope_min_max=True,
    slope_decimals=1,
)
plt.gcf().text(0.15, 0.95, "f)", fontsize=16, va="top", ha="left")

ax = fig.get_axes()[0]
ax.yaxis.set_visible(False)

plt.savefig(
    "../paper/figures/Ross_Sea_noise_vs_spacing_strong_regional_bathy_error_vs_grav_noise_supplement.png",
    bbox_inches="tight",
    dpi=300,
)
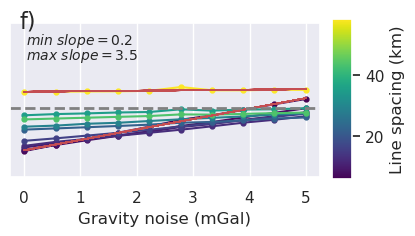
[36]:
fig = synth_plotting.plot_ensemble_as_lines(
    sampled_params_df_strong_regional,
    figsize=(figsize[0], figsize[1] / 2),
    x="flight_kms",
    x_label="Flight distance (km)",
    y="final_inversion_rmse",
    y_label="Bathymetry RMSE (m)",
    groupby_col="grav_noise_levels",
    cbar_label="Gravity noise (mGal)",
    horizontal_line=contours,
    y_lims=line_plot_ylims,
)
plt.gcf().text(0.15, 0.95, "f)", fontsize=16, va="top", ha="left")

ax = fig.get_axes()[0]

ax.yaxis.set_visible(False)

plt.savefig(
    "../paper/figures/Ross_Sea_noise_vs_spacing_strong_regional_bathy_error_vs_grav_spacing.png",
    bbox_inches="tight",
    dpi=300,
)
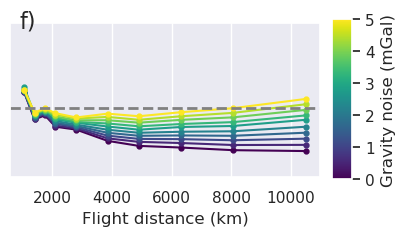
[37]:
fig = synth_plotting.plot_ensemble_as_lines(
    sampled_params_df_strong_regional,
    figsize=(figsize[0], figsize[1] / 2),
    x="flight_kms",
    x_label="Flight distance (km)",
    y="final_inversion_rmse",
    y_label="Bathymetry RMSE (m)",
    groupby_col="grav_noise_levels",
    cbar_label="Gravity noise (mGal)",
    horizontal_line=contours,
    y_lims=line_plot_ylims,
)
plt.gcf().text(0.15, 0.95, "i)", fontsize=16, va="top", ha="left")

ax = fig.get_axes()[0]

ax.yaxis.set_visible(False)

plt.savefig(
    "../paper/figures/Ross_Sea_noise_vs_spacing_strong_regional_bathy_error_vs_grav_spacing_supplement.png",
    bbox_inches="tight",
    dpi=300,
)

[179]:
x = "grav_line_spacing"
x2 = "grav_proximity"
fig = synth_plotting.plot_ensemble_as_lines(
    sampled_params_df_strong_regional,
    figsize=(figsize[0], figsize[1] / 2),
    x=x,
    x_label="Line spacing (km)",
    y="final_inversion_rmse",
    y_label="Bathymetry RMSE (m)",
    groupby_col="grav_noise_levels",
    cbar_label="Gravity noise (mGal)",
    horizontal_line=contours,
    y_lims=line_plot_ylims,
    trend_line=True,
    slope_max=True,
    trend_line_text_loc=(0.5, 0.95),
)
plt.gcf().text(0.15, 0.95, "l)", fontsize=16, va="top", ha="left")

ax = fig.get_axes()[0]

df = sampled_params_df_strong_regional[[x2, x]].drop_duplicates()

a, b = df[x].min(), df[x].max()

df = pd.concat([df, pd.DataFrame({x: ax.get_xticks()})]).drop_duplicates(subset=[x])

df = df[df[x].between(a, b)]

df = synthetic.scipy_interp1d(
    df,
    to_interp=x2,
    interp_on=x,
    method="cubic",
)
df = df[df[x].isin(ax.get_xticks())].sort_values(x2)

# add second x axis for line spacing
ax2 = ax.twiny()
ax2.set_xlim(ax.get_xlim())

ax2.set_xticks(df[x])
ax2.set_xticklabels([round(i, 1) for i in df[x2]])
ax2.grid(False)
ax2.set_xlabel("Median proximity (km)")
ax2.xaxis.set_ticks_position("bottom")
ax2.xaxis.set_label_position("bottom")
ax2.spines["bottom"].set_position(("outward", 40))

ax.yaxis.set_visible(False)
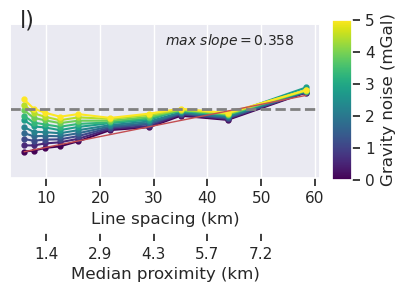
[38]:
x = "grav_proximity"
fig = synth_plotting.plot_ensemble_as_lines(
    sampled_params_df_strong_regional,
    figsize=(figsize[0], figsize[1] / 2),
    x=x,
    x_label="Gravity data proximity (km)",
    y="final_inversion_rmse",
    y_label="Bathymetry RMSE (m)",
    groupby_col="grav_noise_levels",
    cbar_label="Gravity noise (mGal)",
    horizontal_line=contours,
    y_lims=line_plot_ylims,
    trend_line=True,
    slope_max=True,
    trend_line_text_loc=(0.5, 0.95),
    slope_decimals=1,
)
plt.gcf().text(0.15, 0.95, "h)", fontsize=16, va="top", ha="left")

ax = fig.get_axes()[0]

ax.yaxis.set_visible(False)

plt.savefig(
    "../paper/figures/Ross_Sea_noise_vs_spacing_strong_regional_bathy_error_vs_grav_spacing_2.png",
    bbox_inches="tight",
    dpi=300,
)
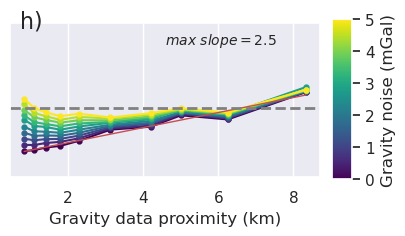
[39]:
x = "grav_proximity"
fig = synth_plotting.plot_ensemble_as_lines(
    sampled_params_df_strong_regional,
    figsize=(figsize[0], figsize[1] / 2),
    x=x,
    x_label="Gravity data proximity (km)",
    y="final_inversion_rmse",
    y_label="Bathymetry RMSE (m)",
    groupby_col="grav_noise_levels",
    cbar_label="Gravity noise (mGal)",
    horizontal_line=contours,
    y_lims=line_plot_ylims,
    trend_line=True,
    slope_max=True,
    trend_line_text_loc=(0.5, 0.95),
    slope_decimals=1,
)
plt.gcf().text(0.15, 0.95, "l)", fontsize=16, va="top", ha="left")

ax = fig.get_axes()[0]

ax.yaxis.set_visible(False)

plt.savefig(
    "../paper/figures/Ross_Sea_noise_vs_spacing_strong_regional_bathy_error_vs_grav_spacing_2_supplement.png",
    bbox_inches="tight",
    dpi=300,
)